Procedia Social and Behavioral Sciences
Available online at www.sciencedirect.com
Procedia Social and Behavioral Sciences 00 (2011) 000–000 Procedia - Social and Behavioral Sciences 31 (2012) 861 – 865
www.elsevier.com/locate/procedia
WCLTA 2011
Service quality evaluating models Hamid Tohidi*, Mohammad Mehdi Jabbari Department of Industrial Engineering, South Tehran Branch, Islamic Azad University, Tehran, Iran Department of Electrical Engineering, South Tehran Branch, Islamic Azad University, Tehran, Iran
Abstract There are models to quality evaluating of organizations. In this paper seven models have been studied and their features have been described. Each One assesses factors to this evaluating such as public assessment for self-assessment of governmental organizations which it‟s factors are on leadership, resources, etc. In quality of services features model, some attributes has studied such as physical facilities and staff behavior. Keywords: Quality evaluating, Services quality, Organizational excellence.
1. Introduction
1-1.Public assessment framework model – organization excellence Public assessment framework is a tool that is used for self-assessment of government organization. The model was made by means of models‟ concepts and experiences of Europe‟s superiority model (this model has been presented by organization excellence) self-assessment with public assessment framework, in contrast to Criteria„s of organization excellence model, is more moderate process. Criteria‟s which are tested through public assessment framework are: leadership, policy and strategy staffing, resources and foreign cooperation, process management and modification, customer‟s results, people‟s results, personnel‟s, it‟s effect on society and key results of implementation and performance. Organizational excellence model will recognize the degree of differences that exist between various organizations and countries [1,5]. 2-1. Balance –finding Balance –finding validity as a new expression devotes to pioneers in “Rank Zyrax” institute. Balance – finding means the process of recognizing understanding and matching processes and performance indicators of wellknown organization in the world aimed at improving productivity or organization‟s performance. 3.2 Gronerz model Gronerz, in discussion about the relationship with services quality, introduces three dimensions: Technical quality of output: technical quality of output, that mentions customers evaluation of the actual output of the service encountered, has been perceived as the most important element of motivation. Output is the thing which a customer's receives from an organization [3,6,7]. Exposure to operational service quality: process quality or interactional; demonstrate the customer's evaluation of processes quality and procedures in production and providing services to the customers. By paying attention to synchronizing production and service using, process quality will usually be evaluated when the customer is fulfilling services through physical relation between service supplier and customer or technical equipment or personnel‟s. * Hamid Tohidi E-mail address:
[email protected]
1877-0428 © 2011 Published by Elsevier Ltd. Selection and/or peer-review under responsibility of Prof. Hüseyin Uzunboylu. Open access under CC BY-NC-ND license. doi:10.1016/j.sbspro.2011.12.157
862
Hamid Tohidi and Mohammad Mehdi Social Jabbariand / Procedia - Social and Behavioral Sciences 31 (2012) 861 – 865 Hamid Tohidi / Procedia Behavioral Sciences 00 (2011) 000–000
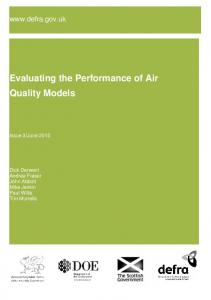
Company’s mental image: this dimension is related to the customer‟s understanding of service organization .mental image depends on output quality and quality of task , price ,external communication activity ,physical status cleanliness of branch , merit and behavior of personnel‟s [5,8]. Total quality
Mental image (branch/corporatio nnn)
Technical
Functional
quality
quality process
output: what
How
Figure 1: Service quality dimensions of Gronerz model
4.2. Lehtinen model Whereas, most of services quality dimensions differ from one researcher to another, but some researchers agree that services quality consists of three basic dimensions [2,9]. These two researchers have presented three dimensions for services quality. Physical quality: physical quality demonstrates to the products or supportive cases of products and services. Interactive quality: interactive quality mentions to the interactions between customers and service deliverers. Organization quality: organization quality related to the mental image and general understanding of the organization .organization quality is an insensible dimension, therefore, understanding organization‟s total quality is according to the above mentioned factors. 5.2. The quality of service features model Hay wood farmer (1997) expresses that service organization will achieve high quality, if they always meet the customer‟s expectations and conceptions Therefore the first step in developing a service quality model is separating features to different groups. In general, the services have three basic features [4,10]: Physical facilities, procedures and processes Behavior of personnel Professional judgment Each feature consists of several factors .In this model; each set of features makes a vertex of triangle. The function of management is determining where the organization is placed in this shape. It will enable organization to supply services that cause the elements to be constant internally and meet the special needs that focus on special needs of categories targeted market .In services for appropriate position management should consider three operational elements as: Degree of customization of service Applied degree Degree of contact and interaction
Hamid Tohidi and Hamid Mohammad Jabbari / Procedia - Social and Behavioral Sciences 31 (2012) 861 – 865 TohidiMehdi / Procedia Social and Behavioral Sciences 00 (2011) 000–000
863
6.2. Modified service Journey model Customers evaluate services they receive. In determining their satisfaction, their expectation of services has important role, and so understanding how these expectation from will implement necessary function to deliver services with high quality. On the basis of the model Nash „introduced service journey model and the experience of every level and formed expectation before purchasing, will help to form next level expectation. The model initiates with requirement and if customers' requirements confirm perceived services, the purchasing will occur. The relationships of lesson and fame are key elements with which customers select deliverer of services. Furthermore, promotional and communicative activities, customers perceptions in the steps of " participation " " renunciation " , "reflection " are affected by those elements [6,11]. 7.2. The customer processing frame work model The model which is introduced by Johnson ,is according to features of Nash model .It will reveal the important points of beginning ,length and ending of service delivering (where the experience in each point form next level expectations, customer‟s expectation s are dynamic and are affected by several factors in each level of service delivering. These two models will help management to recognize the domains that influence customer‟s understanding of service quality and also when they need to centralize their efforts on quality control and improvement these two models mostly focus on inside (rather outside) and view the quality through customers operation and processes, although they will present practical tools for improvement of service quality [5,12]. 8.2. Seroqual model Service quality concentrates on perceived quality that is introduced as customers judgment about excellence & perfection of an event [2,14]. Perceived quality is a form of altitude that results from comparison of perceived performance to expected performance. Such comparison is the basis of Seroqual model which introduces service quality as a gap between the expected level of services and perceived level of services [3,13]. Parasoraman and the colleague (1985) according to the information gained from 12 centralized groups of customers , expectations (from the services they should receive) and perceptions (services they should really receive ) compared the groups in ten dimensions and according to that information established Seroqual base model. The 10 dimensions are: tangible , reliability ,accountability ,communication , validity ,security ,merit , customers perception ,humility and access .These researchers in their future research decreased 10 dimensions to 5 dimensions : Guarantee : The ability to fulfill committed services in a secure and exact way . Accountability: motivation for helping customers and presenting services fast. Reliability: knowledge and humility of personnel and their ability to create reliability of customers Sympathy: paying attention to every customer. Tangibles: the existence of physical facilities, equipments, personnel‟s and communicative devices. In order to consider the gap between customers expectation and perceptions, Parasoraman and his colleagues (1998) have made a questionnaire with 22 question that was named Seroqual. understanding and expectations of service receivers about these question have been considered in a questionnaire form and 5 gaps through them was recognized and considered .The first 4 gape in the model , is the main producers of quality gap considered by customers and the fifth gap is the customers identified base about service quality. The gap is the different between customers expectations about ideal quality and will test their perceptions of actual services received by themselves which is the base of Seroqual tool [,11]. Seroqual gap & tool model has probably been the most current approach used for testing quality. Most service marketing researches, concentrate on testing service quality by using Seroqual tools [2,15]. In most service industries, Seroqual was used for testing service quality. These industries consist of health, banking, ready meals, remote connection , retailing chain, informational systems, and library services [3] Parasurman, Zeithaml and Berry (1990) suggested a mental model to test service quality by testing the differences between customers expectations and perceptions of services actual quality When the expectations has been met very well the delivered service quality will be favorable. In accordance with the above mentioned subjects, we consider quality within 5 dimension which contains: guarantee, accountability reliability, sympathy and tangibles and is known as Seroqual method [4].
864
Hamid Tohidi and Mohammad Mehdi Social Jabbariand / Procedia - Social and Behavioral Sciences 31 (2012) 861 – 865 Hamid Tohidi / Procedia Behavioral Sciences 00 (2011) 000–000
The difference between expectations and perceptions of actual services offered will be recognized when the expectations don‟t reconcile. Patterson (1993) knows satisfaction, in relation to the customers purchasing expectation and performance understanding and determining the degree of difference as lack of reconciliation. By publication of Seroqual‟s first results, the discussions for how to test service qualities better, started in periodical decades and there after lots of effort or productivity of Seroqual tool was determined and agreed. Seroqual tools for testing service quality is useful because key dimensions of service quality can be tested. Furthermore, Asubonten (1996) claimed that Seroqual is favorite for managers because it com bines the simple city of usage and flexibility together. Managers know that gained results are not probably correct intentionally but help them in showing the way[4]. Therefore some researchers believe that it has practical and theoretical weakness. Seroqual‟s five dimensions may cover organization‟s dimensions and may not be public and service quality dimensions are not predetermined. Babakus and Boller (1992) suggested that the numbers of service quality dimensions depend son offered service features . Andersson (1992) in his previous social researches, noticed to special economical theories, statistic and psychological theories. The way to compare gap between expectation‟s and perceptions has been criticized. Canon and Tilver (1994-1992) believe that Seroqual has deficiency in some cases which is due to misjudgment and therefor applying in compatible model. Babakus and Boller 1992 concluded that using gap point of view in service quality is intrinsically interesting but they believed that differences between ranks will not give extra information than acquired information via Seroqual. The basic element in analyzing gap is the degree of perceptions. Lewis (1993) criticized using 7 Likret because there weren‟t linguistic equivalences for
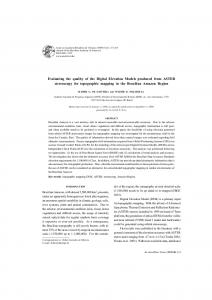
ranks between 2-6 and respondent may use last choices more. Babakus and Mangold (1992) suggested likret which decreases structure volume and speed of accountability .Furthermore, using two questionnaire for expectations and perceptions may cause tiredness and complexity and consume time [5]. Word of mouth
Determiner of service Quality 1- access 2-communication 3- merit 4-humility 5-relibility 6-validity 7- accountability 8-security 9- tangibles 10-underestanding customer
Personal needs
Pervious experiences
Delivered Services Perceived Service quality Perceived Service
Figure 2: logs to determine the quality of services
Although great efforts has been done to divide service quality to process quality and output quality but the efforts for recognition of service quality determined elements were surface and don‟t have enough details. On the basis of effort that Parasuraman and the colleague presented various factor for testing service quality that will mentioned later. The researchers efforts is a base for future research. Parasuraman and the colleague devoted to dimensions for testing quality which consist of:
Hamid Tohidi and Mohammad Mehdi JabbariSocial / Procedia - Social and Behavioral Sciences 31 (2012) 861 – 865 Hamid Tohidi / Procedia and Behavioral Sciences 00 (2011) 000–000
865
Validity: the ability to present services correctly in the least period of time Accountability: the ability to investigate complaints and improve service in an effective way. Reliability: the extent to which the services are believed. Fame and validity of organization, personnel‟s behavior in front of counter, au have participated in reliability. Merit: personnel should have information, knowledge and required skin for fulfilling services in an effective way. Access: simple work-hours in order calling by telephone became possible. Humility: politeness, respect, attention and friendly behavior toward customer. Security: not feeling danger, risk or suspect ion Communication: in forming customers about the services in a way to be understood by themselves. Tangibles factors: this factor points the physical status, decoration appearance and cleanliness of the place service delivered, cleanliness of personnel‟s and modern facilities.
Understanding the customer: this dimension requires effort to understand customer‟s special requirements, personal attention and distinguish standing customers. These researchers in their future testing found a correlation between communication, merit, humility, validity, security, access and understanding so, they combined two general dimensions of confidence and sympathy. In this order they applied five dimensions of tangible factors. validity, accountability, confidence, and sympathy as a base for making tools to test service quality which is famous as service quality scale. 2. Conclusion
Although great efforts has been done to divide service quality to process quality and output quality but the efforts for recognition of service quality determined elements were surface and don‟t have enough details. Some Of quality evaluating models are discussing on organizational structure and some others on customer expects, which are dynamic. If organization or corporation can pass customer expects, it has high quality. References 1. B.L Pollak,2008.The number of the service quality and satisfaction relationship Empirical evidence for existence of satisfiers and dissatisfires.Jornal of Managing Service Quality ,18(6),537-558. 2.K. Kitchroen, Literature Review: Service Quality in Educational 3.Linda K. Nozick *, Mark A. 2001, Turnquist, Inventory, transportation, service quality and the location of distribution centers, European Journal of Operational Research 129 362-371 4.Daft RL., Weick KE.,1984, Toward a model of organizations as interpretation systems, Academic Management Review 9(2):284 –95 5.Daft, RL (1992). Organization Theory and Design. St Paul, MN: West. 6.Christopher G.Worley, Edward E. Lawler. (2010). Agility and Organization Design. Organizational Dynamics, www. Elsevier.com/Iocate/Orgdyn . 5.Tohidi, H.,2011, „Modelling of Business Services in Service Oriented Enterprises‟, Procedia-Computer Science Journal, Vol. 3, pp.1147-1156. 6. Tohidi , H., 2011, „The Role of Risk Management in IT systems of organizations‟ Procedia-Computer Science Journal, Vol. 3, pp. 881-887. 7.Tohidi, H., 2011, „Human Resources Management main role in Information Technology project management‟ , Procedia-Computer Science Journal Vol. 3, pp 925-929. 8. Tohidi , H., Jabbari, M. M., 2011, „The main requirements to implement an electronic city‟ Procedia-Computer Science Journal, Vol. 3, pp.1106-1110. 9.Tohidi, H., 2011,„Review the benefits of using Value Engineering in Information Technology Project Management‟, Procedia-Computer Science Journal, Vol. 3, pp.917-924. 10. Tohidi, H., 2011, „Teamwork Productivity & Effectiveness in an Organization base on Rewards, Leadership, Training, Goals, Wage, Size, Motivation, Measurement and Information Technolog‟, Procedia-Computer Science Journal, Vol. 3, pp.1137-1146. 11. Tohidi, H., 2011, „E-government and its different dimensions: Iran‟ ,Procedia-Computer Science Journal, Vol. 3, pp.1101-1105. 12.Tohidi,H., Afshar,A.A., Jafari, A. 2010, „Using Balanced Scored Card in Educational Organizations‟, Procedia - Social and Behavioral Sciences Vol. 2 Issue 2, pp.5544-5548. 13.Tohidi, H., Afshar, A.A., Jafari, A., 2010, „Strategic planning in Iranian educational organizations‟, Procedia - Social and Behavioral Sciences, Vol. 2,Issue 2, pp.3904-3908. 14.Tohidi, H., Tarokh, M.J., 2006, „Productivity Outcomes of Teamwork As an Effect of Information Technology & Team Size, International Journal of Production Economics, Vol. 103,Issue 2, pp.610-615. 15.Tohidi, H., Tarokh, M.J., 2006, „Modeling and Analysis of Productivity Teamwork Based on Information Technology‟, International Journal of Production Research, Vol. 44,No.9, p.p3023-3031.