... transcription devices; his arguments are useful cautions for the too-eager technologist. .... The art of this master singer, however, lies not in the simple tune.
Music Perception Fall 1988, Vol. 6, No.1, 35-64
Shape and Motion in the Microstructure of Song ROBERT O. GJERDINGEN Carleton College The early hopes for the Seeger melograph, a device for recording the pitch and intensity of vocal performances, have not been realized because musicologists found the graphic traces of pitch and intensity too difficult to interpret. In this article, proposals are advanced for redesigning the melograph to provide researchers with more symbolically meaningful information. This involves abandoning the notion of fully separable parameters, relaxing the constraint that representations be culturally neutral, and developing ways to represent musical motion qua motion. The discussion is illustrated with redesigned melograms drawn from analyses of a particularly florid excerpt of South-Indian singing. Comparisons between the performances of a South-Indian singer and the performances of two of her students suggest ways in which cultural conditioning can affect vocal performance.
First rehearse this song by roate, To each word a warbling note. A Midsummer Night’s Dream
Poets know that notes warble. They know that notes glide and soar, quaver and shake, bend and curve sinuously in ways that communicate subtle feelings to receptive listeners. Those of us who describe song more prosaically also know that notes warble. But we mistrust poets’ metaphors. We realize that when plucked from the time and place in which they were uttered, such words, once so evocative, can become suddenly empty. What, for example, can we make of Shakespeare’s image of a warbling note? Four centuries have stilled any memory of the living sound of Tudor voices. And even though European culture still preserves an association between florid singing and bird song, we can hardly reconstruct the details of a lost art on the basis of avian performance practice. One trusts, for instance, that Jenny Lind—the nineteenth century’s “Swedish nightingale”—did not really sound like any member of the genus Luscinia. 35
36
The hope that modern audio technology would allow us to replace metaphors with facts has not been realized. Facts we have in abundance. A digital recording now stores the equivalent of a 20-page treatise on each second of music. But what we lack are natural ways of reading these electronic treatises. It is the purpose of this article to suggest directions in which our technical means can be productively channeled toward a better understanding of vocal performance. In particular, I argue that our traditional conceptions of a tone hamper our ability to analyze the fluid shapes and motions that mean so much in fine singing.
The Tone as an Atom of Pitch: A Historical Sketch In the distant past of Western music history, we have almost no clear descriptions of the details of vocal performance. To some extent this is attributable to the difficulties that writers of every era face in putting such information into words that have more than a personal meaning. But perhaps the major obstacles to such description were formed by the scholarly traditions of Western culture itself. Our present concept of sound as wave motion is a relatively recent scientific “paradigm,” to borrow Thomas H. Kuhn’s famous use of the term. It replaced a paradigm of great age and stability, that of sound as impact. As early as the fourth century B.C., Archytas of Tarentum claimed, “Mathematicians have judged that sound is impossible unless there occurs a striking of objects against one another.”l And the mythical story of Pythagoras discovering the simple intervallic ratios by listening to hammers of different weights striking an anvil shows the extent to which the paradigm of impact permeated Greek explanations of music.2 From this early perspective, the discontinuity of a sudden impact was a highly desirable feature. Explanations of continuous phenomena could pose mathematical problems that as yet had no solution. Discontinuous phenomena, on the other hand, could be represented by the whole-number ratios so dear to Hellenic thought. Warbling notes could be reduced to atoms of pitch-single, static points in musical time and space. In late antiquity, Martianus Capella (early fifth century), codifier of the seven liberal arts, summed up this prevailing view of the musical tone and its relation to mathematics: “Indeed, with us the tone has the place of the point in geometry or 1. Quoted in Freeman (1948, p. 78). Tarentum, on the coast of Asia Minor, was also later the home of Aristoxenus, one of the greatest of Greek music theorists. 2. The account most read in the Middle Ages was that given by Anicius Severius Manlius Boethius (early sixth century!l872, 1:10).
37
or the unit in arithmetic.”3 And just as there was no geometry concerned with the interior of a single point, there would be no music theory concerned with the interior of a single tone. Instead, music theory took the pitch atom as its point of departure.4 Medieval scholars went on to crystallize a form of musical notation that suppressed the early curvilinear forms of the St. Gall neumes in favor of a representation approximating the plotting of points in a two-dimensional plane of pitch and time. And polyphony, perhaps the great original achievement of the Medieval musician, was developed and described not as the joint presentation of sinuous lines of melody, but as the concurrence of two or more points of pitch—punctus contra punctum, or “counterpoint.” The conception of a tone as an atom of pitch, its definition as a fixed element in various melodic, harmonic, and durational relationships, and its notation as a point in pitch and time all form a coherent whole within the confines of Western culture. Scholars interested in the fine points of historical performance will always regret the lack of attention paid in earlier times to describing the details of actual sound. But it is clear that the tradition of the musical tone as a static point of pitch made such details seem like the incidental ephemera of the moment and thus unworthy of being recorded for posterity.
Ethnomusicology and the Development of the Seeger Melograph Only when European scholars began to venture beyond their own musical culture did they sense the limitations in their idealized conception of a musical tone. A motivating force behind many of the early forays into non-Western music was the tremendous expansion of colonial empires in the nineteenth century. The music that the British heard in their Hindustan, that the French heard in their Indochina, or the Dutch in their East Indies, could not simply be dismissed as savage or primitive. Here were obviously highly developed musical cultures that appeared to follow different rules. These oriental peoples seemed to have irrational scales, complex rhythms, and tones that refused to sit still like their more upright European counterparts. In those days the methods of anthropology were uncomfortably close to those of zoology or botany. One traveled to distant lands, collected specimens, categorized one’s collection, and then published the results. For musical specimens this 3. “De Sonis. Sonus quippe tanti apud nos loci est, quanti in Geometricis signum; in Arithmeticis singulum. Phthongos Sonos dicimus. Verum phthongus dicitur vocis modulatae particula, una intentione producta” (Capella, book 10). 4. Mary Louise Serafine (1987) has even been questioning the primacy of the single point of pitch within the tradition of Western classical music.
38
this usually involved a transcription into Western musical notation. The task of forcing these exotic sounds into the fixed pitches of Western notation fell to the fledgling discipline of comparative musicology, today known as ethnomusicology. The more sensitive of the early ethnomusicologists were troubled by a feeling that too much was being lost in translation. They sensed that ineffable yet important musical features were defying transcription. Some blamed the problem on limitations in our ability to consciously perceive very fast or small melodic movements. They reasoned that advances in technology could solve the problem by allowing scholars to record and measure what was really going on. Milton Metfessel (1928, p. 13) claimed that “by laying the foundation for definition of what a music is, by defining the terms used in music, [and] by substituting objective statistical methods,” new technologies “will assist in removing the uncertainties and prejudices that have pervaded the study of folk music.”5 The phonograph, the microphone, the oscilloscope, all these wonders offered promise that now one could finally control fleeting time, analyze the minutest variations in pitch, measure the slightest changes in loudness. Others were less enthusiastic. They suspected that the problem had its roots in basic cultural differences. Marius Schneider (1946) suggested that “while primitive man considers movement essential to the form and fluctuating character of phenomena, high civilizations place an emphasis on the static aspect of forms: pure and strictly geometricalline.”6 He no doubt surmised that in attempts to capture the essence of “primitive” musical art, success would come not from having better equipment, but from having a better understanding of the quarry. The remarkable postwar achievements in electronics temporarily tipped the argument in favor of a technological solution. In the 1950s, Charles Seeger, one of the American pioneers of ethnomusicology, oversaw the construction at UCLA of a device for recording the pitch and intensity of a voice or solo instrument. 5. The prejudice to which Metfessel referred was not only of a methodological nature. One can imagine the obstacles that his studies of “American negro songs” faced in the 1920s, especially in the South. For a more technical treatment of the technology of the period, see Obata and Kobayashi (1938). 6. “Mientras el primitive percive como esencial el movimiento en las formas y el caracter fluctuante de los fenomenos, las altas civilizaciones ponen en el primer plano el aspecto estetico de las formas y el perfil puro y estrictamente geometrico de la forma.” The rare first edition of this work has been superseded by the Italian translation (1986). 7. Chapter 2 of Mantle Hood’s The Ethnomusicologist (1982, pp. 50-121), entitled “Transcription and Notation,” provides both a historical treatment of the initial impact of Charles Seeger’s melograph and a discussion of the many problems involved in any type of musical transcription. Seeger’s own views on the subject are presented in Seeger (1951, 1957, 1966). For a more technical treatment of the technology typical of the Seeger melograph, see Tove et al. (1966).
39
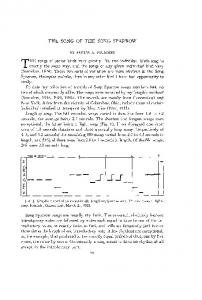
Eventually known as the Seeger melograph,7 this device produced a “melogram,” that is, two traces on a strip of graph paper. The upper trace represented a voice’s fundamental frequency plotted against a time line. The lower trace represented a voice’s fluctuating intensity plotted against the same time line. For example, Figure 1, an illustration of a typical melogram, shows the frequency and intensity traces of a three-second excerpt from a South-Indian song. Later, more elaborate versions of the melograph even included a third component: a representation of a voice’s frequency spectrum plotted, as before, against the same time line. The Seeger melograph was the realization of decades of earlier attempts at the machine transcription of melody. It could detect nuances of pitch or intensity smaller than even the most sensitive listener could perceive. It could produce a permanent record that held promise of revealing all the secrets of the most arcane vocal art. And it could present its information against the backdrop of a carefully calibrated time line, enabling a researcher to measure exact durations. One would have thought that the melograph was an ethnomusicologist’s dream come true. The device seemed to fulfill all of Metfessel’s hopes for objectivity, exactitude, and certainty. And yet in the more than three decades since its birth, the melograph has hardly been used at all. Most ethnomusicology departments do not own one. And it is the rare ethnomusicologist who has ever used one. The Indian scholar Nazir Jairazbhoy (1977) summed up the general view when he noted that “progress [on automatic transcription devices] seems to have come to a halt-not because the final goal has been reached, but because of the enormous complexity of music. The Melograph could only cope with a single melodic line ... [but] even so, it presented a profusion of visual data, involving tolerances much finer than the ear can distinguish, thus creating a new series of problems for the interpreter.”8 Thus the failure of the melograph lay not in its technology but in its lack of practical utility. It did not provide researchers with the kind of information that they could readily
Beyond the Melograph: Shape Human beings are marvelously adept at interpreting symbols. Computers are marvelously adept at interpreting large arrays of numbers. The problem with the typical computerized melograph is that it takes symbols in the form of melody, turns them into large arrays of numbers, presents the numbers as various time-dependent 8. ]airazbhoy (1977) discusses a broad range of issues relating to the shortcomings of automatic transcription devices; his arguments are useful cautions for the too-eager technologist. Similar discussions can be found in List (1974).
40
Fig. 1. A typical melogram, The upper line is a trace of the fundamental frequency, the lower line a trace of the intensity, of a 3-sec excerpt from a South-Indian song.
functions, and then asks humans to interpret these functions. The general solution to this problem requires that the melograph turn its numbers into more easily interpretable symbols before displaying them to humans. Specific solutions will depend on the type of symbols we humans wish the melograph to produce. As a first step in learning to make the melograph more sensitive to human requirements, we need to recognize that human perception is holistic in nature. The mere fact that we can analyze a phenomenon in terms of separate parameters does not mean that it is perceived that way. If we look, for example, at Figure 2, we see separate waves, each consistent as a smooth, continuous Gestalt. Should I now say that these waves represent the parametric coordinates of a single phenomenon, that phenomenon does not automatically spring to mind. Indeed, we may find it rather difficult to reconstruct whatever unitary shape or motion gave rise to these disembodied parameters. On the other hand, had we begun by looking at Figure 3, a rotating circle, and then described Figure 2 as showing the x and y coordinates of a moving point on that circle, everything would have been much clearer. The clarity that a unified context brings to the interpretations of single parameters no doubt accounts for the fact that melograms were usually published above an accompanying standard musical notation. The parametric analysis, supposedly the objective data, was in practice interpreted in terms of the subjective phenomena shown by the musical symbols. As one might imagine, this arrangement ultimately subverted the purpose for which the melograph was built. In Figure 2 there were actually three parameters represented, the third being time. Time is the parameter that correlates all the other parameters shown in a melogram. But is time itself really a straightforward parameter of music
41
Fig. 2. Traces from two hypothetical parameters of a single phenomenon.
Fig. 3. A rotating circle whose successive x coordinates form the lower curve of Figure 2 and whose successive y coordinates form the upper curve of Figure 2.
perception? That is, if we usually perceive time in terms of the passing of events, what then are we to make of time divorced from any particular events? Can we really perceive something as abstract as “125 milliseconds qua milliseconds”? Concerns about parametric analyses, about the meaning of time, and about our cultural prejudice in favor of discrete atoms of pitch have led me to experiment with several alternative forms of the melograph. One of the most successful of these is designed to provide a symbolic, graphic form through which to analyze the sinuous, warbling ornaments of South-Indian smgmg. As with the Seeger melograph, the Gjerdingen melograph (if I may coin so awkward a term) begins with a machine analysis of the separate parameters of vocal pitch and intensity. But whereas this is the end of the process for the Seeger melograph, here it is merely the beginning. To understand what happens next, let us first refer back to the Seeger melograph of Figure 1. Figure 1 shows the pitch and intensity traces of about three seconds of a South-Indian song. In this representation, the x axis shows the progress of time and the y axis shows the rising and falling of either pitch or intensity. In a Gjerdingen melogram, time is not one of the representational axes. Instead, the y axis is reserved for the up-and-down movement of pitch alone; changes in intensity are shown by movements left (softer) or right (louder) on the x axis. In this type of diagram, an idealized pitch atom-a stable pitch at a single intensity-would appear as merely an isolated point (see Figure 4), thus
42
realizing the analogy of Martianus Capella that a tone is like a point in geometry. Such pitch atoms, however, are quite rare in vocal performance, as we shall see below. The performance represented in Figure 1 was given by the South-Indian singer Gayathri Kassebaum at the University of Hawaii in 1980. Mrs. Kassebaum possesses a beautiful voice trained to perform flawlessly the florid vocal art of South India. As is apparent in Figure 1, her voice is in almost constant motion in both pitch and intensity. This movement is so sinuous that its trace in the Seeger melogram nearly conceals the underlying melody. Behind all the curves of Figure 1 lies the simple neighbor-note motion from c’ (at the crest of the first three melodic waves) up to d’ (on the two level segments following the high spike that occurs about a third of the way along the curve) and then back down to c’ (at the crest of the last three melodic waves). The art of this master singer, however, lies not in the simple tune she sings, but in the glorious way she decorates it and makes it spring to life. One of the liveliest moments in this song occurs at the transition from c’ up to d’, where, as mentioned, there is a sharp spike in pitch as well as in intensity. Let us use this ornament to demonstrate the uses of the Gjerdingen melograph. Figure 5 shows the spike from Figure 1 represented as a Gjerdingen melogram. The ornament begins on the last moments of the c’, here in the lower middle of the melogram. Initially the voice moves down and to the left, or in other words, lower in pitch and softer in intensity. Then it turns upward in pitch and rapidly increases in
Fig. 4. A single, static point of pitch represented as a Gjerdingen melogram. In this field of display, the vertical axis represents pitch and the horizontal axis represents intensity.
43
intensity. A sharp reversal of direction brings it back down to the middle of the melogram, and it completes its loop by ending on the tone d’. When viewed on the screen of a computer, a Gjerdingen melogram traces out its shapes in slow motion, enabling one to sense varying rates of change. Here, in printed form, one can still get something of the impression of varying rates of change from the way the dots are spaced. The dots are plotted at a uniform temporal interval of just slightly over three milliseconds. Dark bands of closely packed dots, like those at the beginning and end of the ornament, represent relatively stable points of departure and arrival, while widely spaced dots, like those in the large curve of the ornament itself, exemplify fast movement. By calculating 3 msec to the dot, and counting the 60 or so dots that make up the loop proper in Figure 5, we can arrive at a figure of 180 msec, or less than a fifth of a second, for the duration of this ornament. To get a sense for the enormous speed and control demonstrated by this performance, consider that within a time typical of a single semitone wobble in the vibrato of an opera singer, Mrs. Kassebaum is able to inflect her voice down from c’ toward b, then to soar up a fifth to f#’, and finally to settle smoothly on d’. The above description, with its emphasis on a sequence of fixed pitches, conceals an ethnocentric approach that may hinder our ability to analyze this fluid, non-Western art. As Marius Schneider has suggested, perhaps we need to broaden our concepts to include phenomena that are best understood simply as movement, not as a fixed location. An initial step in that direction is taken in Figure 6, where
Fig. 5. The melodic spike from Figure 1 represented as a Gjerdingen melogram. The arrow indicates where this ornament begins.
44
the Gjerdingen melogram is overlaid with a template reflecting an Indian interpretation of pitch, as explained below. One of the features common to a broad range of the world’s so-called modal musics is that they operate with a strong melodic hierarchy of tones. In particular, there is often a distinction made between stable framework tones-often the outer tones of a central octave as well as the fourth and fifth within that octave-and other, more mobile tones that are clustered around the framework tones. The song sung by Mrs. Kassebaum has g, c’, and d’ as its stable framework tones (the upper octave g’ is closely approached but never quite reached) and the surrounding tones of a b, b, e b’, and f #’ for its more mobile tones. Because a traditional Indian musician does not think in terms of absolute pitch (a’ = 440 Hz, etc.), tones are referred to by their swara names of Indian solfege (a movable-do system: our do, re, mi, fa, sol, la, ti, do equal their sa, re, ga, ma, pa, dha, ni, sa). Thus the ornament in Figure 6 decorates the movement from ma to pa by sweeping through all the other, more mobile tones surrounding these two framework tones. Notice that in Figure 6, the pitch band indicated for pa is narrower than that given for ma. This corresponds to a finer shading in the hierarchy of tones. What we would think of as root and fifth, here sa and pa, are the usual tones for the accompanying drone that is a standard feature of Indian music. Sa and pa are rarely ornamented. On the other hand, ma, even though an important tone, is slightly more mobile and frequently participates in ornaments with tones below it. This generalization can be given empirical support from a slightly different use of the Gjerdingen melograph. That is, one can simply permit a longer section of a song to
Fig. 6. The Gjerdingen melogram of Figure 5 overlaid with a template reflecting an Indian interpretation of pitch.
45
write and overwrite itself in the same field of display so as to create a statistical record of the various fields of pitch/intensity. The stable swaras begin to appear as black bands or clusters, while the more mobile tones remain vague areas of melodic tracery. Figure 7 shows the entire 3 sec first presented in Figure 1. As one can see, pa is restricted to a very narrow range, ma is slightly less constrained, and the other tones remain only vaguely defined. In the older type of melogram, one saw all the twists and turns of pitch and intensity. But as many disappointed scholars found out, one could rarely discern how to interpret them. In this newer type of melogram, as already seen in Figures 5 and 6, the shapes traced by the voice can be almost too suggestive. One is tempted to generalize from the evidence of 100 msec of music. Therefore, only by comparing numerous performances of the same song or type of song can one arrive at a secure notion of the central features that distinguish any particular ornament. Figures 8, 9, and 10 show the ornament of Figure 6 as it was sung by Mrs. Kassebaum during three different performances. In Figure 8 we see essentially the same loop as in Figure 6, but the loop has narrowed and crosses over itself. Figure 9 shows the shape of Figure 6 in a somewhat bulbous form, with the top of the loop slightly higher in pitch than in the two previous figures. The ornament in Figure 10 resembles an enlarged version of Figure 6. What all these performances thus retain is not an absolute contour but a general shape that remains quite consistent. And one aspect of this consistent shape may be somewhat surprising to a Western musician. That is, it seems that at least for this song, pa is generally louder than ma. In other
Fig. 7. The entire excerpt of Figure 1 overwritten on a single Gjerdingen melogram so as to highlight the central ma and pa bands of pitch.
46
words, the individualization of each swara may extend even into the realm of dynamics. The original motivation for recording Gayathri Kassebaum stemmed from my curiosity about the singing of her students. In the early 1980s she taught Indian singing to American students at the University of Hawaii. Her teaching method was traditional. No notation was used, and the students learned by rote imitation of her performances. Yet even though she was an effective teacher, and her students were highly motivated, with several of them studying ethnomusicology, none of them were fully able to imitate the subtleties of her style. I made recordings of two female students who differed both in background and in accomplishment. The first student was a trained singer in various Western styles who had achieved a fair level of proficiency in the Indian singing class. The second student was untrained as a singer in any style and had only achieved modest success in the course. Their performances of the ornament of Figure 6 are shown in Figures 11 and 12. In Figure 11, the first student’s performance, we see several clues to the effects of previous training in Western music. First, she does not automatically increase intensity when she increases pitch. Even though this is a central feature of Mrs. Kassebaum’s style, it would not be stylistic in the singing of, for example, German lieder. Second, nowhere does the student’s voice achieve the velocity of her teacher’s voice. One notices that the dots on the melogram of Figure 11 are never far apart. And third, the student reduces the fluid loop of Mrs. Kassebaum’s ornament to a rectilinear grid of much less mobile pitches. Her voice begins the ornament by making a horizontal decrescendo on the pitch c’. It then shifts vertically to d’,
Fig. 8. A second performance of the ornament from Figure 6.
47
Fig. 9. A third performance of the ornament from Figure 6.
Fig. 10. A fourth performance of the ornament from Figure 6.
moves a little to the left, rises almost straight up to f #’, returns directly back down to d’, and finally makes a smooth horizontal crescendo to end the ornament. It would appear that the student has in some sense translated the ornament into the classical Western tonal system. The second student’s performance, shown in Figure 12, is first of all marred by its failure to get high enough in pitch. The pitch she does reach is somewhere between e n’ and f n’, and thus outside of the song’s normal scale. Second, this student performs the ornament even more slowly than the first student. And third, this beginning-level singer does not have consistent control of her voice. The wobbles
48
Fig. 11. An intermediate-level student’s performance of the ornament from Figure 6.
Fig. 12. A beginning-level student’s performance of the ornament from Figure 6.
in the curve of Figure 12 are apparently random variations, especially in intensity. On the other hand, this student did not have to filter the teacher’s performance through any previous vocal training. She does manage to create the shape of a curving loop and to perform pa louder than ma. In any discussion of the minutiae of vocal performance the question “Can anyone really hear this?” is bound to arise. In the earlier days of the Seeger melograph the question was difficult to answer. As Nazir Jairazbhoy put it (1977), “We may be justified to question the value of the ‘objective’ or external view of the automatic transcriber whose results cannot be verified, since no machine exists which can reconvert the graphs into sound.” Since the original melograph was an
49
analog device producing a photographic or pen trace on a strip of paper, it was indeed difficult to turn the trace back into sound. Today, however, when the melograph is generally a digital computer, a reconversion is less of a problem (although not simple). I have recently performed some preliminary experiments along this line, having a computer “sing” the melograph traces of Mrs. Kassebaum’s performances. No attempt has been made to simulate the original vowel sounds. The artificial performances thus lack a timbral similarity to the originals. Still, when one hears these artificial performances, there is an immediate recognition that “Yes, this is Mrs. Kassebaum’s style.” But at the same time, because of the speed of the ornaments, one cannot easily determine whether the artificial performances are perceptually the same as, or merely similar to, the originals. Much work remains to be done along these lines, work that promises to be very interesting inasmuch as one can not only simulate original performances, but also alter them to test various hypotheses about what is central to their effect.
Beyond the Melograph: Motion Those with experience in transcribing non-Western vocal music into standard musical notation know that deciding on the rhythm of a passage may be just as difficult as, and perhaps more arbitrary than, determining its set of pitches. For just as standard notation asks us to reduce warbling notes to individual points of pitch, so it asks us to reduce more or less continuous motion to a discrete series of points in time. And not only must we reduce motion to a series of abstract points, but we must also ensure that those points are separated by durations interpretable as simple whole-number ratios of each other. Outside of our own culture, this task can be every bit as difficult as it sounds. For a specific example of a problematic rhythm, let us return to the fragment of the South- Indian song first presented in Figure 1. As was mentioned earlier, at the quarter-note level this fragment could be roughly transcribed as the neighbornote motion from c’ up to d’ and back down to c’. But as the many curves on the melogram show us, the melody is far more complex than just three quarter notes. Indeed, the rhythm of Mrs. Kassebaum’s performance is so subtle that I will limit myself to a discussion of just the first third of this excerpt, namely, the part preceding the looping ornament already shown in Figure 6. The pitch trace on the melogram of Figure 1 presents this initial segment as a curving “W” shape. That is, before the explosive leap up from c’ to d’, Mrs. Kassebaum glides into c’ from slightly below it, curves down to b, returns to c’,
50
curves once more down to b, and then ends back on c’. These two excursions from c’ to b and back again are shown in greater detail in the Gjerdingen melograms of Figures 13 and 14. The three upper and two lower peaks of this “W” shape are not equidistant in time. Judging from the melogram of Figure 1, where each dot on the horizontal axis represents about 46 msec, I have made the following gross estimate (in hundredths of a second) of their spacing: c’-26-b-17-c’-17-b-23-c’(-28-d’). Ratios like 26:17 are not of the kind that inspired Pythagoras. Yet the human mind is often willing to overlook the fine points of arithmetic in its search for meaningful relationships. In interviewing Mrs. Kassebaum’s students, I found that for them, the second two durations being equal (or nearly equal) to each other and shorter than the others seems to have been sufficient grounds for conceiving the five notes as a sixteenth, two thirty-seconds, and two sixteenths, as in Figure 15. Mrs. Kassebaum’s performances of this passage, however, refuse to conform to this tidy rationalization of its rhythm. For example, gauging the spacing of the three upper and two lower peaks in a different performance revealed that the greatest similarity was between the first two or last two, not the second two, durations: c’15-b-14-c’-17-b-28-c’(-29-d’). Perhaps because the last duration equals the sum of the first two, and because c’ occurs three times, I am prone to hear this performance more as an eighthnote triplet (see Figure 16). Earlier we discussed how the idealized atom of pitch may not be the best starting point for discussing melodic ornaments, especially in musical cultures with tonal systems differing from our own. In the same light, measuring the distances between isolated points in time may be similarly misguided. After all, how do we know which points to measure? If we have the freedom to establish rhythmic
Fig. 13. The first third of Figure 1 represented as a Gjerdingen melogram (continues on Figure 14).
51
Fig. 14. The first third of Figure 1 represented as a Gjerdingen melogram (continued from Fig.13).
points of reference wherever we like, then we can prove or disprove any hypothesis about a passage’s rhythm. To settle the question of whether or not Mrs. Kassebaum has two different ways of singing the above passage, what is needed is a method of constraining the selection of rhythmic points of reference. A singing voice, especially one as supple as Mrs. Kassebaum’s, is in motion much of the time. It may be changing in pitch, in intensity, in timbre, or in combinations of these features. In the particular passage under discussion, timbre is not a significant factor, since a single vowel (“u”) is sung until the middle of the second quarter-note value. Therefore all sense of motion in this passage is due to changes in pitch and intensity. Understanding these changes may help us to better understand its perceived rhythm. Change per se does not seem to create the phenomena we associate with rhythm. For example, if one turns on an electronic tone generator and slowly, steadily changes the frequency that it produces, no clear beats or pulses are likely to be perceived. The pitch changes, but in changing, it need not give rise to rhythmic events. On the other hand, if one is changing a frequency at a certain rate and then
Fig. 15. The melody of Figures 13 and 14 transcribed according to a binary division of the quarternote time value.
52
Fig. 16. The melody of Figures 13 and 14 transcribed according to a ternary division of the quarternote time value.
either stops, reverses, or accelerates that change, a rhythmic event may well seem to occur. The implication is that while change per se may not be rhythmically important, change in the rate of change usually is. Although we can form a clear idea of the rhythmic import of change in the rate of change for certain large and relatively slow-moving visual phenomena (the course of conductors’ batons, for example), we must resort to a computer for help in analyzing the small and fast movements shown by a melogram. Figure 17 shows the melodic trace of Figure 1 analyzed in terms of the amount of change in its rate of change (as defined by central second-differences-see the technical notes at the end of this article for more detail). Where the pitch is stable, as at point A on Figure 17, there is no change in the rate of change. As a result nothing registers at the corresponding location on the analytical graph (A’). Also, where the pitch is changing uniformly or gradually, as at point B, there is little or no change in the rate of change. Consequently little or nothing registers on the analytical graph (B’). But at a point where a sudden reversal or departure occurs, as at point C, a large spike appears on the analytical graph (C’). The same type of analysis can be performed on the changes in intensity. Figure 18 shows the trace of intensity with the corresponding analysis below it. As with the previous figure, one can see a close correlation between sudden reversals of direction and spikes in the measure of change in the rate of change. Figures 17 and 18 hardly constitute readily interpretable rhythmic analyses. After all, the import of the 22 irregularly spaced spikes in the analysis of Figure 17 and the 27 additional spikes in Figure 18 is far from obvious. Surely we do not perceive 49 separate rhythmic events within these scant 3 sec of monody. Perhaps, as was the case in the earlier discussion of vocal ornaments, we can achieve an intuitively clearer analysis by not trying to keep pitch and intensity separate. That is, perhaps we ought to analyze the change in the rate of change of both pitch and intensity together. A Gjerdingen melogram of the type shown earlier in Figure 6 provides a convenient illustration of simultaneous changes in both pitch and intensity. Every
53
Fig. 17. Upper half: the pitch trace of Figure 1. Lower half: an analysis of the melodic trace in terms of changes in its rate of change (central second-differences). Points A’ and B’ locate areas of little or no change in the rate of change. Point C’ locates a peak of change in the rate of change, a peak corresponding to the sharp reversal in melodic direction at point C.
Fig. 18. Upper half: the intensity trace of Figure 1. Lower half: an analysis of the intensity trace in terms of changes in its rate of change (central second-differences).
Every dot on such a melogram represents a new value in two dimensions. And to compute the change in the rate of change from one dot to the next, we need only invoke a microscopic form of the Gestalt law of good continuation. Specifically, the change in the rate of change for each new point is given by the distance that that point diverges from what would have been expected from the direction of, and the distance between, the previous two points. Where the voice is relatively static, as in the dark, compact bands on such a melogram, change in the rate of change tends to remain very low because each new dot is just about where one would expect it to be, given the previous two dots. On the other hand, the change in the rate of change will become high where, for example in Figure 6, the loop of this soaring ornament suddenly reverses direction.
54
I have formalized the general notions just outlined, written a simple computer program to effect this type of analysis, and applied the analysis to four of Mrs. Kassbaum’s performances. Let us examine them. Figure 19 shows an analysis of the performance already discussed in Figures 17 and 18. Here, instead of the 49 possible rhythmic events in pitch or intensity taken separately, there are only 7 main events in the two dimensions taken together. The most sharply defined of these events, represented by large spikes with steeply sloping sides, define the more obvious phenomena. For example, the third and highest spike of the analysis corresponds to the looping ornament presented in Figure 6. In that earlier figure, ma and pa-our notes c’ and d’ -stood out as dark bands or clusters separated by the moving tracery of the ornament. If one transfers this notion to the interpretation of Figure 19, then the latter part of one stable note and the beginning of the next ought to be separated by a spike of microrhythmic activity. For the ornament of Figure 6, this is quite evident. Points M and N on Figure 19 indicate the minima of change in the rate of change on either side of the third peak. These points correlate well with the end of c’ and the beginning of d’. Moreover, this correlation is clearly maintained in the three other performances (Figures 20, 21, and 22). If one can locate the perceived beginning of a note by reference to a sharp descent from a peak in the change of the rate of change, and if the melodic passage in question is part of a metrically organized song, then such sharp descents ought to appear at regularly recurring intervals. Taking Figure 20 as an example, one notices that the two largest and most obvious such descents occur near the center of the figure. On Figure 23, a copy of Figure 20, let us draw an arbitrary line A-B across the analytical graph, label its intersection with these descents as points 0 and P,
Fig. 19. Upper half: the pitch trace of Figure 1 (for reference). Lower half: an analysis of the changes in the rate of change for both pitch and intensity taken together (central seconddifferences in two dimensions). Points M and N are local minima in the metric of “change in the rate of change.”
55
Fig. 20. A second performance analyzed as in Figure 19.
Fig. 21. A third performance analyzed as in Figure 19.
and use the arc O-P as a unit of duration. At a distance one unit of duration to the left of point 0 there is no intersection with a sharp descent. To the right of point P, however, there are two such intersections at points Q and R. The three resulting arcs O-P, PQ, and Q-R correspond to eighthnote durations. Quarter-note durations would, of course, be arcs of length O-Q. Plotting an arc of length O-Q to the left of point 0, a new intersection appears at point S, which is the downbeat of this passage. And had the me10gram been extended to the next rhythmic event, a third arc of length O-Q could have been drawn to the right of point Q, representing the third of this passage’s three quarter-note values. The basic pattern of quarter-note and eighth-note values represented by the arcs drawn on Figure 23 is easily perceived during any of Mrs. Kassebaum’s performances. Almost all of her students internalized it and reproduced it,
56
Fig. 22. A fourth performance analyzed as in Figure 19.
Fig. 23. Various arcs identify temporally equidistant pulses on the motion analysis of Figure 20.
with greater or lesser precision, in their own performances. What seems to have been more difficult to learn was, as discussed earlier, the rhythmic detail of the first quarter-note value. Figure 24 presents side-byside comparisons of this section from the performances of Figures 19 through 22. Between the outer peaks that define the beginning and end of this quarter-note duration, the second and third analytical graphs (Figures 24b and c) show two distinct inner peaks. Lines drawn from their steep descents to the melodic traces above show that the descents coincide with returns to ma, or c’. These are the performances that I mentioned hearing as eighthnote triplets, although the three arcs drawn on both analytical graphs show that the second of the triplets arrives slightly late. Or put a different way, of the triplet’s three durations, the first is a little long in the second performance and quite long in the third.
57
Fig. 24. A comparison of the first quarter-note time values from the performances of Figures 19, 20, 21, and 22.
The first and fourth analytical graphs (Figures 24a and d) have a more ambiguous shape, with either one large inner peak or many small ones. One cannot be sure where to define a steep descent. In Figure 24a, if one chose two descents near the one-third and two-thirds points, ascending lines from those points would intersect the two troughs of ga (b). In Figure 24d, a descent near the halfway point would also coincide with ga (b). Only the fourth of the above performances seems to support a simple binary division of the first quarter-note value. Yet because almost all of this song’s other quarter notes are bisected by eighth notes, and because Mrs. Kassebaum does seem to give subtly differing performances of this beat, some students seemed quite willing to interpret it in favor of a binary subdivision. The student with previous training as a Western singer, mentioned earlier with regard to Figure 11, seems to have modeled her performance very carefully on that of the fourth example discussed above. The analytical graph of this student’s version, Figure 25, shows a single major peak
58
Fig. 25. The intermediate-level student’s performance analyzed as in Figure 19.
with a steep descent at the midpoint of the first quarter-note value. The reader who makes a careful comparison of the student’s graph of pitch with those of her teacher will notice several details that are missing. Nevertheless, the student did a good job of reproducing the underlying rhythm of at least one of Mrs. Kassebaum’s performances. Subjectively, in listening to a recording of this student, one senses that her singing style is less dynamically alive, slightly less energetic than that of her teacher. Two visual features of Figure 25 convey some sense of this difference. First, excepting three narrow spikes (located at the points where syllables change), the student’s analytical graph never extends as high as do the graphs of her teacher. There is simply less average change in the rate of change in the student’s performance. And second, whereas the analytical graphs of the teacher have a bristly appearance, that of the student is a little more continuous, a little more rounded. The student has, in effect, filtered out the most rapid movements of her teacher’s style of singing. The novice student, mentioned earlier with regard to Figure 12, had great difficulty with this passage. As the graph of her change in the rate of change testifies in Figure 26, she fails to establish clear beats. In fact, the visual appearance of the graph does not favor any obvious grouping of peaks or troughs. As an expedient in interpreting her graph, I have slightly extended the melogram to include the following downbeat. This extension allows one to trisect the graph to find the approximate locations of the main three quarter-note beats. At each third of the graph, there is indeed an intersection with a steep descent in the change of the rate of change. But these descents are from relatively insignificant peaks. If one either did not know this song or had been given only this passage divorced from any clearer rhythmic context, there is little evidence that one would perceive three quarter
59
Fig. 26. The beginning-level student’s performance analyzed as in Figure 19.
note beats. The graph would not refute such an interpretation, but neither would it give it much support.
What Is a Note? Up to this point I have avoided transcribing Mrs. Kassebaum’s performance into Western notation for fear of prejudicing the reader’s consideration of it. Now, however, the graphs of change in the rate of change and the several comparisons we have made of different performances provide a good foundation for making such a transcription. Taking the graph’s major peaks as the cues to where the important notes are, and using Gjerdingen melograms to analyze the surrounding ornaments, I have arrived at the transcription in Figure 27. The iterations of ma (c’) that begin
Fig. 27. The motion analysis of Figure 20 is used to identify the notes for a transcription of the excerpt into standard musical notation.
60
this excerpt have not been deemed notes of the same importance as the ma on the downbeat. Why? An answer could be narrowly based on the argument that the corresponding peaks on the analytical graphs have inferior status as invariant features. But a broader answer requires a consideration of the SouthIndian style of singing and the general beliefs of Indian musical culture. A broader answer in fact requires some thought about what is meant when someone refers to a “note.” Figure 27 presents an excerpt from a folk song of the Kannada region of South India, a song in praise of the god Rama. The word sung in this passage, “pujintsu,”means “in pleasant attitude,” referring to the emotional state of the worshipers. I mention this to observe that in its own context, this passage has cultural meaning. When we move from the analysis of curves, functions, and rates of change to a discussion of notes or particular rhythms, we are moving toward the consideration of cultural units of meaning, not simply pitches and intensities. Sensitivity is required when different cultures have differing ideas about the nature of such units. For the ordinary listener to popular music, “note” is not always a sharply defined concept. It may suggest something as vague as a sung syllable, possibly including several pitches. For a classically trained Western musician, on the other hand, the meaning of “note” can be restricted to a single, discrete tone, or further restricted to the notational symbol for such a tone. Indian musicians favor the first, broader interpretation. As Baburao Joshi (1963, p. 13) writes: Above all the note must have Rasa, that is, the capacity to delight or please. The concept of Swara is something more than what is conveyed ordinarily by the term note. Etymologically the word Swara means “self-illuminating” or “self-shining.” In other words, it can be said that the note must have “life” in it so as to become Swara . It is this lively element in the Swara which gives you the delight (Ananda)—technically called the Rasa. A single point of pitch may, in certain instances, have the “capacity to please or delight.” Yet I doubt whether a static tone could ever be said to “have life in it.” Life is animate and the “lively element” in the Indian conception of a note seems to be realized through animated movement. What may be several tones to a Western transcriber may be a single note to an Indian performer. Interestingly enough, I have found that the reverse may also be true. In an experiment once performed with musicians from different ethnic groups, I first asked each musician to look at a fragment of a simple melody, the four quarter notes
61
Fig. 28. Mrs. Kassebaum’s performance of the notated melody a-g-f-g. She begins on a, moves to g, and then makes a double loop below g.
a, g, f, and g. The notes shown to them were equally spaced and notated on a treble staff with no time signature given. I then asked each musician to imagine such a succession of pitches in a song from their own culture and to sing the passage that they envisioned or remembered in their native singing style. Mrs. Kassebaum was one of the musicians that agreed to participate. In considering the four notes, she apparently saw the sequence g-f-g as suggesting a type of neighbor-note pattern. But the Indian neighbor-note pattern that she sang returns to g twice, not just once as notated. As the Gjerdingen melogram of Figure 28 indicates, she made a double loop down from g. This double lower-neighbor-note pattern is the same pattern Mrs. Kassebaum sang for the first beat of Figure 27. It seems to be a set ornament and a stable unit of her melodic style. As such, it is best described—and transcribed—as a single warbling note.
Comments I believe that the more symbolic representations of the Gjerdingen melograph, the use of graphic overlays to display aspects of a particular culture’s tonal system, and the analysis of multidimensional changes in the rate of change are all significant improvements to the Seeger melograph. They not only make the small shapes and motions of vocal performance more readily apparent,but they also suggest 9. It is interesting to observe that some speech-recognition programs also first represent speech in terms of combined pitch/intensity traces, and then use pattern-recognition programs to interpret the traces. See, for example, Dusek, Schalk, and McMahan (1983).
62
different ways of conceptualizing the microstructure of song. The ability to compare performances solely on the basis of their motion qua motion, for example, makes it possible to move beyond simple discussions of points of pitch or time. Composers and performers have always known that qualities of motion are vitally important to music. The late American composer Roger Sessions (1950, p. 19) went so far as to ask, “May we not say that the basic ingredient of music is not so much sound as movement. . . , movement of a specifically human type that goes to the roots of our being and takes shape in the gestures which embody our deepest and most intimate responses.” If we conceive of movement as a primary phenomenon, then notes and rhythms become secondary phenomena. For rhythms, steep descents and possibly ascents in “change in the rate of change” may provide the featural cues for the cognitive interpretation of pulses, accents, and low-level groupings. And “notes,” rather than being objective points in pitch or time, must then be viewed as perceptual, cognitive, and cultural entities that emerge from the complex interactions of (1) multidimensional changes in rates of change, (2) internalized tonal schemata, (3) metric schemata, and (4) knowledge of a repertory of vocal ornaments or other special effects. One hesitates to admit to colleagues in other disciplines that a music theorist might have questions about the definition of a note, but my studies of vocal performance suggest that the matter is not at all trivial. As was so often the case in the development of the microscope, and later the electron microscope, each closer view of familiar phenomena makes them seem more, not less, strange and mysterious.10 Technical Notes The melograph traces shown in the various figures are logarithmic plottings of vocal frequency and amplitude. Both frequency and amplitude are derived from audio tape recordings filtered to exclude frequencies above 2250 Hz, sampled at 20833 Hz by an analog-todigital converter (MacADIOS Model 411), and evaluated by programs written by this author to run on a Macintosh 512E microcomputer. Each point of amplitude is defined as a weighted local average of the root-mean-square values of overlapping 256-sample segments of the wave being evaluated. The Gjerdingen melograms appearing in this article exhibit a dynamic range of about 13 dB across their horizontal axis. Each point of frequency is defined as a weighted local average of values determined by an algorithm that calculates frequency based on considerations of enhanced peak-to-peak distances 10. A preliminary version of the research presented here was completed in 1980 at the Department of Music, University of Hawaii and reported in an unpublished Master’s Thesis (1980) by this author. Special thanks are due Professors David Slepian of Bell Labs, Alan Trubitt of the University of Hawaii, and Gerard Fryer of Princeton University for their help. And of course this research could not have been undertaken without the generous cooperation of Gayathri Kassebaum and her class.
63
within overlapping 256-sample segments of the wave being evaluated. The Gjerdingen melograms appearing in this article exhibit a frequency range of about 200 Hz across their vertical axis. To calculate “change in the rate of change,” we assume that in principle the intensity I and pitch P of a musical utterance are given as continuous twice differentiable function of the time t, say, I = f(t) and P = g(t). If f(t) and g(t) are regarded as the x and y coordinates respectively of a moving particle, then the x and y components of its acceleration are d2f
and
dt2
d2g dt2
and the magnitude of the acceleration is A(t) =
√(
d2f dt2
)( ) 2
+
d2g
2
dt2
.
(1)
From the melograph we can measure f(t) and g(t) only at a discrete set of times, say 0, T, 2T, 3T, . . . where T is the sampling period (about 3 msec for the data shown above). The second derivatives in (1) must accordingly be approximated by central second differences. Let Ii ≡ f(t), Pi ≡ g(t) with i = 0, 1, .... Then as our approximation to A(ti) as given by (1) we write A(ti)≈Ai≡
√ (I +1-2I +I -1)2 + (P +1-2P +I -1) i
i
i
i
i
i
2
(2)
where i = 1,2,3, .... Here k is a suitable scale factor chosen for convenience in presenting the accelerations graphically. To filter out quantization errors and other noise, the values Ai of (2) are replaced by the means of three sparser Ai with sampling periods of 6i-1, 6i, and 6i + 1. The final graphs of acceleration or “change in the rate of change” are weighted local averages of these means plotted on a logarithmic scale.
References Boethius, A. S. M. De Institutione musica [Ger. trans. by Oscar Paul in Boethius und die Griechische Harmonik (Leipzig: 1872), pp. 15-16]. Capella, Martianus. De nuptiis philologiae et Mercurii. Dusek, L., Schalk, T. B., & McMahan, M. Voice recognition joins speech on programmable board. Electronics, April 21, 1983, 56 (8),18-132. Freeman, K. Ancilla to the pre-Socratic philosophers. Oxford: Blackwell, 1948. Hood, M. The ethnomusicologist (2d ed.). Kent, OH: Kent State University Press, 1982. Jairazbhoy, N. The “objective” and subjective view in music transcription. Ethnomusicology, 1977, 21, 263-274. Joshi, B. Understanding Indian music. Bombay: Asia Publishing House, 1963. List, G. The reliability of transcription. Ethnomusicology, 1974, 18, 353-378. Metfessel, M. F. Phonophotography in folk music: American negro songs in new notation (with an introduction by C. E. Seashore). Chapel Hill, NC: The University of North Carolina Press,
64
1928. Obata, J., & Kobayashi, R. An apparatus for direct-recording the pitch and intensity of sound. Journal of the Acoustical Society of America, 1938, 10, 147–149. Schneider, M. El origen musical de los animales-simbolos. Madrid: 1946 [Ital. trans. by Gaetano Chiappini in Gli animali simbolici (Milan: Rusconi, 1986), p. 8]. Seeger, C. An instantaneous music notator. Journal of the International Folk Music Council, 1951, 3, 103-107. Seeger, C. Toward a universal sound-writing for musicology. Journal of the International Folk Music Council, 1957, 9, 63-66. Seeger, C. Versions and variants of the tunes of “Barbra Allen.” Selected Reports: Institute of Ethnomusicology, UCLA, 1966, 1, 120-163. Serafine, M. L. Music as cognition: The development of thought in sound. New York: Columbia University Press, 1987. Sessions, R. The musical experience of composer, performer, listener. Princeton, NJ: Princeton University Press, 1950. Tove, P. A., Norman, B., Isaakson, L., & Czekajewski, T. Direct-recording frequency and amplitude meter for analysis of musical and other sonic waveforms. Journal of the Acoustical Society of America, 1966, 39, 362–371.