Short Technical Reports Validating a custom multiplex ELISA against individual commercial immunoassays using clinical samples Michael Liew1, Matthew C. Groll2, James E. Thompson2, Sara L. Call2, Joann E. Moser2, Justin D. Hoopes2, Karl Voelkerding1,3, Carl Wittwer1,3, and Rex S. Spendlove2 1ARUP
and
Laboratories, Salt Lake City, 2Spendlove Research Foundation, Logan, of Utah School of Medicine, Salt Lake City, UT, USA
3University
BioTechniques 42:327-333 (March 2007) doi 10.2144/000112332
The measurement of multiple antigens in a single sample poses clinical and methodological challenges. Here we describe the validation of a multiplexed sandwich enzyme-linked immunosorbent assay (ELISA) array (microELISA) of nine antigens. The antigens tested simultaneously were: α-fetoprotein (AFP), prostate specific antigen (PSA), carcinoembryonic antigen (CEA), cancer antigen 125 (CA 125), CA 15-3, CA 19-9, β-human chorionic gonadotropin (β-hCG), luteinizing hormone (LH), and follicle stimulating hormone (FSH). At least 44 clinical samples were tested for each antigen. microELISA results for the nine antigens were then compared with clinical laboratory results obtained for the same antigens in individual chemiluminescent immunoassays. The microELISA had a coefficient of variation (CV) of 7.3% within an assay and 12.6% for assays run at different times. A statistical comparison of results from the microELISA with results from the clinical laboratory showed that the assays had correlation coefficients ranging from 0.99 to 0.76, and Deming regression demonstrated that four of the nine assays were high-quality assays and not statistically different to the individual assays. To determine if the differences in the assays were due to methodology, the microELISA was also compared with conventional ELISAs using identical antibodies and reagents. Deming regression demonstrated that five of the eight assays were high-quality, indicating that a poor correlation between a microELISA and an individual immunoassay are partly due to antibody differences.
INTRODUCTION Identifying multiple proteins in a single sample has advantages. In cancer diagnostics, specificity can be improved with more than one marker (1,2). For example, cancer antigen 125 (CA 125) is elevated in different types of cancer such as endometrial cancer (3), renal cell carcinoma (4), and ovarian cancer (5). In addition, if different diseases have overlapping clinical symptoms, the qualitative and quantitative assessment of multiple antigens may provide diagnosis. So, it has been reported that the same CA 125 antigen is also elevated in noncancerous conditions, such as endometriosis (6), mitral valve stenosis (7), and hypothyroidism (8,9). Therefore, if other markers can be identified to categorize the diseases, the potential benefits of measuring multiple antigens Vol. 42 ı No. 3 ı 2007
simultaneously from the same sample are obvious. Currently, technology is available for measuring multiple antigens, but the clinical interpretation is not available. There are a variety of different methods available for identifying multiple antigens in the same sample simultaneously. The most common method for measuring multiple antigens from a complex mixture of proteins has been by two-dimensional gel electrophoresis (2-DE) (10,11), sometimes followed by identification by tandem mass spectrometry. Also available are protein arrays that require antibodies of known specificity and affinity (10,12) that are immobilized on a surface. Time-of-flight mass spectrometer techniques like matrix-assisted laser desorption/ionization (MALDI) and surface-enhanced laser desorption/ ionization (SELDI) have also been
used for identifying multiple antigens in complex mixtures (13,14). Many methods allow parallel protein identification, but measurement of their concentrations is an important indicator used in both life science research and clinical practice (15). Arrays of antibodies for simultaneous antigen quantification are considered the most accurate (10,12). Enzyme-linked immunosorbent assay (ELISA) microarrays were first reported as printed arrays on glass (16). These arrays had 144 spots each that corresponded to the location of a well in a microtiter plate. A 16-spot array printed onto nitrocellulose attached to a microscope slide has also been reported (17). Microarrays can now be printed directly onto the bottom of a 96-well plate and have been used by different investigators and companies (15,18). For example, SearchLight™ arrays (Pierce Biotechnology, Rockford, IL, USA) have up to 16 assays per well in a sandwich format similar to our multiplexed sandwich ELISA array (microELISA) (15). When multicytokine assays based upon microELISA technology (SearchLight and FAST® Quant systems; Whatman Schleicher & Schuell, Keene, NH, USA) were compared with a bead-based array (Beadlyte® Luminex human multicytokine detection system; Upstate, Charlottesville, VA, USA) (19), each assay system had its own merits. For example, the FAST Quant assay tested had the broadest dynamic range and lowest sample volume requirements compared with the other assays, and the SearchLight assay had the best reported detection limits. A rigorous comparison of microELISAs to identical assays performed as individual conventional ELISAs has not been performed. Our microELISA uses up to 25 antibodies bound to the bottom of a microtiter plate well in an array format. The microELISA was compared with routine clinical testing and identical conventional ELISAs using six tumor markers [α-fetoprotein (AFP), prostate specific antigen (PSA), carcinoembryonic antigen (CEA), CA 125, CA 15-3, and CA 19-9] and three hormones [β-human chorionic gonadotropin (β-hCG), luteinizing hormone (LH), and follicle stimulating hormone (FSH)]. www.biotechniques.com ı BioTechniques ı 327
Short Technical Reports MATERIALS AND METHODS Samples
Chemiluminescent substrate
All samples were de-identified according to a global Associated Regional and University Pathologists (ARUP) Laboratories protocol under International Review Board (IRB) no. 7275. The samples used in this study had been submitted to ARUP for the quantification of AFP, total PSA, CEA, CA 125, CA 15-3, CA 19-9, β-hCG, LH, or FSH antigen levels. AFP, total PSA, CA 15-3, and CA 125 were measured on the Modular E170 analyzer (Roche Diagnostics, Indianapolis, IN, USA). CEA, CA 199, and β-hCG were measured on the Immulite® 2000 (Diagnostic Products Corporation, Los Angeles, CA, USA). LH and FSH were measured on the ADVIA Centaur ® Immunoassay system (Bayer Healthcare, Tarrytown, NY, USA). Samples were either human serum or plasma (heparin or EDTA). Three hundred and sixty-four samples were tested by ARUP for one or two
HRP
AFP
CA 125
h β-HCG
PSA
CA 15-3
LH
CEA
CA 19-9
FSH
Detection Antibody
Measured antigen
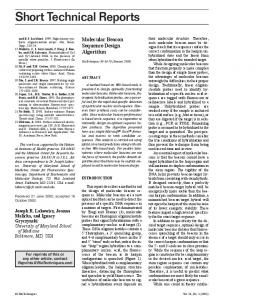
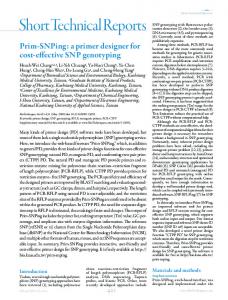
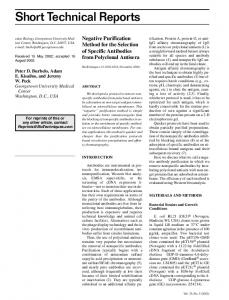
Figure 1. Representation of the multiplexed sandwich enzyme-linked immunosorbent assay (ELISA) array (microELISA) format and method. Nine antibodies specific for different antigens were spotted onto the bottom of a single well of a 96-well microtiter tray for simultaneous detection by a microELISA. AFP, α-fetoprotein; PSA, prostate specific antigen; CEA, carcinoembryonic antigen; CA 125, cancer antigen 125; CA 15-3, cancer antigen 15-3; CA 19-9, cancer antigen 19-9; β-hCG, β-human chorionic gonadotropin; LH, luteinizing hormone; FSH, follicle stimulating hormone; HRP, horseradish peroxidase.
of the nine antigens. The only antigens that were measured on the same sample were LH and FSH; all other antigens were measured separately on different samples. Forty-four samples were tested for both FSH and LH, with three of those having LH results below the detection limit of the assay. Forty-six samples were tested for CA 125, 61 samples for CA 19-9, 19 samples for β-
Antigen
Supplier
Catalog No.
Concentration (μg/mL)
AFP Total PSA CEA
OEM Concepts Fitzgerald Fitzgerald
M2-M01 10-P20 10-C10
50 100 40
CA 125
BioDesign
M37197M
100
CA 15-3
BioDesign
M37552M
160
CA 19-9
BiosPacific
A46151130P
100
β-hCG
Fitzgerald
10-C25
50
LH
OEM Concepts
M2-F07
100
FSH
OEM Concepts
M2-F02
100
AFP Total PSA CEA
Fitzgerald BiosPacific OEM Concepts
10-A05 A45100151P M2-M02
200 8 1.6
CA 125
BioDesign
M86306M
0.6
CA 15-3
BioDesign
M37901M
40
CA 19-9
Fitzgerald
10-C04
8.6
β-hCG
Fitzgerald
10-C25
4
LH
OEM Concepts
M2-F07
26.5
FSH
OEM Concepts
M2-F02
1.2
microELISA, multiplexed sandwich enzyme-linked immunosorbent assay (ELISA) array; AFP, α-fetoprotein; PSA, prostate specific antigen; CEA, carcinoembryonic antigen; CA 125, cancer antigen 125; CA 15-3, cancer antigen 15-3; CA 19-9, cancer antigen 19-9; β-hCG, β-human chorionic gonadotropin; LH, luteinizing hormone; FSH, follicle stimulating hormone.
328 ı BioTechniques ı www.biotechniques.com
hυ
Capture antibody
Table 1. Supplier and Concentration of Each Antibody Used in the microELISA
Capture Antibody
Secondary antibody
hCG, 55 samples for CEA, 37 samples for CA 15-3, 50 samples for PSA, and 52 samples for AFP. Upon completion of testing, the samples were stored at -80°C until transfer to the Spendlove Research Foundation (Logan, UT, USA) where the microELISA analysis was performed. microELISA Analysis Following testing at ARUP, the samples were shipped overnight in dry ice, stored at -20°C, and used within 1 year. Samples were never subjected to more than three freeze-thaw cycles. The nine microELISA assays were developed using commercially available antibodies that were diluted in phosphate-buffered saline (PBS), pH 7.4, and used at the concentrations given in Table 1. Antibodies and standardized antigens used in the microELISA were different than those used in the commercially available assays. Nine 50-nL spots of capture antibody were arranged in a 3 × 3 grid in each well of a 96-well plate (Greiner Bio-One, Monroe, NC, USA) (Figure 1) at 80% relative humidity using a PixSys™ Cartesian Dispensing system (Cartesian Technologies, Irvine, CA, USA). The plates were incubated for 4 h at 37°C (80% relative humidity) and then blocked in 100 μL/well Super AAA buffer (ScyTek, Logan, UT, USA) for 10 min at 20°C with shaking on an orbital shaker. All incubations to follow were performed similarly with shaking. After removal of the blocking solution, 30 μL sample or a 6-point standard curve (Lyphochek® Tumor Marker Control; Vol. 42 ı No. 3 ı 2007
Short Technical Reports
that antibodies were coated at a concentration of 2 μg/mL in PBS, pH 7.4, and the substrate incubation times ranged from 1 min to 1 h.
Table 2. Range and Sensitivity Specifications for the Nine Antigens Measured Clinical Assay Antigen
Range
microELISA
Sensitivity
Range
Sensitivity
AFP
0.6–1200 ng/mL
0.6 ng/mL
0.53–1300 ng/mL
0.53 ng/mL
Total PSA
0.01–100 ng/mL
0.003 ng/mL
1–48 ng/mL
0.04 ng/mL
CEA
0.2–560 ng/mL
0.2 ng/mL
0.02–510 ng/mL
0.02 ng/mL
CA 125
0.6–5000 U/mL
0.6 U/mL
0.88–5300 U/mL
0.88 U/mL
CA 15-3
1–300 U/mL
1 U/mL
0.28–310 U/mL
0.28 U/mL
CA 19-9
3–1000 U/mL
1 U/mL
0.07–240 U/mL
0.07 U/mL
β-hCG
1.1–5000 mIU/mL
0.6 mIU/mL
0.11–6300 mIU/mL
0.11 mIU/mL
LH
0.1–200 mIU/mL
0.1 mIU/mL
0.16–50 ng/mL
0.16 ng/mL
FSH
0.3–200 mIU/mL
0.3 mIU/mL
0.24–50 ng/mL
0.24 ng/mL
Precision Studies and Statistical Analysis The array was tested for reproducibility over the course of 30 days by the same technician using different lots of reagents and plates. Twentyfour different 96-well plates were run with serum samples in triplicate, and the calibration curve in duplicate. Interassay precision was determined as the coefficient of variation (cv) of test samples at different dilutions over a period of 30 days (n = 24). Intra-assay precision was calculated by determining the cv over 96 different wells on the same plate. The test samples were diluted to be within the dynamic range of the assay calibration curve. Testing ranges were determined by regression statistics obtained from a comparison of methods study used to calculate the reference limits of a new method (21). The lower limits of detection (LLD) for each assay were calculated by adding the mean of the blank to two times the standard deviation of the blank.
microELISA, multiplexed sandwich enzyme-linked immunosorbent assay (ELISA) array; AFP, α-fetoprotein; PSA, prostate specific antigen; CEA, carcinoembryonic antigen; CA 125, cancer antigen 125; CA 15-3, cancer antigen 15-3; CA 19-9, cancer antigen 19-9; β-hCG, β-human chorionic gonadotropin; LH, luteinizing hormone; FSH, follicle stimulating hormone; mIU, million international units.
Conventional ELISAs The same antibodies used in the microELISA format were also tested in a conventional ELISA format. This was to determine if there was any difference in results between the microELISA 330 ı BioTechniques ı www.biotechniques.com
format and ELISAs that had been set up under conventional conditions. Eight different conventional ELISAs were performed. Each conventional ELISA had a separate random sample set ranging from 50 to 96 samples. The microELISA assays were performed at the same time as the conventional ELISAs on the same sample set to ensure similar reaction conditions. The conventional ELISA was performed identically to the microELISA except A
Pixel Intensity (×103)
Pixel Intensity (×103)
50
AFP
24
25
0 0
250
B
60
500
0
50
Total PSA
0
300
C
600
CEA
8
0
E
400
800
0 30
Clinical Platform
60
0 0
0 0
120
H
16
CA 15-3
240
LH
8
120
F
240
0 0 16
CA 19-9
10
0
β-hCG
18
0 0 20
G
36
CA 125
25
30
0
D
12
16
Pixel Intensity (×103)
Bio-Rad Laboratories, Hercules, CA, USA) diluted 1:10 in PBS, pH 7.4, containing 1% (w/v) bovine serum albumin (BSA) were added to the appropriate wells for 60 min at 20°C. Then the plates were washed three times in an Elx405™ microplate washer (BioTek Instruments, Winooski, VT, USA) with Tris-buffered saline (TBS), pH 7.4, containing Tween® 20 (ScyTek). Bound antigen was detected by adding 30 μL mixture of detection antibodies conjugated to horseradish peroxidase (HRP) (20) to the plate for 15 min at 20°C. Plates were washed three times as before, and 40 μL SuperSignal® ELISA Fempto Chemiluminescent Substrate (Pierce Biotechnology) were added to produce a chemiluminescent response. The plate was imaged for 4 min using a Fluorchem® 8900 chargecoupled device (CCD; Alpha Innotech, San Leandro, CA, USA) with custom software. The software calculated the pixel intensity for each spot. Values were output to a spreadsheet for calculation of marker concentration using linear regression of the calibration curve. Each sample was tested in triplicate, and the average compared with standard curves to determine concentrations.
22
I
44
FSH
8
60
Clinical Platform
120
0
0
60
120
Clinical Platform
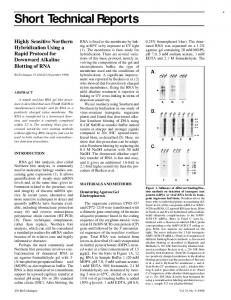
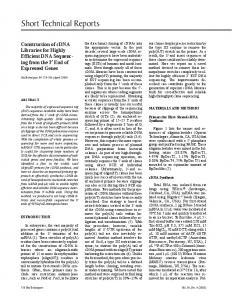
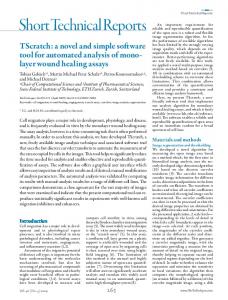
Figure 2. Standard curves for the nine antigens tested simultaneously in the multiplexed sandwich enzyme-linked immunosorbent assay (ELISA) array (microELISA). Each antigen is represented on a separate graph (A–I). The arrows indicate the lower limit of detection of each assay. AFP, α-fetoprotein; PSA, prostate specific antigen; CEA, carcinoembryonic antigen; CA 125, cancer antigen 125; CA 15-3, cancer antigen 15-3; CA 19-9, cancer antigen 19-9; β-hCG, β-human chorionic gonadotropin; LH, luteinizing hormone; FSH, follicle stimulating hormone. Vol. 42 ı No. 3 ı 2007
Short Technical Reports
RESULTS AND DISCUSSION Nine different ELISAs were developed and multiplexed in array format in each well of a 96-well plate. The antigens AFP, PSA, CEA, CA 125, CA 15-3, CA 19-9, β-hCG, LH, and FSH were analyzed simultaneously. Cross-reactivity tests of nearly 14,000 points were performed by using each capture antibody with all potential combinations of antigen and detection antibodies to ensure minimal crossreactivity with nonspecific factors (data not shown). The only cross-reactivity detected was using the antibody for CA 19-9, which detects Sial Lewis A carbohydrate moieties. However, assaying these samples with and without the CA 19-9 antibody did not affect the values for the microELISA.
A
microELISA
5.0
0
5.0
2.5
B
0 0 2.0
Total PSA
0.5
2.0
E
0.5
C
2.0
CEA
0 0 6.0
2.0
1.0
F
2.0
5.0
0 0
LH
2.5
-1.0 -1.0 2.0
I
6.0
3.0
Clinical Platform
Clinical Platform
5.0
0.5
2.0
FSH
0
0
1.0
2.0
Clinical Platform
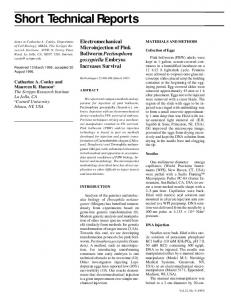
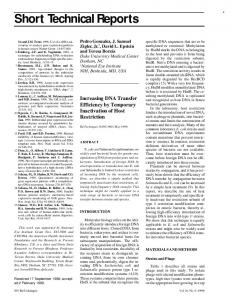
Figure 3. Regression plots of the results from each of the nine antigens measured on the multiplexed sandwich enzyme-linked immunosorbent assay (ELISA) array (microELISA) versus the corresponding results obtained from the individual clinical assays. Each antigen is shown on a separate graph (A–I). Each point represents a sample. The black line is the Deming regression and the gray dotted line represents a theoretical line with a slope of 1.0 and a y-intercept of 0. The logarithm of each result has been plotted. Units correspond to those of Table 2. AFP, α-fetoprotein; PSA, prostate specific antigen; CEA, carcinoembryonic antigen; CA 125, cancer antigen 125; CA 15-3, cancer antigen 15-3; CA 19-9, cancer antigen 19-9; β-hCG, β-human chorionic gonadotropin; LH, luteinizing hormone; FSH, follicle stimulating hormone.
The overall cv over 30 days was 12.63% with intra-assay variation contributing 7.26%. R2 values were calculated for the standard curves of each antigen. Six-point standard curves, five serial dilutions of one to two, and a negative control were used, with the exception of PSA,
95% CI
Intercept
95% CI
SEM
R2
n
1.02
0.97 to 1.07
-0.01
-0.11 to 0.1
0.18
0.99
52
Total PSA
0.83
0.76 to 0.89
0.2
0.14 to 0.26
0.16
0.96
50
CEA
0.87
0.82 to 0.92
0.27
0.19 to 0.35
0.22
0.98
55
1.02
0.96 to 1.09
-0.12
-0.24 to 0.01
0.14
0.98
46
CA 15-3a
0.97
0.83 to 1.12
0.09
-0.18 to 0.37
0.23
0.9
37
19-9a
0.97
0.92 to 1.02
0.17
-0.01 to 0.34
0.24
0.98
61
β-hCG
1.07
1.02 to 1.13
-0.25
-0.43 to -0.06
0.15
0.99
19
LH
1.17
0.98 to 1.35
-0.24
-0.4 to -0.08
0.25
0.88
41
FSH
0.59
0.45 to 0.73
0.72
0.59 to 0.84
0.21
0.76
44
Data shown are the slope and Y-intercepts with their 95% confidence intervals (CI), standard error (SE), correlation coefficients (R2), and the number of samples used in the calculations (n). microELISA, multiplexed sandwich enzyme-linked immunosorbent assay (ELISA) array; AFP, α-fetoprotein; PSA, prostate specific antigen; CEA, carcinoembryonic antigen; CA 125, cancer antigen 125; CA 15-3, cancer antigen 15-3; CA 19-9, cancer antigen 19-9; β-hCG, β-human chorionic gonadotropin; LH, luteinizing hormone; FSH, follicle stimulating hormone. aIndicates high-quality assays with no significant difference to clinical assays because CI included slopes of 1.0 and intercepts at 0.0.
Vol. 42 ı No. 3 ı 2007
H
0 0 2.0
1.0
Slope
CA
2.0
CA 19-9
3.0
-1.0 -1.0
hCG β-HCG
0.5
AFPa
CA
4.0
CA 15-3
1.0
-1.0 -1.0 5.0
G
2.5
Table 3. Deming Regression Data for the Nine Antigens Tested Simultaneously in the microELISA Versus the Individual Clinical Assays
125a
5.0
CA 125
2.0
0
microELISA
D
4.0
AFP
2.5
2.0
microELISA
microELISA array results were correlated to the reference methods and conventional ELISAs using Deming regression, which takes into account the uncertainty of both the reference and experimental assays. Statistical significance was determined by the 95% confidence intervals for the slope and intercept. In addition, assignment of “high quality” to an assay required that the intervals included a slope of 1 and an intercept of 0. Deming regressions were determined by EP Evaluator online at www.dgrhoads2.com.
where only three points were within the analytical measurement range (Figure 2). The R2 values for the standard curves were 0.99 for FSH, CA 125, CA 19-9, β-hCG, CEA, and PSA; 0.98 for LH; 0.92 for AFP; and 0.88 for CA 15-3. The sensitivity and useful ranges of the microELISA were compared with conventional clinical assays (Table 2). The CA 153, CEA, β-hCG, and CA 19-9 assays were more sensitive by microELISA, while total PSA, CA 125, and LH assays were more sensitive by clinical laboratory testing. The β-hCG assay had a broader analytical measurement range by microELISA, while total PSA, CA 19-9, LH, and FSH had a broader analytical measurement range by clinical laboratory testing. Deming regression analysis indicated that four of the nine microELISA assays (AFP, CA 125, CA 15-3, and CA 19-9) were not statistically different from the clinical assays (Table 3 and Figure 3). For the remaining antigens, either the slopes were different with a proportional difference between the methods, and/ or the intercepts were different with a www.biotechniques.com ı BioTechniques ı 331
Short Technical Reports
microELISA
140
1900
AFP
0 0
E
CA 15-3
950
1900 250
30
60
CEA
C
0 0
500
85
0 0 1400 160
700
CA 19-9
F
250
85
0
170
125
250
80
160
FSH
H
80
0 0
Conventional ELISA
LH
G
125
700
0 0 170
microELISA
CA 125
0 140 0 1400
70
Total PSA
B
30
0
D
950
70
60
microELISA
A
500
250
0 0
Conventional ELISA
Conventional ELISA
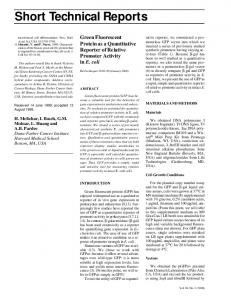
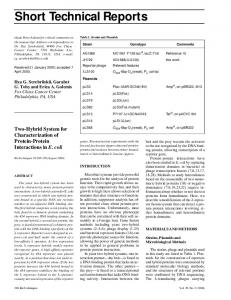
Figure 4. Regression plots of the results from each of the eight antigens measured on the multiplexed sandwich enzyme-linked immunosorbent assay (ELISA) array (microELISA) versus the corresponding results obtained from the conventional ELISAs using identical antibodies. Each antigen is shown on a separate graph (A–H). Each point represents a sample. The black line is the Deming regression and the gray dotted line represents a theoretical line with a slope of 1.0 and a Y-intercept of 0. Units correspond to those of Table 2. AFP, α-fetoprotein; PSA, prostate specific antigen; CEA, carcinoembryonic antigen; CA 125, cancer antigen 125; CA 15-3, cancer antigen 15-3; CA 19-9, cancer antigen 19-9; LH, luteinizing hormone; FSH, follicle stimulating hormone.
constant offset between assays (22,23). The PSA, CEA, β-hCG, and FSH had both a proportional and constant difference between assays. For LH there was a constant offset between the clinical assay and the microELISA. One of the challenges in antibody microarray development is to match the specificity of antibodies used in conventional assays. For example, posttranslational modifications of FSH may differ
between patients, and the antibodies recognizing FSH in the microELISA and the conventional assay may recognize different epitopes (24,25). To test this hypothesis, conventional ELISAs were performed using identical antibodies as those in the microELISA to confirm that the differences seen compared with the commercial assays were due to different antibodies. Five out of the eight assays were statistically identical according to
Table 4. Deming Regression Data for the Eight Antigens Tested Simultaneously in the microELISA Versus Conventional ELISAs Using Identical Antibodies Slope
95% CI
Intercept
95% CI
SE
R2
n
AFP
0.9
0.86 to 0.93
-0.54
-1.86 to 0.78
3.41
0.97
73
Total PSAa
1.01
0.98 to 1.04
-0.49
-0.99 to 0.01
1.4
0.97
96
CEA
0.93
0.89 to 0.97
-0.46
-1.59 to 0.68
3.5
0.97
89
CA 125a
0.96
0.91 to 1.01
-15.97
-37.11 to 5.18
59.62
0.94
88
15-3a
0.94
0.88 to 1.00
-3.93
-22.87 to 15.02
55.55
0.91
96
CA 19-9a
1.01
0.97 to 1.04
2.49
-2.27 to 7.74
10.11
0.99
50
LHa
1.0
0.96 to 1.04
-0.89
-2.95 to 1.17
6.51
0.96
96
FSH
1.08
1.04 to 1.11
-0.81
-1.78 to 0.17
2.87
0.98
92
CA
Data shown are the slope and Y-intercepts with their 95% confidence intervals (CI), standard error (SE), correlation coefficients (R2) and the number of samples used in the calculations (n). microELISA, multiplexed sandwich enzyme-linked immunosorbent assay (ELISA) array; AFP, α-fetoprotein; PSA, prostate specific antigen; CEA, carcinoembryonic antigen; CA 125, cancer antigen 125; CA 15-3, cancer antigen 15-3; CA 19-9, cancer antigen 19-9; LH, luteinizing hormone; FSH, follicle stimulating hormone. aIndicates high-quality assays with no significant difference to clinical assays because CI included slopes of 1.0 and intercepts at 0.0.
332 ı BioTechniques ı www.biotechniques.com
the Deming regressions (Figure 4 and Table 4). This suggests that different antibodies are at least partly responsible for differences between the microELISA and the clinical platforms. Antibody variation is a general problem for all arrays using an immunoassay approach, and the development of databases of antibody reactivity will improve comparisons (26). High-quality microELISA assays can be developed with characteristics similar to macroassays run on clinical platforms. Further improvements in antibody selection are expected to improve correlations with existing assays. microELISA arrays have promise for clinical diagnostics, especially when the available sample is limited. With specific antigen or biochemical panels, diagnosis and prognosis may increase in accuracy, leading to lower patient morbidity and mortality. ACKNOWLEDGMENTS
This work was funded by the Institute of Clinical and Experimental Pathology, ARUP Laboratories and The Spendlove Research Foundation. The authors would like to thank Nora Arias for technical assistance with sample collection. COMPETING INTERESTS STATEMENT
The authors declare no competing interests. REFERENCES 1. Tsao, K.C., T.L. Wu, P.Y. Chang, J.H. Hong, and J.T. Wu. 2006. Detection of carcinomas in an asymptomatic Chinese population: advantage of screening with multiple tumor markers. J. Clin. Lab. Anal. 20:42-46. 2. Wu, J.T. 2002. Circulating Tumor Markers of the New Millenium. AACC Press, Washington, D.C. 3. Powell, J.L., K.A. Hill, B.C. Shiro, S.J. Diehl, and W.H. Gajewski. 2005. Preoperative serum CA-125 levels in treating endometrial cancer. J. Reprod. Med. 50:585590. 4. Bamias, A., M. Chorti, C. Deliveliotis, N. Trakas, A. Skolarikos, B. Protogerou, S. Legaki, G. Tsakalou, et al. 2003. Prognostic significance of CA 125, CD44, and epithelial membrane antigen in renal cell carcinoma. Urology 62:368-373. 5. Markman, M., M. Federico, P.Y. Liu, E. Hannigan, and D. Alberts. 2006. Significance of early changes in the serum Vol. 42 ı No. 3 ı 2007
Short Technical Reports
CA-125 antigen level on overall survival in advanced ovarian cancer. Gynecol. Oncol. 103:195-198. 6. Kitawaki, J., H. Ishihara, H. Koshiba, M. Kiyomizu, M. Teramoto, Y. Kitaoka, and H. Honjo. 2005. Usefulness and limits of CA-125 in diagnosis of endometriosis without associated ovarian endometriomas. Hum. Reprod. 20:1999-2003. 7. Duman, C., E. Ercan, I. Tengiz, H. Bozdemir, H.E. Ercan, and I. Nalbantgil. 2003. Elevated serum CA 125 levels in mitral stenotic patients with heart failure. Cardiology 100:7-10. 8. Hashimoto, T. and F. Matsubara. 1989. Changes in the tumor marker concentration in female patients with hyper-, eu-, and hypothyroidism. Endocrinol. Jpn. 36:873-879. 9. Duarte, D.R., C.V. Chang, M.F. Minicucci, L.A. Zornoff, R.M. Inoue, M. Matsui, M.P. Okoshi, P.S. Azevedo, et al. 2006. Myxedema ascites with elevated serum CA 125 concentration. Am. J. Med. Sci. 331:103-104. 10. De Ceuninck, F., E. Marcheteau, S. Berger, A. Caliez, V. Dumont, M. Raes, P. Anract, G. Leclerc, et al. 2005. Assessment of some tools for the characterization of the human osteoarthritic cartilage proteome. J. Biomol. Tech. 16:256-265. 11. Catterall, J.B., A.D. Rowan, S. Sarsfield, J. Saklatvala, R. Wait, and T.E. Cawston. 2006. Development of a novel 2D proteomics approach for the identification of proteins secreted by primary chondrocytes after stimulation by IL-1 and oncostatin M. Rheumatology (Oxford) 45:1101-1109. 12. Hoehn, G.T. and A.F. Suffredini. 2005. Proteomics. Crit. Care Med. 33:S444-S448. 13. Semmes, O.J., Z. Feng, B.L. Adam, L.L. Banez, W.L. Bigbee, D. Campos, L.H. Cazares, D.W. Chan, et al. 2005. Evaluation of serum protein profiling by surface-enhanced laser desorption/ionization time-offlight mass spectrometry for the detection of prostate cancer: I. Assessment of platform reproducibility. Clin. Chem. 51:102-112. 14. Petricoin, E.F. and L.A. Liotta. 2004. SELDI-TOF-based serum proteomic pattern diagnostics for early detection of cancer. Curr. Opin. Biotechnol. 15:24-30. 15. Kingsmore, S.F. 2006. Multiplexed protein measurement: technologies and applications of protein and antibody arrays. Nat. Rev. Drug Discov. 5:310-320. 16. Mendoza, L.G., P. McQuary, A. Mongan, R. Gangadharan, S. Brignac, and M. Eggers. 1999. High-throughput microarraybased enzyme-linked immunosorbent assay (ELISA). BioTechniques 27:778-788. 17. Knight, P.R., A. Sreekumar, J. Siddiqui, B. Laxman, S. Copeland, A. Chinnaiyan, and A. Remick. 2004. Development of a sensitive microarray immunoassay and comparison with standard enzyme-linked immunoassay for cytokine analysis. Shock 21:26-30. 18. Nielsen, U.B. and B.H. Geierstanger. 2004. Multiplexed sandwich assays in microarray format. J. Immunol. Methods 290:107-120. 19. Lash, G.E., P.J. Scaife, B.A. Innes, H.A. Otun, S.C. Robson, R.F. Searle, and J.N. Bulmer. 2006. Comparison of three multiplex cytokine analysis systems: Luminex, SearchLight and FAST Quant. J. Immunol. Methods 309:205-208. 20. Nakane, P. 1979. Immunoassays in the Clinical Laboratory. A.R. Liss, New York. 21. Westgard, J.O. 2003. Internal quality control: planning and implementation strategies. Ann. Clin. Biochem. 40:593-611. Vol. 42 ı No. 3 ı 2007
22. Cornbleet, P.J. and N. Gochman. 1979. Incorrect least-squares regression coefficients in method-comparison analysis. Clin. Chem. 25:432-438. 23. Armitage, P., G. Berry, and J.N.S. Matthews. 2001. Statistical Methods in Medical Research, 4th ed. Blackwell Science, Oxford. 24. Creus, S., Z. Chaia, E.H. Pellizzari, S.B. Cigorraga, A. Ulloa-Aguirre, and S. Campo. 2001. Human FSH isoforms: carbohydrate complexity as determinant of in-vitro bioactivity. Mol. Cell. Endocrinol. 174:41-49. 25. Walton, W.J., V.T. Nguyen, V.Y. Butnev, V. Singh, W.T. Moore, and G.R. Bousfield. 2001. Characterization of human FSH isoforms reveals a nonglycosylated beta-subunit in addition to the conventional glycosylated beta-subunit. J. Clin. Endocrinol. Metab. 86:3675-3685. 26. Major, S.M., S. Nishizuka, D. Morita, R. Rowland, M. Sunshine, U. Shankavaram, F. Washburn, D. Asin, et al. 2006. AbMiner: a bioinformatic resource on available monoclonal antibodies and corresponding gene identifiers for genomic, proteomic, and immunologic studies. BMC Bioinformatics 7:192.
Received 1 June 2006; accepted 2 November 2006. Address correspondence to Michael Liew, ARUP Institute for Clinical and Experimental Pathology, 500 Chipeta Way, Salt Lake City, UT 84108, USA. e-mail:
[email protected] To purchase reprints of this article, contact:
[email protected]
www.biotechniques.com ı BioTechniques ı 333