A goodly number of systems for algorithm visualisation have been developed. BALSA [7, 8], ZEUS [9] and. XTANGO [10] range among the most known of them.
Proceedings of AVI’98 – Advanced Visual Interfaces Conference, L’Aquila, Italy, 1998.
SIAMOA – A SYSTEM FOR VISUAL PROGRAMMING, PROGRAM VISUALISATION AND DEBUGGING Frederic Van de Veire*, Przemysław Szmal†, Jarosław Francik*† * University of Sciences and Technologies of Lille, France † Technical University of Silesia, Gliwice, Poland ABSTRACT. The paper presents SIAMOA, a system dedicated for design, debugging and visualisation of algorithms. It combines elements of an algorithm visualisation system and an environment for visual programming. Programs may be created graphically by connecting modules represented in form of icons. Individual modules correspond either to sequences of operations written in a traditional, textual form, or to complex blocks of operations created graphically. The main concern of the visualisation of the algorithm execution process is data visualisation; it may be done as a basic or a synthetic one. The architecture of the visualisation engine has been designed with use of the P.Os.T. model, previously used to build interactive platforms for simulation of industrial processes. 1
INTRODUCTION
Programming systems are common product on the present time software market. A typical programming system involves an editor used as a tool for writing programs, a compiler or some other program used to translate them to an internal form, and a debugger – a program used by debugging and testing. The system SIAMOA that we present in this paper can be considered as a generalised system for program development and debugging, and – in the same time – as a combination of a system for program visualisation (algorithm animation) with a visual programming system. The system is described in detail in [1, 2]. Works upon visualisation and animation of algorithms and programs have been done for many years. Problems connected with it have been summarised and systematised several times, for example in [3, 4, 5, 6]. A goodly number of systems for algorithm visualisation have been developed. BALSA [7, 8], ZEUS [9] and XTANGO [10] range among the most known of them. The useful value of program visualisation systems depends on many factors essential to users playing the roles of the author of the program, the animator and the viewer. From the viewer’s point of view the most important things is the scope of program aspects covered by the visualisation and the graphical forms used during presentations. Essential for the program authors and animators is the way the program should be prepared for visualisation, and the system interface applied. In SIAMOA we decided to bridge the gaps using good partial solutions from various systems. A wide repertoire of data presentation forms was used among others in BALSA, XTANGO and ZEUS. At present, almost standard features of visualisation are animation effects. We use them; there were no such effects in the first BALSA version [7], they were introduced later in BALSA II [8], they are available in ZEUS, XTANGO and many others. Thanks to the fact that SIAMOA is implemented in Smalltalk80 (using ParcPlace Smalltalk-80 ver. 4.1) we don't need to annotate the source text of visualised programs. Annotation was used among others in BALSA, ZEUS and XTANGO. To inform the system about "interesting events" to which it has to react, the object dependency mechanism of Smalltalk is used. In comparison with program visualisation, the traditions of visual programming are shorter. Its ideas were also subject to systematisation [6, 11]. One of the formalisms used to describe visual
languages are spatial grammars [12]. The notation used in SIAMOA to register program structures is equivalent to such a grammar. Visual programs in SIAMOA are based on the data flow paradigm used previously in several systems like LabView [13], CANTATA [14] and VIZ [15]. 2
THE STRUCTURE OF THE SYSTEM
The SIAMOA system is a platform that facilitates designing, implementing and debugging as well as analysis of algorithm functioning. The system comprises two main subsystems: the Textual Programming Support System (TPSS) and the Visual Programming Support System (VPSS). TPSS is in fact a system for animation of algorithms written in Smalltalk or Pascal programming languages. From the simple user viewpoint TPSS is a kind of debugger that allows supervised execution of programs connected with presentation of chosen data structures in a graphical or textual form. The second essential subsystem, VPSS, facilitates creating and then executing programs; the execution of its component operations is data flow controlled. The main constructional elements of a visual program are modules – blocks responsible for working up input data and producing some results. Writing a program is equivalent of creation a chart showing its structure, and in particular – the input-output data links. Once created, a visual program can be executed and visualised – either using an engine specific for VPSS or accessing the means concentrated in TPSS. 3
ENGINE FOR VISUAL PROGRAM EXECUTION
To be able to execute visual programs, a special environment was created. During program execution, each module may be in one of four states; those states change cyclically. Initially, all modules are in neutral state. When the execution of a program or a module starts, all its directly incorporated modules enter the ready state, and they are waiting for delivery of their input data. A module that was given all its input data (or has no input data) goes to the active state: it processes its task. Once the task is finished and some results produced, a module enters the suspended state: it temporarily can’t be used again until it will have finished transmitting its output data to the receivers. When this is done, it passes back to the neutral state. In this way, the appearance of data produced by modules causes activation of successive modules. 4
VISUALIZATION OF THE PROCESS OF ALGORITHM EXECUTION
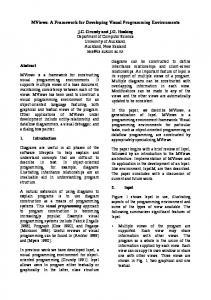
In SIAMOA, visualisation of an algorithm execution can be done in two manners: visualisation of data being processed and visualisation of the progress of code execution. Both types of visualisation are available for programs created visually and textually as well. An example is shown on fig. 1. 4.1
VISUALISATION OF THE PROGRESS OF PROGRAM EXECUTION
Observation of the progress of program execution is very useful when we recognise the way algorithms work, and is indis-
Proceedings of AVI’98 – Advanced Visual Interfaces Conference, L’Aquila, Italy, 1998.
4.3
Fig. 1. Typical view of the visualisation window pensable when we attempt to localise errors. The progress of execution can be shown for visual and textual programs as well. Visualisation of the progress of execution of a program created visually is done in the same window, in which visual programs are developed. It uses a relatively simple engine that highlights graphical blocks that correspond to the fragments of a program that are being analysed and executed. Visualisation of the progress of execution of a program written textually is done inside the main visualisation window, in the subview of method text. The manner of visualisation is very similar to that which is used in Smalltalk-80 environment: a fragment of text (usually a line) that corresponds to a statement being executed is highlighted. 4.2
DATA VISUALISATION BASICS
Data visualisation employs graphical objects like lines, rectangles, circles, text boxes etc, which may be used to compose more complex objects. Values of individual variables correspond to chosen attributes of these objects, such as position, size, form or colour. Such objects with a set of visual attributes establish graphical representation for data being visualised. A change of the state of visualised data is reflected by a change of the corresponding attributes of their graphical representation. This may be achieved by applying graphical transformation, so called animation method. Typical examples of animation methods are displacement, growing, shrinking, deformation and change of colour. Animation of complex data structures require specific methods of animation, related to the operations available for these structures, like creation or suppression of elements, permutation of two elements, etc. Visualisation should render the behaviour of an algorithm. This is why we have developed composed methods of animation. They take into account the discrete character of state changes of the data, and translate such a change into a continuous evolution from a starting to a final point, making user to understand the functioning of an algorithm easier and better.
THE VISUALISATION ENGINE
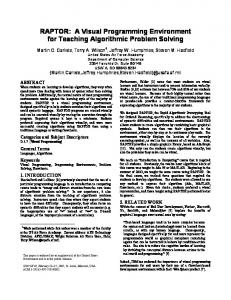
The architecture of the visualisation engine has been designed with use of the P.Os.T. (Presentation, Object of Simulation, Translation) model, previously used to build interactive platforms for simulation of industrial processes [16]. It is composed of three principal components (fig. 2). •= The object of simulation, that represents abstract part of the application. In general, it can be thought as a combination of a static part described by one or several attributes, and a dynamic part. In case of our system, only the static part is used. Its attributes represent variables of the algorithm being visualised. •= The presentation, connected to the visual aspect. It covers display and animation of graphical representations for respective objects of simulation. •= The translation that ensures coherence of abstract and graphical areas. It is based upon translation methods library. The construction of P.Os.T. model in SIAMOA system comprises two steps. In the first step user chooses objects of simulation, as well as their graphical representation and method of animation. Libraries of graphical representations and animation methods are available, as well as an editor allowing to create new ones. The second step is called prototyping. It consists in creating a translation object and using it to connect the two entities created previously. To do it, one has to choose a library translation method and to associate it to a graphical component that is to be animated. Thus, when during the execution of the program a change of variable value is detected, the corresponding translation method is executed to launch the animation. 4.4
DATA VISUALISATION VARIANTS
Visualisation of data changes during the process of algorithm execution may be done in a basic or a synthetic form. The former renders values of individual variables, while the latter allows reflecting global algorithm behaviour. Basic data visualisation enables us to visualise the state of individual variables (both simple and complex) at a given time, as well as to show how they change during the program execution. The data is displayed in a graphical form adequate to the type of a variable; for example integer variables are displayed using sliders, Boolean data are displayed in form of a binary semaphores while display of arrays involves a set of rectangular bars. Synthetic data visualisation involves an association of presentations of several variables (usually both complex and simple) in a single graphical view. Variables presented in this manner are usually closely connected semantically, and these semantic connections are what we want to accentuate in this type of visualisation. To obtain a synthetic data visualisation, a graphical representation should be chosen for each visualised variable. Then an animation method should be pointed for each type of data change, a relation between variables and a behaviour of algorithm. An example can be seen in the lower right corner of fig. 1. 5
CONCLUSION
The SIAMOA system is a generalised environment for program development, debugging and testing. In the same time it is a combination of a system for algorithm visualisation with a system
Proceedings of AVI’98 – Advanced Visual Interfaces Conference, L’Aquila, Italy, 1998.
for visual programming. It was developed on the basis of the
ference Proceedings, Minneapolis, Minn. 18(3) 1984,
Image
Model Data
Object of Simulation Register of simulated objects
Methods of behaviour
Presentation Object Translator Graphical objects Methods of displaying
Translated objects Methods of translation
Animation Method Object
Fig. 2. Architecture of visualisations in SIAMOA based on the P.Os.T. model Smalltalk-80 integrated programming environment. It is intended to give a strong graphical support for programming works in various domains. It may be useful where nontrivial algorithms are necessary, connected with traditional, control flow directed execution style or based on the data flow paradigm. BIBLIOGRAPHY [1] [2] [3] [4]
[5] [6] [7]
F. Van de Veire, Program Visualization and Visual Programming. Modelling and Simulation ESM’96 (European Simulation Multiconference), Budapest, 1996. F. Van de Veire, La Simulation et l’Animation Modulaire d’Algorithmes en Langage Objet. PhD thesis. Universite des Sciences et Technologies de Lille, 1997. B.A. Price, I.S. Small, R.M. Baecker, A Taxonomy of Software Visualization. Proc. of 25th Hawaii International Conference on System Sciences, 1991, 597-606. G. C. Roman, K. C. Cox, Program Visualization: the Art of Mapping Programs to Pictures, International Conference on Software Engineering, New York, 1992, 412420. J. Stasko, C. Patterson, Understanding and Characterising Software Visualization Systems. Proc. of 1992 IEEE Workshop on Visual Languages. B.A. Myers, Taxonomies of Visual Programming and Program Visualisation. Journal of Visual Languages and Computing. Vol. 1/1990, 97-123. M. H. Brown, R. Sedgewick, A System for Algorithm Animation, Computer Graphics: SIGGRAPH'84 Con-
[8] [9]
[10] [11] [12] [13] [14] [15]
[16]
177-186. M. H. Brown, Exploring Algorithms Using Balsa II, Computer, 21(5) 1988, 14-36. M. H. Brown, Zeus: a System for Algorithm Animation and Multi-view Editing, Research Report 75, Digital Equipment Corporation Systems Research Center, Palo Alto 1992. J. Stasko, Animating Algorithms with XTANGO, SIGACT News, 23(2), 1992, 67-71. M. Burnett, A. Goldberg, Lewis, Visual Object-Oriented Programming, Prentice-Hall, 1995. E.J. Golin, S.P.Reiss, The Specification of Visual Language Syntax. Journal of Visual Languages and Computing, Vol. 1, No 2, 1990, 141-157. G.M.Vose, G.Williams, LabVIEW: Laboratory Virtual Instrument Engineering Workbench. Byte, No 11/1986, 84-96. M.Young, D.Argiro, S.Kubica, Cantata: Visual Programming Environment for the Khoros System. Computer Graphics, Vol. 29, No 2/1995, 22-24. H.H.Hersey, S.T.Hackstadt, L.T.hansen, A.D.Malony, Viz: A Visualisation Programming System. University of Oregon, Dept. of Computer and Information Science, Tech. Rap. CIS TR-1996. M. Mostefai, P.Os.T.: An Architectural Model for Interactive Simulation Interfaces Design. IEEE/SMC’93 Conf., Systems Engineering in the Service of the Humans. Le Touqet, 1993, Vol. 2, 550–555.