Simple One-Pot Syntheses and Characterizations of Free Fluoride
Recommend Documents
Dec 21, 2013 - new Ce(III) coordination polymers via isomeric tartaric acid ligands ... as tartaric acid which owns two chiral centers can bring the desired.
The Cd(II) ion of the CdâNiâetim complex is six-coordinate, completed with .... The FT-IR and Raman spectra of all of the complexes are given in Figures 1 ..... Kazuo, N. Infrared and Raman Spectra of Inorganic and Coordination Compounds.
phosphorus were employed producing the first naked P2 and P6 complexes, .....
Starting with the higher order structures, the employment of LiCp* in conjunction.
excess monodentate and bidentate ligands resulted in the formation of fully ...... KaradaÄ A, Destegül A.N-(2-hydroxyethyl)-ethylenediamine-based ionic liquids: ...
Abstract. Four novel unsymmetrical β-diketiminates 2-(2,6-diisopropylphenyl)amino-4-(phenyl)imino-2-pentene (4a), 2-(2 ...
930. 10000. 11000. 12000. 13000. 14000. 15000. 16000. Binding Energy (E) co ... 6000. 8000. 10000. 12000. 14000. 16000. 18000. Binding Energy (E) c oun ts. /s ... 850. 8000. 8500. 9000. 9500. 10000. 10500. Binding Energy (E) counts/s.
Mar 5, 2014 - narrow spectrum antibiotic drugs respectively whereas cefixime was a third generation drug. The use of metal complexes as biological probes ...
inequalities hold: M(x1,x2) ≤ F(X1,X2)(x1,x2) ≤ W(x1,x2) for all (x1,x2) ∈ IR2,. (1.1) where W is usually referred to as the Fréchet upper bound of R(F1,F2) and ...
Dec 31, 2013 - Thomas E. Morrell, Theodora K. Karagounis,. â . Chih-Hao Hsia, and Chia-Ying Wang*. Department of Chemistry, Princeton University, ...
Rajender S. Varma. Department of Chemistry and Texas Research Institute for Environmental Studies (TRIES), Sam Houston. State University, Huntsville, Texas ...
cyclization, rearrangement, oxidation and reduction reactions including the .... chlorochromate, Dowex-50, dimethyl dioxirane, H2O2 over tita- nium silicalite-1 ...
cyclization, rearrangement, oxidation and reduction reactions including the ..... 'doped' alumina. Iodoxybenzene, o-iodoxybenzoic acid (IBX), bis(trifluoroace-.
a tandem or one-pot procedure can be an elegant solution to this issue. Development .... Also, branched iBuMgBr reacted poorly (Table 3,. Entry 4). Addition of ...
Sep 17, 2013 - EaStCHEM, School of Chemistry, University of St Andrews ... Carnegie Trust for the Universities of Scotland (LCM) for funding, and the EPSRC ...
supported by the US National Science Foundation (DMS-1109316). Email addresses: [email protected] (Sung-Ha Hwang), lu
we consider the space Qp consisting of all analytic functions f in D such that f2 .... measurable function on (0,â) and f(z) = K(1 â |z|2). If. â« â. 0. ÏK(x). (1 + x)3.
May 21, 2014 - Av. Adhemar de Barros, S/N, Ondina,. 40170-110 Salvador-BA, Brazil email: [email protected]. Pedro V. Silva. Universidade Federal da ...
Fluorescence probes are very useful analytical tools for the visualization of trace amounts of biological compounds. The combination of an appropriate ...
Sep 20, 2011 - tetrapropylammonium bromide, Acros Organics; sodium hydrox- ... plate as the hydroxide, iodide or bromide were added together in a suitable ...
Key words: Aluminium and liver; Ascorbic acid; Fluoride and liver; Free ... orosis.1 Fluoride induced hepatotoxicity due to the formation of free radicals and.
Oct 30, 2015 - While within halfâfluoride SrTiO3/KAgF3, outâofâplane electronic ... oxides2,3, we carried out investigation on electronic properties of fluoride ... have also suggested that properly holeâ or electronâdoped AgII flu- ... tra
Tecnológico Santa Fe.CONICET-UNL. Ruta Nacional 168. Km 1. Paraje El Pozo, 3000,. Santa Fe, Argentina b. Instituto de QuÃmica de Rosario (IQUIR). Centro ...
Abstract. Electronic power modules devices are paramount components in the aeronautical, automotive and military applications. The solder layers are the most ...
May 12, 2012 - computers, cell phones, micro-electronic devices, etc. ...... S. O. Pillai, Solid State Physics, New Age International Publishers, sixth edition.
Simple One-Pot Syntheses and Characterizations of Free Fluoride
Nov 30, 2016 - Free Fluoride- and Bifluoride-Containing Polymers ... maltodextrin, were complexed with ammonium (bi)fluoride using hydrogen bonds to form ...
materials Article
Simple One-Pot Syntheses and Characterizations of Free Fluoride- and Bifluoride-Containing Polymers Soluble in Non-Aqueous Solvents Dominik Steinle 1 , Laura Friedrich 1 , Nico Bevilacqua 1 , Elizabeth von Hauff 2 and Fabienne Gschwind 1, * 1 2
Academic Editor: Federico Bella Received: 27 October 2016; Accepted: 22 November 2016; Published: 30 November 2016
Abstract: One of the problems that arise with bifluoride- or fluoride-containing compounds is their poor solubility in non-aqueous solvents. We report herein a facile one-pot synthesis and the chemical analysis of fluoride/bifluoride-containing polymers, which are soluble in MeCN. Different polymers, such as Polyvinylacetate or Polyethylene imine and saccharides, such as maltodextrin, were complexed with ammonium (bi)fluoride using hydrogen bonds to form the desired (bi)fluoride-containing compounds. The newly formed hydrogen bonding (bi)fluoride-doped polymer matrices were analyzed using infrared and nuclear magnetic resonance spectroscopies, and X-ray diffraction. The promising materials also underwent impedance spectroscopy, conductivity measurements and preliminary tests as electrolytes for room temperature fluoride ion batteries along with an analysis of their performance. Keywords: fluoride; bifluoride; polymer; conductivity; quantitative measurement; fluoride ion batteries; electrolyte
1. Introduction The incorporation of fluorine into polymers is widely known, especially those with C–F bonds (the so-called “fluoropolymers”), the most famous of which being Polyvinyl fluoride (PVF), Polyvinyliden fluoride (PVDF), and Polyterafluoroethylene (PTFE). These fluoropolymers all have a wide impact on our daily lives [1], for instance, in household items such as pans or clothing (Teflon® , and Goretex® ), as binders in lithium ion batteries [2], as membranes in fuel cells [3,4], and even in anti-fouling paint for ships [5,6]. Nevertheless, polymers containing free fluoride species, where the fluoride component, (F− or F2 H− ) is not covalently bound to the carbon backbone, are very rare. Poly[4-vinylpyridinium poly(hydrogen fluoride)] is one of the few commercially available polymers containing hydrogen fluoride and is used as a fluoridation agent [7,8]. Even so, the free fluoride ion is used widely in the syntheses of organofluoride derivatives; for example, compounds containing free fluorides are used as fluoridation agents [9]. Tetraalkylammonium fluoride has, in particular, been an important reagent in this field for many years, despite its disadvantages like decomposition upon drying [10,11]. Today, more selective and safer materials can be used, e.g., the commercially available “selectfluor” fluoridation agents comprised of diazobicyclo octane [12].
Materials 2016, 9, 965; doi:10.3390/ma9120965
www.mdpi.com/journal/materials
Furthermore, ionic fluoride is also used as a proton abstractor in base-assisted reactions [13] and as a promoter for organosilyl reactions. To be able to measure the fluoride content of a solution, the so-called fluoride sensing method Materials 2016, 9, 965 2 of 16 can be used. In this method, organic molecules bind fluoride ions selectively, and can be detected, for instance, by optical methods [14–16]. Additionally, the nature of the free or naked fluoride ion Furthermore, ionic fluoride is also used as a proton abstractor in base-assisted reactions [13] and has beenasdiscussed in the literature, especially towards its potential to form very strong hydrogen a promoter for organosilyl reactions. bonds [17–20]. There are also some reports aboutofthe crystalthe structure the bifluoride anion and its To be able to measure the fluoride content a solution, so-calledof fluoride sensing method be used. In this method,bonds organic[21]. molecules bind fluoride ions selectively, and can be detected, ability tocan form strong hydrogen for instance, by optical methods [14–16]. the nature of theroom-temperature free or naked fluoridefluoride ion Our work pertains to electrolytes for Additionally, anion batteries, namely ion has been discussed in the literature, especially towards its potential to form very strong hydrogen batteries [22–24], where we are investigating fluoride-containing compounds, which should have bonds [17–20]. There are also some reports about the crystal structure of the bifluoride anion and its the following attributes: solubility in[21]. non-aqueous solvents; (ii) fluoride species that are free to ability to form strong(i) hydrogen bonds migrate andOur notwork bonded within a structure; (iii) batteries, do not undergo decompositionfluoride to form pertains to electrolytes for anion namely room-temperature ion HF; (iv) batteries [22–24], where we are investigating fluoride-containing compounds, which should have contain molecules which will not undergo decomposition during electrochemical reactions; and (v) the following electrolytes attributes: (i) that solubility non-aqueous solvents; between (ii) fluoride that are free fluoride-containing allowinfor charge transport thespecies electrodes. to migrate and not bonded within a structure; (iii) do not undergo decomposition to form HF; In the beginning, ionic liquids such as alkyl ammonium fluoride were tested as electrolytes but (iv) contain molecules which will not undergo decomposition during electrochemical reactions; failed since toofluoride-containing many side-processes were ongoing discharge clearly attributed to and (v) electrolytes that allow forand charge transport could betweennot the be electrodes. the transport of beginning, fluoride. ionic We liquids decided to investigate thatbut contained In the suchtherefore as alkyl ammonium fluoride polymer were testedmatrices as electrolytes since too many side-processes were ongoing and discharge could (PEG) not be clearly attributed fluoride failed or bifluoride anions. Until now, only poly(ethylene glycol) derivatives have been to the transport of fluoride. We decided therefore to investigate polymer matrices that contained tested, where the PEG polymer was reacted with ammonium (bi)fluoride in MeCN, with the fluoride or bifluoride anions. Until now, only poly(ethylene glycol) (PEG) derivatives have been tested, hypothesis that the ammonium ions would form hydrogen bonds with the ethereal oxygen atom. In where the PEG polymer was reacted with ammonium (bi)fluoride in MeCN, with the hypothesis this way,that a polycation wasions formed that forces the otherwise fluoride tothis dissolve in the ammonium would form hydrogen bonds withinsoluble the ethereal oxygen species atom. In the solution It remains however, asotherwise to the types of bonding that are way, [22]. a polycation was unclear, formed that forces the insoluble fluorideinteractions species to dissolve in formed the solution [22]. Itanion, remainsthe unclear, however, asion to the types formed among the bifluoride ammonium and theof bonding polymerinteractions (Figure that 1). are Furthermore, the among the bifluoride anion, the ammonium ion and the polymer (Figure 1). Furthermore, the species species in solution exist in a complex equilibrium. in solution exist in a complex equilibrium.
Figure 1. A selection of possible coordination geometries of fluoride ions and ammonium ions to
Figure 1.different A selection of possible coordination geometries of fluoride ions and ammonium ions to functional groups: (a) Coordination of F− to alcohol groups; (b) Coordination of F2 H− to any − to alcohol groups; (b) Coordination of F2H− to any differentkind functional groups: (a) Coordination of Fion of C=O; (c) Coordination of the ammonium to an aldehyde or acetate type of functional group − ; and (d,e) Example of coordination to polyvinyl pyrrolidone (PVP) further coordination to Fof kind of and C=O; (c) Coordination ammonium ion to an aldehyde or acetate type of functional 2 Hthe withfurther the ammonium group ortowith F2 H−(d,e) ion. Example of coordination to polyvinyl pyrrolidone −; and group and coordination F2Hthe (PVP) with the ammonium group or with the F2H− ion.
It should be noted that these fluoride-doped PEG matrices contained exclusively bifluoride (F2H−), instead of fluoride (F−), as its anionic species. This result is due to the strong proton-abstracting power of fluoride ions, which can abstract protons from either the polymer or
Materials 2016, 9, 965
3 of 16
It should be noted that these fluoride-doped PEG matrices contained exclusively bifluoride (F2 H− ), instead of fluoride (F− ), as its anionic species. This result is due to the strong proton-abstracting power of fluoride ions, which can abstract protons from either the polymer or from the solvent itself. To carry on this work further, additional polymers were selected for analysis to study the abilities of polymers containing different types of functional groups to take up ammonium and bifluoride ions. We choose polyvinyl acetate (PVAC) and polyvinyl pyrrolidone (PVP) as polymers containing carbonyl groups, and polyethylene imine (PEI) and the shorter tetraethylenepentamine (TEPA) as polymers containing amine groups. We also chose to investigate molecules containing hydroxyl groups as OH . . . F hydrogen bonding interactions could be possible. Our initial tests with polyvinyl alcohol (PVA) failed, as the molecule was insoluble in the solvent system employed. However, after interesting tests with xylitol we also decided to test larger saccharide molecules, such as maltodextrin. In this report, we present the one-pot syntheses of four polymer matrices and two smaller molecules containing coordinated bifluoride or fluoride ions. We first show how it is possible to use a standard fluoride sensitive electrode to measure bifluoride in solvents. Then, we present characterizations of the four new compounds and preliminary tests on these polymers as electrolytes in room temperature fluoride ion batteries along with their electrochemical performance. 2. Results 2.1. Measuring Bifluoride in Solvent: An Approach Based on a Standard Fluoride Sensitive Electrode A critical component of testing fluoride ion-containing batteries is the determination of how many F− ions are present in the electrolyte. Unfortunately, no sensors currently exist that can measure fluoride ion content in non-aqueous solution, or which can measure bifluoride ions at all. Therefore, as a first step, we used the following approach as a calibration to estimate fluoride content for further studies in solvent: For investigations, the bifluoride ion, F2 H− , must be split, which can be achieved by shifting the equilibrium F2 H− F− + HF 2F− + H+ . As most electrolytes are slightly acidic, this change in equilibrium can be induced by adjusting the pH of the solution. Tests carried out showed that the most accurate measurement of F2 H− detection is reached at pH 7 (Table 1) and that at this point about 94% of the fluoride ion in the F2 H-test solution could be measured. These measurements had to be performed in water as the fluoride sensitive electrode (FSE) reacts strongly on the presence of solvent or even trace of solvents in water, therefore it was not possible to measure these values in the electrolyte acetonitrile (MeCN) mixture. Table 1. Fluoride content dependence on changes in pH. Theoretical Amount of F− Present in the Test Solution (ppm)
pH
Measured F− Amount (ppm)
Percentage of Monitored F− (%)
1000 885 664
3.9 7.35 9.54
497 832 576
50 94 86
We applied this approach to estimate fluoride contents of the different compounds. The detailed synthesis and naming of the compounds can be found in the Experimental Section. To determine fluoride content in the compounds, 0.1 g of material was solved in 4 mL water and the pH was adjusted to about pH 7 using sodium hydroxide. The solutions were then increased to 5 mL, with the exception of PVAC, which it was virtually insoluble under these conditions. The results are given in Table 2. We emphasize that these measurements give an approximation of the fluoride quantity.
Materials 2016, 9, 965
4 of 16
Table 2. Fluoride content and conductivity of the different compounds. Electrolyte
2.2. Conductivity of the Fluoride Electrolytes and Reference Samples The conductivity of polymer bifluoride matrices depended strongly upon the dissolution of the sample, due to the swelling effect of the polymer, which has a direct influence on the mobility of the ions being measured (Table 3). The conductivity was also dependent on the solvent used (see Supplementary Materials Figure S1). MeCN was chosen as a solvent, as it is the same solvent we used in the battery tests (described later). When preparing the solutions, 0.1 g of fluoride material in 4 mL of MeCN was used. The fluoride containing Xylitol compound (Xy-F) and the fluoride containing Maltodextrin compound (Malto-F) only dissolved slightly under these conditions, so measurements were carried out in a saturated solution of these compounds. As a reference for fluoride content and conductivity, we used Tetraglyme*NH4 F2 H (TGBF) from [22] which was dissolved in MeCN in the same manner. Previous studies reported that a saturated solution of KF in DMSO contained 8 mg of fluoride [25]. Table 3. Fluoride content and conductivity of the different compounds (for the abbrevations also refer to experimental section). Electrolyte
Both of the amine-containing compounds, PEI and TEPA, formed, in aqueous solution, a protonated polycation [26], and as side-reactions might occur, the values reported might not represent the actual fluoride concentration. Fluoride containing PEI polymer (PEI-F) also showed an unexpected behavior, whereby PEI was completely soluble in MeCN, while the product PEI-F showed almost no dissolution (Figure 2). PVAC was not very soluble in water, so higher volumes of solvent were required. Regardless of this, the fluoride containing PVAC polymer (PVAC-F), as well as PVP-F, showed higher fluoride contents than the previously used tetraglyme ammonium bifluoride [22], while PVP-F also showed also better conductivity than the fluoride containing polymer reported in the publications before [22].
Materials 2016, 9, 965
5 of 16
Materials 2016, 9, 965 Materials 2016, 9, 965
of 15 5 of515
alsoalso better conductivity than the polymer reported reported inthe thepublications publications before [22]. As these measurements were outcontaining at high dissolution, the in values obtainedbefore do not indicate better conductivity thancarried thefluoride fluoride containing polymer [22]. As As these measurements were carried at thevalues values obtained do not indicate these measurements were carriedout out at high high dissolution, dissolution, the not indicate thethe and the maximum conductivity possible. Titrations can be carried outobtained using do different solvents maximum conductivity Titrations can carried out using using different solvents andtests. maximum conductivity possible. Titrations can be carried out different solvents and concentrations to determine possible. the optimum conductivity and solvent systems for further battery concentrations determinethe theoptimum optimumconductivity conductivity and battery tests. concentrations toto determine and solvent solventsystems systemsfor forfurther further battery tests. The most intriguing result obtained was that of the high conductivity measured of both Xy-F The most intriguingresult resultobtained obtained was was that that of the of of both Xy-F The most intriguing the high high conductivity conductivitymeasured measured both Xy-F and Malto-F after filtration, since almost of the compounds during the reaction could Malto-F after filtration, since almostno nodissolution dissolution of reaction could andand Malto-F after filtration, since almost no dissolution of the thecompounds compoundsduring duringthe the reaction could be observed. observed. be be observed.
Figure 2. Change in physical properties of NH4F after reaction with PEI.
Figure 2. Change in physical properties of NH4 F after reaction with PEI. Figure 2. Change in physical properties of NH4F after reaction with PEI.
2.3. NMR and IR Spectroscopic Results
2.3. NMR and IR Spectroscopic Results 19 and IR Spectroscopic Results 2.3. NMR
F NMR spectroscopic measurements showed the typical fluoride doublet resonance at around
19 F−150 for PVAC-F, measurements PVP-F and Xylitol-F [27–29]. CD3CNdoublet also showed a similar 19 ppm NMR spectroscopic showed the Malto-F typical in fluoride resonance at around
F NMR spectroscopic measurements showed the typical fluoride doublet resonance at around resonance at −107 ppm, which is presumably attributable to F− ions [30]. PEI and TEPA also showed PVAC-F, PVP-Fand andXylitol-F Xylitol-F [27–29]. [27–29]. Malto-F 3CN alsoalso showed a similar −150−150 ppmppm for for PVAC-F, PVP-F Malto-FininCDCD showed a similar 3 CN the presence of F− ions. We assume that a partial substitution of− the secondary R–NH2 groups to form resonance at −107 ppm, which ispresumably presumably attributable attributable to FF− ions [30]. PEIPEI andand TEPA also also showed resonance at − 107 ppm, which is to ions [30]. TEPA showed + − − − taken place, which could explain the presence of F , and not F2H as expected R–NH3 •F had − ions. We assume that a partial substitution of the secondary R–NH2 groups to form the presence of−Fions. the presence of F We assume that a partial substitution of the secondary R–NH groups to 2 (Figure 3, see also Experimental Section for details of NH3 evolution). − had taken place, which could explain the presence of F−, and not F2H− as expected 3+•F R–NH + − − − form R–NH3 •F had taken place, which could explain the presence of F , and not F2 H as expected (Figure 3, see also Experimental Section for details of NH3 evolution).
(Figure 3, see also Experimental Section for details of NH3 evolution).
Figure 3. Reaction of ammonium fluoride with amine-containing polymers.
For IR spectroscopic analyses, few changes to the spectra were expected as no “chemical bonds” Figure 3. Reaction ammonium fluoride fluoride with amine-containing polymers. Figure 3. large Reaction ofofammonium with amine-containing polymers. were formed in the polymer matrix, and only a few peak shifts could be observed between the spectra of the matrix and complexed product [31]. Furthermore, the quantity of hydrogen-bonded For IR spectroscopic analyses, few changes to the spectra were expected as no “chemical bonds” ammonium ions appeared to be less than expected, so no dramatic changes from the native polymer For spectroscopic analyses, changes to the spectra were could expected as no “chemical bonds” wereIR formed in the large polymerfew matrix, and only a few peak shifts be observed between the to the product formed were expected. The IR spectra of PEI-F and TEPA showed no obvious changes were spectra formed thematrix largeand polymer matrix, and only few peak shifts could be between the ofinthe complexed product [31]. aFurthermore, the quantity of observed hydrogen-bonded (Figure 4a,b). The same was also true for PEI-F, where the spectra showed very few differences ammonium ions appeared to be less than expected, so no dramatic changes from the native polymer spectra of the matrix and complexed product [31]. Furthermore, the quantity of hydrogen-bonded between the product and the original trace of the native polyethylene amine molecule, other than the
to the product formed were IR spectra and TEPA showed nothe obvious ammonium ions appeared to beexpected. less thanThe expected, soofnoPEI-F dramatic changes from nativechanges polymer to (Figure 4a,b). The same was also true for PEI-F, where the spectra showed very few differences the product formed were expected. The IR spectra of PEI-F and TEPA showed no obvious changes between the product and the original trace of the native polyethylene amine molecule, other than the (Figure 4a,b). The same was also true for PEI-F, where the spectra showed very few differences between the product and the original trace of the native polyethylene amine molecule, other than the typical vibration of NH4 F no longer being visible. One difference that was observed was the broadening of the band at around 3200 cm−1 [32], which could possibly be attributed to a change in the N–H vibration
Materials 2016, 9, 965
6 of 15
typical Materialsvibration 2016, 9, 965 of NH4F no longer being visible. One difference that was observed was 6the of 16 broadening of the band at around 3200 cm−1 [32], which could possibly be attributed to a change in the N–H vibration upon coordination to F−. There were also small changes in the fingerprint region, upon coordination to F−of . There were also small changes in the fingerprint region, especially in the especially in the intensity the bands. intensity of the bands. The IR spectra of PVP-F and PVAC-F showed only small changes upon formation of the The where IR spectra of PVP-F and PVAC-F only small changes formation the products, products, the bands observed could showed be largely attributed to the upon polymer matrix of (Figure 4c,d). where the bands observed could be largely attributed to the polymer matrix (Figure 4c,d). In the case −1 −1 In the case of PVAC-F, new bands appeared at 1000 cm and at 900 cm , and similar to the −1 and at 900 cm−1 , and similar to the previously reported of PVAC-F, new bands appeared at 1000 cm previously reported observations for PEG-compounds, the band corresponding to the N–H observations for PEG-compounds, band acorresponding to the N–Hcm vibrations disappeared. the −1 and a double vibrations disappeared. In the case ofthe PVP-F, very small peak at 2934 peak atIn 700 −1 and a double peak at 700 cm−1 appeared, in addition to case of PVP-F, a very small peak at 2934 cm −1 −1 cm appeared, in addition to broadening of the band at 950 cm . broadening of the band at 950 cm−1 .
When Whenlooking lookingatatthe thespectrum spectrumofofXy-F, Xy-F,no nosignificant significantchanges changescould couldbebeobserved, observed,other otherthan thana a general generalbroadening broadeningofofthe thebands. bands.The Thespectrum spectrumofofMalto-F Malto-Fshowed showedobservable observablechanges, changes,however, however, where, shift of of the the wider widerhydroxyl hydroxylband bandat where,ininparticular, particular,the thenon-soluble non-soluble Malto-F-precipitate Malto-F-precipitate showed a shift − 1 − 1 − 1 around 3353 cm towards 3100 cm and the formation of an additional band at 726 cm (Figure 4e,f).
Materials 2016, 9, 965
7 of 15
Materials 2016, 9, 965
7 of 16
at around 3353 cm−1 towards 3100 cm−1 and the formation of an additional band at 726 cm−1 (Figure 4e,f). We are unsure if these changes are an effect of N–H or F–OH bonding interactions. The fingerprint region showed a large at 1447 cm−1, or which is commonly attributed toThe a combination We are unsure if these changes areband an effect of N–H F–OH bonding interactions. fingerprint − 1 of OCHshowed and CCH vibrations [33]. Similar the Malto-F-precipitate, a new peak at 720 cm−1 appeared region a large band at 1447 cm to , which is commonly attributed to a combination of OCH − 1 in the spectrum of Malto-F-filtrate, which can be attributed to the C–O and C–C vibrations and CCH vibrations [33]. Similar to the Malto-F-precipitate, a new peak at 720 cm appeared of in the the carbohydrate group [33]. which can be attributed to the C–O and C–C vibrations of the carbohydrate spectrum of Malto-F-filtrate, group [33]. 2.4. Characterization with X-ray Diffraction 2.4. Characterization with X-ray Diffraction In the case of PVP and PVAC, no structural information could be inferred from the PXRD In the case of PVP no structural could be inferred from PXRD spectra spectra collected, and and onlyPVAC, the large signals ofinformation the polymers were observed (seethe Supplementary collected, and only Materials Figure S2).the large signals of the polymers were observed (see Supplementary Materials PXRD Figure S2). can be helpful to determine if the product is pure and if an incorporation of the fluoride salt was sometimes the remaining starting product be observed andfluoride a second PXRDachieved: can be helpful to determine if the product is pure and if ancan incorporation of the salt recrystallization step is needed. However, the spectrum of Xy-F showedand many small recrystallization changes, which was achieved: sometimes the remaining starting product can be observed a second indicates that a structural had occurred the crystalline structure of thewhich polymer. Similarly, step is needed. However, change the spectrum of Xy-Finshowed many small changes, indicates that the yellow precipitate of occurred Malto-F showed the appearance of new peaks in the Similarly, broad spectra of the a structural change had in the crystalline structure of the polymer. the yellow maltodextrin matrix, indicating that some form of crystalline compound had formed. These small precipitate of Malto-F showed the appearance of new peaks in the broad spectra of the maltodextrin peaks were due tothat the some phases of NH 4BF4 [34] and NH4SiF6had [35],formed. which These were initially thought be matrix, indicating form of crystalline compound small peaks weretodue introduced toofthe sample from glass vessel used. When the reaction was repeated in to the phases NH andthe NH [35], which were initially thought to be introduced to the 4 BF4 [34] 4 SiF6reaction plastic or Teflon vessels, however, these When peaksthe were still observed, so in it plastic is mostorlikely the sample from the glass reaction vessel used. reaction was repeated Teflonthat vessels, maltodextrin a so borosilicate impurity, could precursor be observed by however, these precursor peaks were contained still observed, it is most likely that thewhich maltodextrin contained energy-dispersive X-raywhich (EDX)could spectroscopy of the materials. This of spectroscopy impurity could a borosilicate impurity, be observed by starting energy-dispersive X-rayissue (EDX) of be overcome by recrystallization the starting materials priorby to recrystallization their use (see Supplementary the starting materials. This issue ofofimpurity could be overcome of the starting Materials prior FiguretoS3). materials their use (see Supplementary Materials Figure S3). 2.5. Optical Properties Properties 2.5. Optical The feature observed for these products was was the the yellow yellow color color of of the The most most intriguing intriguing feature observed for these polymeric polymeric products the compounds prepared (Figure 5). compounds prepared (Figure 5).
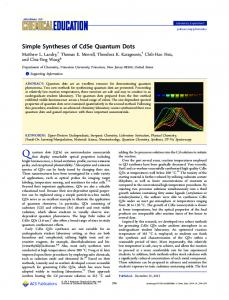
Figure 5. Color changes of Malto-F (soluble filtrate) and PVAC-F after reaction. Figure 5. Color changes of Malto-F (soluble filtrate) and PVAC-F after reaction.
Materials 2016, 9, 965
8 of 16
These results were likely due to the presence of hydrogen bonding and the subsequent bathochromic shift. Bathochromic shifts are typical upon the coordination of anions [36] and it has been previously observed that the coordination of fluoride ions can generate such shifts [16,37]. Furthermore, similar effects were reported in examples of ammonium ion and ammonia sensing, whereby the coordination of ammonium also generated such a bathochromic shift [38–41]. To check if the ammonium ion was responsible for this color change, the reactions were repeated with NH4 Cl in place of NH4 F. For both PVAC and PVP, no color change could be observed, so we hypothesized that the color change observed was due to fluoride/bifluoride coordination to the polymers [37,42]. 2.6. Characterization Summary In summary, we conclude that, in the cases of PVAC and PVP, complexation of polymers by NH4 F2 H has occurred. Due to the low conductivity and fluoride concentration, as well as the presence of N atoms in the materials prepared (see Supplementary Materials Figure S3), we propose that NH4 F2 H has been incorporated into the polymer. In the case of polymers containing PEI and TEPA, we propose that a partial protonation of the -NH2 group to -NH3 F- may have occurred. There is also the possibility that there are free NH4 + ions in the molecule. Xy-F and Malto-F also show the presence of N atoms, which supports the thesis that both ammonium and fluoride ions have been introduced to the polymer matrices. 3. Discussion 3.1. Electrochemical Stability and Impedance Spectroscopy Cyclic voltammetry (CV) and linear sweep voltammetry (LSV) studies were performed to test the electrochemical stability of the compounds and to make sure that no unwanted side-reactions would occur if the fluoride-containing polymers were subjected to a change in voltage. Neither ammonium fluoride and bifluoride or the polymer matrices alone showed any CV signals or special features, and therefore it was assumed that the new compounds would also not show any activity upon changes in voltage. The experiments were performed in MeCN to keep the conditions as similar as possible to those that would later be used in battery tests and applications, therefore PEI-F and TEPA-F were measured in pure state. The stability of the polymers against the Ag reference was observed to be identical of pure MeCN. (See Supplementary Materials Figure S4). Subsequently, the electrochemical impedance spectra of the two compounds that showed the highest conductivity (PVP-F and Malto-F) were measured and compared to the already known electrolyte Tetraglmye*NH4 F2 H (Figure 6). The impedance spectra were measured from high frequency (106 Hz) to low frequency (10 Hz), and the conductivity values were calculated by taking the inverse of the real component of the impedance. At frequencies above 103 Hz, the spectra are nearly frequency-independent (Malto-F demonstrates a slight decrease with decreasing frequency) and no features are observed. Both PVP-F and Malto-F show higher conductivity values than the reference electrolyte, however the conductivity of Malto-F is observed to over five times higher than that of PVP-F in this frequency range. It should be noted that the conductivity values were not normalized for the cell geometry, and are given in milli Siemens (mS). At lower frequencies (below 103 Hz) the conductivity drops. This corresponds to an increase in the capacitance at these frequencies (Figure 5a), and can be attributed to the build up of charged species at the electrode interface at low frequencies approaching the DC case.
Materials 2016, 9, 965 aterials 2016, 9, 965
9 of 16
9 of
(a)
(b) Figure 6.dependent Frequency dependent conductivity spectra and frequency dependent capacitance capacitance spectra of Figure 6. Frequency conductivity spectra and frequency dependent spectra of compounds TGBF, PVP-F and Malto-F. (a) Capacitance; (b) Conductivity. compounds TGBF, PVP-F and Malto-F. (a) Capacitance; (b) Conductivity.
3.2. Preliminary Tests of Electrolytes in RT-FIB
2. Preliminary Tests of Electrolytes in RT-FIB The electrolytes were tested in simple fluoride ion test cells.
The cathode was prepared from BiF3 , Carbon Black and Carboxy-Metylcellulosis (CMC), and a separator comprised of either cotton The electrolytes were tested filter. in simple fluoride ion test cells. cathode or a Whatman (glasswool) The anode consisted of an Mg-band that The was cut into smallwas piecesprepared fro and sanded use. It was also important that solventsand were a used that wouldcomprised not damage the iF3, Carbon Black andbefore Carboxy-Metylcellulosis (CMC), separator of either cotto anode, therefore MeOH, EtOH, and H2 O were not employed in these experiments. Although only the r a Whatmansurface (glasswool) filter. The anode consisted of an Mg-band that was cut into small piec of the cathode and anode would come in direct contact with the electrolytes, the total bulk of theseuse. materials were also used inimportant calculations [24]. curves generally variations in their nd sanded before It was thatThe solvents were showed used that would not damage th shape and performance, on account of the batteries being made and assembled by hand. We therefore node, therefore MeOH, EtOH, and H2O were not employed in these experiments. Although on chose to omit the worst and best curves and instead select a curve to study that reflected the average he surface of performance the cathode anode would come in direct contact with the electrolytes, the tot of theand battery. It is known that pure mixtures of electrolyte in MeCN can drycurves out easilygenerally [21,22] and, as a result, variations ulk of these materials were used in calculations [24]. The showed lengthy experiments are not possible. However, we decided against the use of higher boiling solvents heir shape and performance, on account of the batteries being made and assembled by hand. W or additives in order to avoid the addition of further parameters to the system and any side effects thatto might arise. Theworst fact thatand the discharge curves obtained were not completely herefore chose omit the best curves and instead select a smooth curveand to showed study that reflecte irregularities, especially at the end of the discharge, are most likely a result of the drying out of the
he average performance of the battery. It is known that pure mixtures of electrolyte in MeCN can dry out easily [21,22] and, as a resu engthy experiments are not possible. However, we decided against the use of higher boilin olvents or additives in order to avoid the addition of further parameters to the system and any sid
Materials 2016, 9, 965
10 of 16
electrolyte, however. Furthermore only the first discharge was investigated, as it was not possible to study multiple cycles using Mg metals due to the formation of an insoluble and dense MgF2 layer. Currently, no better anode material exists, however, which would avoid these complications with carrying out measurements, and research is ongoing to address this issue. Furthermore, it was not possible to study the properties of PEI and TEPA in these battery systems, as the compounds on their own were too reactive and destroyed the separators and we were unable to find an appropriate solvent system that did not result in coagulation of the materials. Therefore, no discharge could be observed. In965 general, all four of the electrolytes tested (PVAC-F, PVP-F, Malto-F and Xy-F) showed an open 10 of 15 Materials 2016, 9, circuit voltage (OCV) of 1.3 V–1.7 V, which is higher than that observed for the reported PEG-based electrolytes. OCV value was followed sharp drop in voltage, which seemed to be athe property be a property of theThis cathode material and notby ofathe electrolyte. Further tests in which carbon black of the cathode material and not of the electrolyte. Further tests in which the carbon black was replaced was replaced by carbon fibers did not show this large drop (see Supplementary Materials Figure S5). by carbon fibers did not show this large drop (see Supplementary Materials Figure S5). PVAC showed an OCV of about 1.71.7V,V,which is11VVbelow below theoretical OCV 2.7 PVAC showed an OCV of about which is thethe theoretical OCV of 2.7 Voffor theV for the system BiF 3 against Mg, and discharge plateau 0.7V.V. The discharge was smooth and system BiF3 against Mg, aand a discharge plateauat at about about 0.7 The discharge curvecurve was smooth and a total gravimetric capacity about120 120 mAh/g mAh/g (Figure 7). 7). showed showed a total gravimetric capacity of of about (Figure
Figure Figure 7. Discharge curves forfor the fluoride-doped polymer compounds. 7. Discharge curves thevarious various fluoride-doped polymer compounds.
Xy-F and Malto-F performed very similarly eachother, other, and furthermore, Malto-F the Xy-F and Malto-F performed very similarly to to each and furthermore, Malto-F showedshowed the highest discharge plateau all the polymersstudied studied with of about 1 V. PVP, with its with its highest discharge plateau of allofthe polymers witha avoltage voltage of about 1 V.even PVP, even high fluoride content, did not perform as well, however, with its discharge plateau at around 0.5 V, high fluoride content, did not perform as well, however, with its discharge plateau at around 0.5 V, and it only reached a capacity of about 40 mAh/g. and it only reached a capacity of about 40 mAh/g. Excluding PVP-F, all of these new electrolytes appeared to function slightly better than the known Excluding PVP-F, all ofTests these new electrolytes appeared to function better PEG-based electrolytes. on the anode of the batteries using scanning electronslightly microscopy (SEM)than the known and PEG-based electrolytes. Tests onthethe anodeof an of MgF the2 layer batteries EDX spectroscopy, however, showed formation and, forusing the Xy-Fscanning electrolyte, electron larger amount of C and O. Traces of Mg were also detected at the cathode. We therefore hypothesize microscopy (SEM) and EDX spectroscopy, however, showed the formation of an MgF2 layer and, for the sugar-based electrolytes were more susceptible to the formation of Mg2+ complexes at the the Xy-Fthat electrolyte, larger amount of C and O. Traces of Mg were also detected at the cathode. We anode [43], which may decompose at the anode or remain in the electrolyte (Figure 8). In the thereforecase hypothesize that the sugar-based electrolytes were more susceptible to the formation of that this issue with dissolution of the anode remains, even once a new anodic material is 2+ Mg complexes the anode [43], may decompose at theNevertheless, anode or remain in the electrolyte realized, aatprotection layer on which the anode would be necessary. these electrolytes, (Figure 8). In thethe case that thiselectrolytes, issue withoffer dissolution of approach the anode remains, even oncefluoride a new anodic especially sugar-based an interesting for future and sustainable battery applications. material is realized, a protection layer on the anode would be necessary. Nevertheless, these electrolytes, especially the sugar-based electrolytes, offer an interesting approach for future and sustainable fluoride battery applications.
therefore hypothesize that the sugar-based electrolytes were more susceptible to the formation of Mg2+ complexes at the anode [43], which may decompose at the anode or remain in the electrolyte (Figure 8). In the case that this issue with dissolution of the anode remains, even once a new anodic material is realized, a protection layer on the anode would be necessary. Nevertheless, these electrolytes, the sugar-based electrolytes, offer an interesting approach for future and Materials 2016, 9,especially 965 11 of 16 sustainable fluoride battery applications.
2+-based complexes with Xy-F in both the electrolyte and at the Figure 8. 8. Possible Possible formation formation of of Mg Mg2+ Figure -based complexes with Xy-F in both the electrolyte and at the anode surface, surface, which which could could cause cause issues issues with with the the battery battery performance. performance. anode
4. Materials and Methods 4.1. Materials The starting materials were purchased from VWR or Sigma-Aldrich and were not purified before syntheses. The syntheses were carried out under normal conditions in air. As a general procedure, the fluoride salt and polymer matrix were mixed in acetonitril (MeCN) and refluxed for several hours. NH4 F or NH4 F2 H are not typically soluble in MeCN, while some polymers showed only limited dissolution. Therefore, large excesses were used to ensure the best possible reaction outcomes. The unreacted compounds were filtered off at the end of the reactions. Infrared (IR) spectra were recorded on a Perkin Elmer Spectrum Two. Powder X-ray diffraction (PXRD) analyses were measured on a STOE Stadip-2 with a copper source in transmission mode. Nuclear magnetic resonance (NMR) spectra were recorder on a 400-MHz Bruker 300 Ultrashield, with 64 scans and from −100 to −280 ppm. Fluoride and conductivity measurements were performed on a Mettler Toledo Sven Excellence with the appropriate electrodes. Cyclic voltammograms were measured using a Dropsene y-400 with screen-printed electrodes, carbon as the working anode, silver as a pseudo-reference and silver as the center electrode. Test cells were made in standard Teflon swagelock-construction and in home-made multi cells, the measurement were performed on a ARBIN with a discharge current of 0.01 mA and cut-off voltage of 0.1 V. Cyclovoltammerty and linear sweep voltammetry measurement were performed on a yStat 400 Dropsense. To determine the conductivity of the samples, electrochemical impedance spectroscopy was performed with a potentiostat equipped with a frequency analyzer (PGSTAT302N from Metrohm Autolab, Utrecht, The Netherlands) and the corresponding software. A three-electrode cell was used. The working electrode was an indium-tin-oxide coated on a glass substrate, the counter electrode was a Pt mesh and the reference electrode was Ag wire. The cell geometry was the same for each sample. Spectra were recorded in a frequency range between 1 Hz and 106 Hz by applying a small signal VAC with an amplitude of 10 mV. 4.2. Experimental Section Synthesis of a F2 H− doped PVAC Matrix (PVAC-F): PVAC granules (2 g, 0.04 mmol, MW = 50,000 g/mol) and NH4 F (0.37 g massive excess, about 10 mmol) or NH4 F2 H (0.62 g, massive excess, about 10 mmol) were dissolved in MeCN (50 mL). The solution was stirred at 85 ◦ C for 5 h. After cooling down slowly, the mixture was stirred overnight
Materials 2016, 9, 965
12 of 16
at room temperature. A bright yellow clear solution was obtained and the solution was filtered to remove excess NH4 F/NH4 F2 H residues. The solvent was removed slowly under reduced pressure, until a pale yellow solid was obtained and the residue dried in a vacuum oven at 70 ◦ C or on a heating plate at 100 ◦ C in a glovebox. 19 F-NMR (CD CN): δ (ppm) = −151.64, −151.59 3 IR (cm−1 ) (from electrolyte): 2280 (m), 1730 (s), 1445 (w), 1375 (s), 1230 (s), 1125 (w), 1020 (s), 980 (m), 945 (w), 820 (w), 765 (w), 680 (w), 640 (m) Conductivity (100 mg in 4 mL MeCN): 229 µS/cm Synthesis of a F2 H− doped PVP Matrix (PVP-F): PVP (1.5 g, 0.037 mmol, MW = 40,000 g/mol) and NH4 F (0.37 g massive excess, about 10 mmol) or NH4 F2 H (0.62 g, massive excess, about 10 mmol) were dissolved in MeOH (40 mL). The solution was stirred at 85 ◦ C for 3 h. After cooling down slowly, the mixture was stirred overnight at room temperature. A pale yellow clear solution was obtained. For further preparation of the electrolyte, a portion of the reaction mixture (6 mL) was added to MeCN (20 mL). The mixture was refluxed at 100 ◦ C while stirring for at least 2 h. After cooling to room temperature, the solution was filtered and solvents were removed slowly under reduced pressure and the residue was dried in a vacuum oven at 70 ◦ C or on a heating plate at 100 ◦ C in a glovebox. 19 F-NMR (CD CN): δ (ppm) = −151.48, −151.43 3 IR (cm−1 ) (from residue): 2965 (w), 1660 (s), 1500 (w), 1465 (m), 1430 (s), 1375 (w), 1305 (w), 1285 (s), 1265 (s), 1230 (w), 1180 (w), 1070 (m), 875 (w), 840 (w), 730 (m), 660 (m), 570 (m), 490 (m) Conductivity (100 mg in 4 mL MeCN): 417 µS/cm Synthesis of an electrolyte based on TEPA with MeCN (TEPA-F): Direct mixing of NH4 F (0.3 g, 80 mmol) in liquid TEPA (1.5 mL, 10 mmol) produced, after 1 h, a thick gel-like substance, which was insoluble in common organic solvent and difficult to purify, therefore another approach was chosen for the synthesis of TEPA-F. TEPA (2 mL, 10 mmol) and NH4 F (0.1 g, 20 mmol) were dissolved in MeCN (20 mL). This suspension was heated to 90 ◦ C for 2 h. A crystalline, very hygroscopic precipitate was formed, which, after cooling of the reaction mixture to room temperature, could be removed by filtration. The removal of excess solvent led to the isolation of a pale yellow viscous residue. 19 F-NMR (CD CN): δ (ppm) = −121 3 IR (cm−1 ) (from residue): 3223 (broad), 3075 (w), 2964 (s), 2873 (m), 2667 (w), 2637 (w), 2543 (m), 2392 (w), 1190 (s), 1066 (broad), 803–703 (w, broad) Conductivity (0.1 g in 4 mL MeCN): 120 µS/cm (not completely soluble, a white precipitate formed) Synthesis of a F2 H− doped PEI Matrix (PEI-F): Ground NH4 F (0.2 g, massive excess, 54 mmol) dissolved in MeCN (10 mL) and branched PEI (2 mL, MW ≈ 800 g/mol, 2.5 mmol) in MeCN (30 mL) were combined. The mixture was heated to 100 ◦ C for 5 h, then cooled to room temperature. Subsequent filtering was necessary to remove unreacted NH4 F. After removing the solvent under reduced pressure, the milky solution became a clear yellow resinous liquid. Further drying at 80 ◦ C and 10 mbar pressure led to an almost solid residue. 19 F-NMR (CD CN): δ (ppm) = −106.5 (broad) 3 IR (cm−1 ) (from residue): 3250 (m), 2930 (w), 2840 (w), 2750 (s), 2250 (m), 1625 (w), 1570 (s), 1465 (s), 1360 (w), 1285 (s), 1110 (m), 1035 (m), 930 (w), 855 (w), 820 (w), 770 (w) Conductivity (100 mg in 4 mL MeCN): 176 µS/cm (forms a white precipitate, incomplete dissolution)
Materials 2016, 9, 965
13 of 16
Synthesis of a F2 H− doped Xylitol Matrix (Xy-F): Xylitol (1.5 g, 9.8 mmol) and NH4 F2 H (0.5 g, 80 mmol) were ground by mortar and pestle and added to MeCN (30 mL). The suspension was stirred and heated to 120 ◦ C for at least 2 h, over which time an almost clear solution was formed. After cooling to room temperature, the suspension was stirred overnight. After filtering, a white precipitate was obtained, which X-ray diffraction (XRD) analysis showed to be primarily unreacted starting materials. The liquid was evaporated under pressure and a white flaky powder obtained. 19 F-NMR (CD CN): δ (ppm) = −151.74, −151.69 3 IR (cm−1 ) (from residue): 3320 (s), 2930 (w), 1430 (s), 1300 (w), 1000 (s), 875 (w), 750 (m), 570 (w), 520 (m) Conductivity of the filtrate (100 mg in 4 mL MeCN): 5927 µS/cm Synthesis of a F2 H− doped Maltodextrin Matrix (Malto-F): Maltodextrin (1.2 g, 7 mmol) and NH4 F2 H (0.9 g, 15 mmol) were ground by mortar and pestle and added to MeCN (100 mL). The suspension was stirred and heated to reflux for at least 4 h. After cooling down to room temperature, a yellow-orange precipitate formed, which was removed by filtration. The precipitate was not soluble in MeCN. The filtrate was dried to obtain an off-white powder, which was readily soluble in MeCN and used for further analyses. 19 F-NMR of the filtrate (CD CN): δ (ppm) = −151.42, −151.46 3 Conductivity of precipitate (100 mg in 4 mL MeCN): 350 µS/cm (only slightly soluble) Conductivity Materials 2016, 9, 965 of filtrate: (≈80 mg in 4 mL MeCN): ≈6200 µS/cm (soluble) 13 of 15 4.3. NH NH33-Evolution -Evolution 4.3. It was NH be released during the reactions, in particular in the reaction 3 could It washypothesized hypothesizedthat that NH 3 could be released during the reactions, in particular in the of NH4 F of with groups reaction NHamine 4F with amine(Figure groups3). (Figure 3). The gas gas evolution evolution of of these these reactions reactions was was monitored monitored in in two two ways. ways. Initially, Initially, tests tests using using pH-paper pH-paper The showed that the simple stirring of NH F in the presence of TEPA or PEI released a basic gas 9). 4 showed that the simple stirring of NH 4F in the presence of TEPA or PEI released a (Figure basic gas A further9).test alsotest carried the gas released by gas-outlet into aqueous (Figure A was further was out, alsowhereby carried out, whereby thewas gaspassed released was passed byan gas-outlet solution of CuCl . During the reaction the color of this solution changed from colorless to deep blue into an aqueous2 solution of CuCl2. During the reaction the color of this solution changed from due to thetoformation of due [Cu(NH Materials 3 )4 ]Cl 2 upon the 3 . (See colorless deep blue to the formation of evolution [Cu(NH3)4of ]ClNH 2 upon theSupplementary evolution of NH 3. (See Figure S6). For the other reactions, NH gas evolution could be observed, but only over longer reaction 3 Supplementary Materials Figure S6). For the other reactions, NH3 gas evolution could be observed, times with heating. but only over longer reaction times with heating.
Figure 9. Simple NH3 detection test with pH paper. Figure 9. Simple NH3 detection test with pH paper.
5. Conclusions 5. Conclusions A range of polymers containing different functional groups was selected for use as the matrix A range of polymers containing different functional groups was selected for use as the matrix for for incorporation of fluoride and bifluoride anions using a variety of coordination motifs. Using a incorporation of fluoride and bifluoride anions using a variety of coordination motifs. Using a straightforward synthetic approach under mild conditions, ammonium fluoride or ammonium straightforward synthetic approach under mild conditions, ammonium fluoride or ammonium bifluoride were reacted with the five selected polymeric compounds. While the amine-containing polymer, PEI, and oligomer, TEPA, seemed to be directly protonated and could absorb pure fluoride ions, the other compounds consistently showed a transformation to the bifluoride ions. The fluoride quantity was measured using a work around strategy, since the current sensors employed cannot detect the bifluoride ion. For all compounds, characterizations were performed using IR and NMR spectroscopies, PXRD, CV, and conductivity measurements. A few selected compounds were also
Materials 2016, 9, 965
14 of 16
bifluoride were reacted with the five selected polymeric compounds. While the amine-containing polymer, PEI, and oligomer, TEPA, seemed to be directly protonated and could absorb pure fluoride ions, the other compounds consistently showed a transformation to the bifluoride ions. The fluoride quantity was measured using a work around strategy, since the current sensors employed cannot detect the bifluoride ion. For all compounds, characterizations were performed using IR and NMR spectroscopies, PXRD, CV, and conductivity measurements. A few selected compounds were also tested with impedance spectroscopy. The compounds prepared, excluding PEI and TEPA, which were too reactive, were prepared as electrolytes and used in preliminary room temperature fluoride ion battery tests. PVAC-F showed a long and smooth first discharge, and both saccharide-based electrolytes, Malto-F and Xy-F, showed a good discharge plateau. These materials are promising for further development in fluoride ion battery preparation and study. In summary, we propose a new matrix family for fluoride/bifluoride-containing electrolytes, and address the previously encountered issues of free fluoride chemistry in non-aqueous solvents. Supplementary Materials: The following are available online at www.mdpi.com/1996-1944/9/12/965/s1. Figure S1: Conductivity depending on solvent; Figure S2: PXRD of PVP-F (with remaining starting product, before it was recrystallized) and PVAC-F; Figure S3: EDX-analysis of different electrolytes after synthesis and purification; Figure S4: Cyclovoltagrams of the different electrolytes and MeCN as reference; Figure S5: Discharge curve using carbon fiber fabric; Figure S6: Evolution of ammonia. Acknowledgments: The authors would like to thank Daniel Sandbeck for help with the synthesis of the different compounds. We acknowledge support by Open Access Publishing Fund of Karlsruhe Institute of Technology. We also thank Maximilian Fichtner for his support. Author Contributions: Fabienne Gschwind conceived and designed the experiments, analyzed the data and wrote the paper. Dominik Steinle, Nico Bevilacqua and Laura Friedrich performed the experiments and routine measurements. Elizabeth von Hauff performed the data analysis of the impedance spectra. Conflicts of Interest: The authors declare no conflict of interest.
References 1. 2. 3. 4. 5. 6. 7. 8. 9. 10. 11. 12.
Smith, D.W.; Icon, S.T.; Iyer, S.S. Handbook of Fluoropolymer Science and Technology; John Wiley & Sons: Hoboken, NJ, USA, 2014. Yoshio, M.; Brodd, R.J.; Kozawaka, A. Lithium-Ion Batteries Science and Technology; Springer: New York, NY, USA, 2007. Choi, S.W.; Fu, Y.Z.; Ahn, Y.R.; Jo, S.M.; Manthiram, A. Nafion-impregnated electrospun polyvinylidene fluoride composite membranes for direct methanol fuel cells. J. Power Sources 2008, 180, 167–171. [CrossRef] Hermann, A.; Chaudhuri, T.; Spagnol, P. Bipolar plates for PEM fuel cells: A review. Int. J. Hydrogen Energy 2005, 30, 1297–1302. [CrossRef] Liang, S.; Xiao, K.; Mo, Y.; Huang, X. A novel ZnO nanoparticle blended polyvinylidene fluoride membrane for anti-irreversible fouling. J. Membr. Sci. 2012, 394–395, 184–192. [CrossRef] Hester, J. Design and performance of foul-resistant poly(vinylidene fluoride) membranes prepared in a single-step by surface segregation. J. Membr. Sci. 2002, 202, 119–135. [CrossRef] Olah, G.A.; Li, X.-Y.; Wang, Q.; Prakash, G.K.S. Poly-4-vinylpyridinium Poly(Hydrogen Fluoride): A Solid Hydrogen Fluoride Equivalent Reagent. Synthesis 1993, 1993, 693–699. [CrossRef] Olah, G.A.; Li, X.-Y. Poly-4-vinylpyridinium Poly(hydrogen fluoride): A Convenient Polymeric Fluorinating Agent. Synlett 1990, 1990, 267–269. [CrossRef] Kim, D.W.; Jeong, H.-J.; Lim, S.T.; Sohn, M.-H. Tetrabutylammonium Tetra(tert-Butyl Alcohol)-Coordinated Fluoride as a Facile Fluoride Source. Angew. Chem. Int. Ed. 2008, 47, 8404–8406. [CrossRef] [PubMed] Bosch, P.; Camps, F.; Chamorro, E.; Gasol, V.; Guerrero, A. Tetrahutylammonium Bifluoride: A versatile and efficient fluorinating agent. Tetrahedron Lett. 1987, 28, 4733–4736. [CrossRef] Furin, G.G. Synthetic aspects of the use of organosilicon compounds under nucleophilic catalysis conditions. Tetrahedron 1983, 44, 2675–2749. [CrossRef] Banks, R.E.; Mohialdin-Khaffaf, S.N.; Lal, G.S.; Sharif, I.; Syvret, R.G. 1-Alkyl-4-fluoro-1,4-diazoniabicyclo [2.2.2]octane salts: A novel family of electrophilic fluorinating agents. J. Chem. Soc. Chem. Commun. 1992, 595. [CrossRef]
Materials 2016, 9, 965
13.
14. 15. 16. 17. 18. 19. 20. 21. 22. 23. 24.
25. 26. 27. 28.
29. 30. 31. 32. 33. 34. 35. 36. 37.
15 of 16
Landini, D.; Maia, A.; Rampoldi, A. Dramatic effect of the specific solvation on the reactivity of quaternary ammonium fluorides and poly(hydrogen fluorides), (HF)n* F− , in media of low polarity. J. Org. Chem. 1989, 54, 328–332. [CrossRef] Zhou, Y.; Zhang, J.F.; Yoon, J. Fluorescence and Colorimetric Chemosensors for Fluoride-Ion Detection. Chem. Rev. 2014, 114, 5511–5571. [CrossRef] [PubMed] Hudnall, T.W.; Chiu, C.-W.; Gabbaï, F.P. Fluoride Ion Recognition by Chelating and Cationic Boranes. Acc. Chem. Res. 2009, 42, 388–397. [CrossRef] [PubMed] Cho, E.J.; Ryu, B.J.; Lee, Y.J.; Nam, K.C. Visible Colorimetric Fluoride Ion Sensors. Org. Lett. 2005, 7, 2607–2609. [CrossRef] [PubMed] Seppelt, K. Does the Naked Fluoride Ion Exist? Angew. Chem. Int. Ed. 1992, 31, 292–293. [CrossRef] Miller, J.M.; Clark, J.H. “Naked fluoride” masked: N.M.R. evidence for tight ion pairs in KF–crown ether. J. Chem. Soc. Chem. Commun. 1982, 1318–1319. [CrossRef] Kornath, A.; Neumann, F.; Oberhammer, H. Tetramethylphosphonium Fluoride: “Naked” Fluoride and Phosphorane. Inorg. Chem. 2003, 42, 2894–2901. [CrossRef] [PubMed] Emsley, J. Very strong hydrogen bonding. Chem. Soc. Rev. 1980, 9, 91–124. [CrossRef] Gschwind, F.; Zao-Karger, Z.; Fichtner, M. A fluoride-doped PEG matrix as an electrolyte for anion transportation in a room-temperature fluoride ion battery. J. Mater. Chem. A 2014, 2, 1214–1218. [CrossRef] Gschwind, F.; Bastien, J. Parametric investigation of room-temperature fluoride-ion batteries: Assessment of electrolytes, Mg-based anodes, and BiF3-cathodes. J. Mater. Chem. A 2015, 3, 5628–5634. [CrossRef] Anji Reddy, M.; Fichtner, M. Batteries based on fluoride shuttle. J. Mater. Chem. 2011, 21, 17059–17062. [CrossRef] Gschwind, F.; Rodriguez-Garcia, G.; Sandbeck, D.J.S.; Gross, A.; Weil, M.; Fichtner, M.; Hörmann, N. Fluoride ion batteries: Theoretical performance, safety, toxicity, and a combinatorial screening of new electrodes. J. Fluor. Chem. 2016, 182, 76–90. [CrossRef] Clark, J.H. Fluoride Ion as a Base in Organic Synthesis. Chem. Rev. 1980, 80, 429–452. [CrossRef] Dick, C.R.; Ham, G.E. Characterization of Polyethylenimine. J. Macromol. Sci. Part A—Chem. 1970, 4, 1301–1314. [CrossRef] Martin, J.S.; Fujiwara, F.Y. High Resolution Nuclear Magnetic Resonance Spectra of Bifluoride Ion and Its Homologues. Can. J. Chem. 1971, 49, 3071–3073. [CrossRef] Whittlesey, M.K.; Perutz, R.N.; Greener, B.; Moore, M.H. Synthesis, molecular structure and NMR spectroscopy of a transition-metal bifluoride complex: Formation via C–F activation or reaction with Et3 N·3HF. Chem. Commun. 1997, 187–188. [CrossRef] Gerken, M.; Boatz, J.A.; Kornath, A.; Haiges, R.; Schneider, S.; Schroer, T.; Christe, K.O. The NMR shifts are not a measure for the nakedness of the fluoride anion. J. Fluor. Chem. 2002, 116, 49–58. [CrossRef] Fluorine NMR Database. Available online: http://www.chem.wisc.edu/areas/reich/handouts/nmr/f-data. htm (accessed on 16 September 2016). Holland, B. The thermal degradation of poly(vinyl acetate) measured by thermal analysis–Fourier transform infrared spectroscopy. Polymer 2002, 43, 2207–2211. [CrossRef] Lakard, S.; Herlem, G.; Lakard, B.; Fahys, B. Theoretical study of the vibrational spectra of polyethylenimine and polypropylenimine. J. Mol. Struct. 2004, 685, 83–87. [CrossRef] Ibrahim, M.; Alaam, M.; El-Haes, H.; Jalbout, A.F.; de Leon, A. Analysis of the structure and vibrational spectra of glucose and fructose. Eclét. Quím. 2006, 31, 15–21. [CrossRef] Friestag, G.K.; Branchaud, B.P. Ammonium Tetrafluoroborate, Encyclopedia of Reagents for Organic Synthesis. EEROS 2001. [CrossRef] Schlemper, E.O.; Hamilton, W.C. On the Structure of Trigonal Ammonium Flourosilicate. J. Chem. Phys. 1966, 45, 408–409. [CrossRef] Linares, J.M.; Powell, D.; Bowman-James, K. Ammonium based anion receptors. Coord. Chem. Rev. 2003, 240, 57–75. [CrossRef] Kubo, Y.; Yamamoto, M.; Ikeda, M.; Takeuchi, M.; Shinkai, S.; Yamaguchi, S.; Tamao, K. A Colorimetric and Ratiometric Fluorescent Chemosensor with Three Emission Changes: Fluoride Ion Sensing by a Triarylborane—Porphyrin Conjugate. Angew. Chem. Int. Ed. 2003, 42, 2036–2040. [CrossRef] [PubMed]