Proceedings of the 4th Conference on Fog, Fog Collection and Dew (La Serena, Chile, 23-27 July 2007), pp. 311-314
Simulating and testing a very large dew and rain harvester in Panandhro (NW India) O. Clus1,2, G. Sharan2,3, S. Singh3, M. Muselli1,2, D. Beysens2,4,5 1
Université de Corse and CNRS UMR 6134, Route des Sanguinaires, 20000 Ajaccio (France). Email :
[email protected] International Organization for Dew Utilization, 60, rue Emeriau, 75015 Paris (France). Email :
[email protected] 3 Indian Institute of Management, IIM Campus, Vastrapur, Ahmedabad - 380 015 Gujarat Ahmedabad (India). Email :
[email protected] 4 ESEME, Service des Basses Températures, CEA-Grenoble, 17, rue des Martyrs, 38504 Grenoble Cedex 09 (France) 5 ESEME, Laboratoire de Physique et Mécanique des Milieux Hétérogènes, ESPCI et Universités Paris 6 et Paris 7, 10, rue Vauquelin, 75231 Paris Cedex 05 (France).Email :
[email protected] 2
ABSTRACT The arid coastal region of north-west India is chronically short of drinking water. It has significant dew resources which could be accessed for human use if cost-effective large harvest systems could be developed. Components of harvest systems include condensers, frames and water conveyance gear. Frames are nearly as expensive as condensers. One way to reduce costs is to build condensers on the ground, especially as vast low-fertility lands are available. A project is underway at Panandhro with this objective. Arrays of special ridge-and-trough condenser modules have been built on land that had previously been mined and back-filled. Ten modules are in place now, more are planned. Modules, each with 85 m2 surfaces, are placed side by side, providing 850 m2 surfaces. Four 1 m2 condenser-on- frame, installed in October ‘05 to assess resources, had indicated Panandhro as promising - cumulated dew water during 192 days as 12.6 mm. Using these results, the ridge-and-trough modules were designed. Ridges, each 35 m long, are built over gently sloping field. Ridge is trapezoidal (top 50 cm, base 200 cm, two sides sloping 30 degree from horizontal, height 100 cm), lined with 2.5 cm thick styrene foam with radiative foil (see Opur, www.opur.u-bordeaux.fr) on top. Fabrication procedure was manual for economy. Dew water is filtered and bottled; and used for drinking and providing critical watering to valuable plants. Actual output of the ten modules will be presented. Predicted output using Numerical simulations on Computational Fluid Dynamics (PHOENICS) software with Panandhro meteorological data will also be presented. The comparison will help tune the CFD model parameters for use as design tool.
1. INTRODUCTION In arid coastal area of Kutch there are large tracts of land that is not fertile. These lands can be used to produce dew water to supplement the drinking water supply of the area, if dew condensers could be installed over the ground. But using frames to mount the condenser surface was found to be infeasible on account of high cost. A comparison of framed and ground condensers has already been performed in Ajaccio (France) by Muselli et al. (2006??) that conclude to only a slight reduction in dew yield. Experiments were therefore carried out at Kothara to see if satisfactory yields could also be obtained from condensers placed directly on the ground. Pilot units were first made and installed at our Condenser Test Station at village Kothara. Units were 9 m2 modules, made of insulated plastic film, placed directly on sloping ground over a layer of styrene foam insulation. Yield was measured
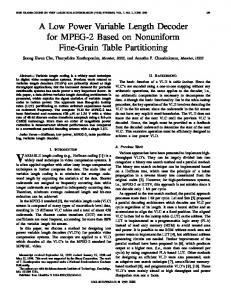
over a season and found to be less than similar condensers of 1 m2 surface placed on frames at the same site (Sharan 2006). But the reduction in yield was amply compensated by the reduction in costs. The condenser-on-ground (CoG for short) offered a cost-effective route to build large units over the waste lands in the area. An opportunity to do so came when a large mining company commissioned us to build a large unit on the mine grounds at Panandhro in Kutch very near the coast. The unit was completed in the first week of November ’06. 2. CONDENSER-ON-GROUND AT PANANDHRO The Dewrain system. Ten modules of the special ridge-and-trough CoGs are formed at the site (Fig. 1). Ridges, each 35 m long, are built over gently sloping ground. Ridge is trapezoidal (top 50 cm,
base 200 cm, two sides sloping 30 degree from horizontal, height 100 cm) and lined with 2.5 cm thick styrene foam with radiative foil of the type promoted by OPUR (2007). Modules were built on site manually. Each module has 85 m2 surface, the ten together 850 m2. Each module is connected to a common collection pipe at the lower end. The main storage is located in the middle. The storage tank has arrangement for withdrawal of water for use. A 1 cm diameter transparent rigid plastic tube is installed to show the level of water inside the storage. The tube is graduated along its height and calibrated to readily indicate the quantity of water inside in litres. Dew water yield – actual. All the ten modules became operational by November 8,’06. Daily readings and recording of dew yield of the previous night is done at eight in the morning. The water collection was as follows. Dew nights yield No (L) November (9-30) ’06 4 311 December, no measurements made due to the absence of personnel on site January ’07 3 221 February,07 17 1860 The peak yield was 240 litres on February 6. The water was chemically tested and found to be potable but slightly acidic (pH 4.5 ).
Fig. 1. Dew-rain harvest system at Panandhro
3. DEW WATER YIELD - SIMULATED There is no report of dew condensers of such large size, trapezoidal profile placed directly on the ground from any other part of the world. It was considered useful therefore to model the thermal behaviour of these modules and study their performance via simulation. This will help in optimizing these modules and improving the yields
in future. This has been done here using CFD and PHOENICS software.
3.1. Simulation background The goal of this numerical simulation is to determine the best condenser orientation with respect to the mean wind direction. For this purpose, the surface to air heat transfer coefficient is needed. It has been determined only for planar surfaces with laminar air flow (Nikolayev et al., 2001) and adding free convection (Jacobs et al., 2004). For more complex surfaces, a semi-empirical description is needed (Guyer and Brownell, 1999). Moreover, dew condensation occurs frequently with very weak wind and the free and forced (wind) convections are of comparable order of magnitude. The relation between a 10 m meteorological wind and the local flow velocity tangential to a surface making a variable angle α (°) with horizontal has already been simulated by Beysens et al., 2003. The main rain result is concerned with the tangential velocity that is found minimum when α = 30°. ENICS Computational Fluid Dynamics (CFD) software have been developed as a complementary tool (Clus et al., 2006ab). Physical objects are placed in a framed space (see e.g. Fig. 2). Thermodynamic parameters are initialized for each cell centre and faces of the box. The radiative cooling power is added as input for each radiator elementary cell and a wind profile is given as inlet of a face of the box. The main contribution of CFD is to solve the system by including the materials properties, radiative cooling and convective (free and forced) heating by way of iterative calculation using the numerical code. Finally, numerical simulation gives the values fields of each interesting variable (Pressure P; Temperature T; fluid 3D velocity Vx, Vy, Vz), in steady state and according to defined inlet values. All calculations have been carried out for reasonable weather conditions during nocturnal dew events: clear sky, Ta = 288.15 K (15 °C) and RH = 80%. These conditions correspond to a dew point temperature Td = 11.8 °C. New condenser shapes can be implemented outdoors after optimizing the parameters in virtual reality. Simulations also enable the effect of scale change to be estimated from mock ups to real scale.
3.2. Results The Panandhro site has been modeled in 3 dimensions according to Fig. 2. Only 3 identical
ridges have been integrated in order to limit the number of elementary cells. The results to be analyzed are collected only on the central ridge.
Fig. 2. Sketch of the modeled condenser composed of three 35 m ridges long on a 40 m long and 15° tilted hip slope. Three wind directions have been tested, perpendicularly to the hip edge and from the back of the ridge (“back” wind on Fig. 2), perpendicularly to the hip edge and in front of the ridge (“front” wind, Fig. 2) and an intermediate case where the wind makes a 30° angle with the hip edge (wind “30°” left, Fig. 2). Airflows. In Fig. 3 is reported the result of simulations at various wind speeds and wind configurations (front wind, back wind, 30° wind). The flow velocity is averaged along the ridge length at a point that is situated in the middle of the ridge and at 0.25 m above the bottom. The amplitude of the natural convection is evidenced for V10 → 0. The value = 0.85 m/s obtained for V10 = 0.1 m/s is representative of this limit. In the back wind case, the lowering of air flow velocity at large wind speed can be understood as the effect of the vortex above the hip that counterbalances the free convection, in a way similar to the inclined plane case (Beysens et al., 2003). The 30° wind configuration gives the same results as back wind’s. However, for V10 < 1 m/s, the lateral wind convection compressing on the facing side reinforces the natural convection. The front wind configuration leads naturally to an increase of proportionally to wind speeds for V10 > 1 m/s, when free convection becomes negligible. At low wind speed (V10 < 1 m/s), free convection flows counterbalances the natural wind resulting in a paradoxical decrease of the airflow velocity. Looking now at the mean wind speed (1.5 m/s) where dew is observed on the 1 m2 plane
condensers, back wind and 30° wind configurations exhibit nearly the same flow velocity, close to free convection, in marked contrast with the air flow in the front wind arrangement.
Fig. 3. Airflow velocity in the middle of the ridge at 0.25 m above the bottom, with respect to wind speed V10. The data are absolutes values averaged over the ridge length. Front wind: open triangles; back wind: black triangles; 30° wind: bent black triangles. The line corresponds to the mean wind speed during the dew events (1.5 m/s) as recorded at the meteorological station situated 2 Km SE of the site. Cooling. Let us now discuss the condenser temperature averaged on the whole ridge. The relative efficiency of cooling factor or “temperature gain” ∆T0 obtained by numerical simulations can be defined (Beysens et al., 2003) for various orientations of the system:
∆T0 =
Tc − Ta TRe f − Ta
(1)
Here Ta = 15°C and TRef stands for the mean condenser temperature when wind is simulated coming from back. In Fig. 4 are plotted the results concerning the temperature gain variation in relation with wind direction. The cooling efficiency logically shows the same characteristics as discussed with the air flows (Fig. 3) and three regions can be distinguished: (i) V10 = 0. The values have been calculated by extrapolating ∆T0 to zero wind speed from the simulations at V10 = 0.1 m/s and. It is manifest that all wind configurations give the same result as heat exchange is there only due to natural convection, (mean velocity V0.25 = 0.85 m/s, see above). (ii) V10 ≥ 1.5 m/s. Natural convection becomes negligible with respect to the atmospheric wind and then surface cooling becomes roughly proportional to wind speed (not reported). The 30° wind and the
front wind configurations give nearly the same temperature gain. However, cooling in the back wind configuration is notably more efficient as the wind speed is reduced on the ridges. (iii) 0 < V10 ≤ 1 m/s. The atmospheric wind speed is on order of the natural convection (≈ 0.85 m/s, as noted above). Cooling depends crucially on the exact wind configuration. The behavior for the 30° wind configuration exhibits an accident. Cooling is less efficient between 0.5 and 1 m/s, a result that can be understood by the lateral entrance all along the 3 simulated ridges of air at ambient temperature. This effect would be lowered if the full condenser (10 ridges) would have been simulated. In the case of the back wind configuration, natural convection and atmospheric wind flow in the same direction, air is cooled in flowing on one ridge from top to bottom. A paradoxical result is found for the front wind configuration where cooling is larger than for zero wind speed. As noted above, in this particular arrangement, the natural convection flows in the opposite direction to the atmospheric wind, thus reducing the air flows and increasing cooling.
Fig. 4. Simulated temperature gain (see Eq. 1) with respect to back wind configuration. Front wind: open triangles; 30° wind: black triangles. CONCLUDING REMARKS The temperature gain ∆T0 is well correlated with the dew yield (Clus et al., 2006b). It therefore appears that back wind is the most favorable orientation for enhancing dew yields. The orientation of the dew plant was therefore performed close to 213° (average wind direction weighted with the measured yield). Such arrangement should increase the dew yields from 10 to 20 % for wind speeds larger than 1 m/s. This first large scale dew and rain harvest system has already proved to deliver an interesting amount of water. A rough estimation givers a delivery price of bottled water close to 6 rps/L, what corresponds
to only 60 % of the actual price on local market. The condenser in Panandro will be extended and a second system is actually in construction nearby in Kutch district (Satapar).
ACKNOWLEDGEMENT. The initiative to get this system built at the Panandhro site was taken by Dr Dinesh Mishra, Manager (Environments) of Gujarat Mineral Development Corporation. Mr. VK Srivastava, Mr. Ali Ahmed of the Environment Division of GMDC actively participated in construction and contributed useful ideas in the course of implementation. Mr. Owen Clus worked at this site for three months when the work started. Mr. Shashank Singh was part of the field team. REFERENCES Beysens, D., Milimouk, I., Nikolayev, V., Muselli, M. and Marcillat, J. (2003).Using radiative cooling to condense atmospheric vapour: A study to improve water yield. J. of Hydrology., 276, 111. Clus, O., Muselli, M., Beysens, D., Nikolayev, V., Ouazzani, J., (2006a) Computational Fluid Dynamic (CFD) Applied to Radiative Cooled Dew Condensers. Proceedings of the 5th IEEE Int. Symposium on Environment Identities and Mediterranean area, Corte (France) Clus, O., Ouazzani, J., Muselli, M., Nikolayev, V., Sharan, G., Beysens, D., (2006b) Radiationcooled Dew Water Condensers studied by Computational Fluid Dynamic (CFD). 2006 Europ. PHOENICS User Meeting, Wimbledon (www.cham.co.uk/brochures.asp) Guyer, Eric C., Brownell, David L., (1999) Handbook of Applied Thermal Design, 1 edition. Pub. Taylor and Francis. Book, 600p Jacobs, A.F.G., Heusinkveld, B.G., Berkowicz, S., (2004) Dew and Fog Collection in a Grassland Area, The Netherlands. Proceedings: Third International Conference on Fog, Fog Collection and Dew, Cape Town, South Africa Muselli, M., Beysens, D. and Milimouk, I. (2006) A comparative study of two large radiative dew water condensers. Journal of Arid Environments 64, 54–76. OPUR (2007) www.opur.u-bordeaux.fr Nikolayev, V.S., Beysens, D., Muselli, M., (2001) A computer model for assessing dew/frost surface deposition. Proceedings of the Second International Conference on Fog and Fog Collection, St John’s (Canada) Sharan, G. (2006). Dew Harvest, Foundation Books, and New Delhi pp.107.