Simulation of Nitrate-Nitrogen Dynamics for Cropping Systems with Different Rooting Depths Jorge A. Delgado,* Ronald F. Follett, and Marvin J. Shaffer sults in predicting residual soil NO3⫺–N (Shaffer et al., 1991; Follett et al., 1994; Shaffer et al., 1995). These researchers used the previous 1.10 version of NLEAP that was capable of simulating the effect of management practices on RSN for the root zone of the simulated crop. Additionally, NLEAP 1.10 conducted simulations for the rooting zone of a crop, entered to the nearest 0.30-m increment, (e.g., 0.30, 0.61, 0.91, 1.22, or 1.52 m). For crops such as potato, with maximum rooting depths of 0 to 0.40 m, NLEAP 1.10 capabilities are to simulate the rooting zone to 0 to 0.30 or 0 to 0.61 m. By having a 0.30-m resolution, the simulations of N and water budgets with the previous 1.10 version were either overor underestimated. Since NLEAP 1.10 is not capable of simulating rotations on a similar soil depth for crops with different rooting zones such as lettuce (0–0.37 m) and spring wheat (Triticum aestivum L.) (0–0.84 m), a new version, 1.20, was developed (Delgado et al., 1998). With the previous NLEAP 1.10, simulations would have been conducted for lettuce at 0 to 0.30 m and for spring wheat at 0 to 0.91 m. Comparisons on the effects of BMPs on RSN for these systems must be conducted for the root zone of each crop and for a similar soil depth for the agricultural system. NLEAP 1.20 can simulate RSN for the root zone and RSN from the bottom of the rooting depth (BRD) to a maximum soil depth desired that can be a similar soil depth for the agricultural system. This maximum soil depth can be set from a minimum of 0.3 m to a maximum of 1.5 m, by 0.03-m increments. It also could be set to be equal to the BRD of the crop with the deepest rooting system in the rotation. This new capability is important for NLEAP simulation of the NO3⫺–N dynamics in these agricultural systems. For example, the NO3⫺–N that is below the root zone of the lettuce crop (0.37–0.91 m), although not assessable for lettuce, can be scavenged by the spring wheat, which has a deeper rooting zone (0–0.84 m). This is why simulation on a similar soil depth must be conducted when evaluating the effect of management practices on RSN. Additionally, NLEAP 1.20 was improved to simulate maximum rooting depth to the nearest 0.03 m from a minimum root depth of 0.30 m to a maximum of 1.52 m. This new 1.20 version can simulate lettuce and spring wheat root zone. It can also simulate below the root zone of lettuce (0.37–0.91 m) and the spring wheat (0–0.84 m). Since most agricultural systems include rotations that have crops with different rooting depths, this new version of NLEAP is an improvement and needs to be validated and calibrated for these cropping systems. This
ABSTRACT Most agricultural systems in the San Luis Valley of south-central Colorado include rotations that have crops with different rooting depths. The previous version of Nitrate Leaching and Economic Analysis Package (NLEAP), 1.10, was only capable of simulating the effect of management practices on the rooting zone of each crop to the nearest 0.30-m increment. Therefore, a new version of NLEAP was needed to simulate the effect of best management practices (BMPs) on residual soil NO3⫺–N (RSN) for the root zone of each crop grown in the region and for a similar soil depth for these systems (e.g., 0–0.91 m). The improved NLEAP version 1.20 simulates maximum rooting depth to the nearest 0.03 m and RSN in multiple soil depths. These new features allowed us to simulate the effect of BMPs on RSN for the root zones of shallower-rooted crops such as lettuce (Lactuca sativa L.) (0–0.37 m), potato (Solanum tuberosum L.) (0–0.40 m), and deeper-rooted crops such as small grains (0–0.61 to 0–0.84 m). NLEAP simulated RSN for a soil depth identical for all of these cropping systems (0–0.91 m) (P ⬍ 0.001). This new version can be used by extension agents, farmers, consultants, and others to evaluate the effect of BMPs on soil NO3⫺–N dynamics for different rooting zones and for similar soil depths in the agricultural system, a capability that was not available with the previous version of NLEAP.
T
here is potential to use new computer models as technology transfer tools to assess the impacts of agricultural practices on residual soil NO3⫺–N (RSN) that is available to leach. The Nitrate Leaching and Economic Analysis Package (NLEAP) permits a rapid site-specific evaluation of a series of best N and irrigation management practices for a farmer’s field (Shaffer et al., 1991). To simulate different management scenarios and their effects on residual soil NO3⫺–N, NLEAP uses a regional configuration file that contains crop N uptake indices and other plant and soil parameters. The planting and harvesting dates, water management inputs and timing, soil and climate information, and measured crop yields need to be supplied. Development of the model is presented in more detail in Shaffer et al. (1991). Khakural and Robert (1993) and Beckie et al. (1994) reported that the NLEAP 1.10 model has been found to perform similarly in predicting residual soil NO3⫺–N, water content in the rooting zone, and NO3⫺–N leaching to other models such as Crop Estimation through Resource and Environment Synthesis (CERES; Ritchie et al., 1985), the Erosion/Productivity Impact Calculator (EPIC; Williams et al., 1983), the Nitrogen Tillage Residue Management (Shaffer and Larson, 1987), and LEACHM-N (Wagenet and Hutson, 1989). Other researchers have also obtained similar reJorge A. Delgado and Ronald F. Follett, USDA-ARS, Soil Plant Nutrient Research Unit, Federal Bldg., P.O. Box E, 301 S. Howes, Fort Collins, CO 80522; Marvin J. Shaffer, USDA-ARS, Great Plains Systems Research, Fort Collins, CO 80522. *Corresponding author (
[email protected]).
Abbreviations: BMPs, best management practices; BRD, bottom of the root depth; NLEAP, Nitrate Leaching and Economic Analysis Package; RSN, residual soil NO3⫺; SLVWQDP, San Luis Valley Water Quality Demonstration Project.
Published in Soil Sci. Soc. Am. J. 64:1050–1054 (2000).
1050
DELGADO ET AL.: SIMULATION OF NITRATE-NITROGEN DYNAMICS FOR CROPPING SYSTEMS
1051
Table 1. San Luis Valley soil type used for NLEAP simulations. Soil series Gunbarrel Kerber McGinty Mosca Norte San Arcacio San Luis
Surface texture
Family or higher taxonomic class
Loamy sand Loamy sand Sandy loam Loamy sand Gravelly sandy loam Sandy loam Sandy loam
Mixed, frigid Typic Psammaquents Coarse-loamy, mixed, frigid Aquic Natrargids Coarse-loamy, mixed, frigid Typic Calciorthids Coarse-loamy, mixed, frigid Typic Natrargids Loamy-skeletal, mixed (calcareous), frigid Aquic Ustorthents Fine-loamy over sandy or sandy-skeletal, mixed, frigid Typic Haplargids Fine-loamy over sandy or sandy-skeletal, mixed, frigid Aquic Natrargids
study presents the results of a technology transfer effort conducted by the USDA-ARS and the San Luis Valley Water Quality Demonstration Project (SLVWQDP). From 1992 to 1998 the needed information was collected at 14 cooperators’ farms where a combination of 36 fields and management scenarios were studied. The objective of this technology transfer effort was the development of management information to test and evaluate the capability of NLEAP to simulate BMPs effects on RSN for these cropping systems. MATERIALS AND METHODS Field Sites Our studies were conducted throughout the San Luis Valley of south-central Colorado in fields where the recommended best management practices were implemented (SLVWQDP, 1999). Some of the BMPs applied at these sites were (i) that N fertilizer rates were based on results from laboratory analysis of soil, plant tissue, and irrigation; (ii) that fertilizer N applications for potato and lettuce were split into preplant,
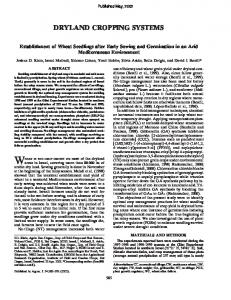
Fig. 1. Observed and NLEAP-simulated (a) available water in the root zone at harvest on a hectare basis and (b) residual soil NO3⫺–N in the root zone. Calibration of the NLEAP 1.20 version for potato (P), lettuce (L), barley (B), and canola (CN) grown in the San Luis Valley.
sidedressing, and fertigation; (iii) that all preplant and side dressing N fertilizer applications were banded; and (iv) that no fall application for spring-planted crops was conducted. Additional information about BMPs used in this region can be found in the best management practices for nutrient and irrigation management in the San Luis Valley (SLVWQDP, 1999). Twelve fields were randomly selected for calibration and 12 for validation. Additionally, 12 fields were used for technology transfer. For each validation and calibration site, four plots 20.9 m2 each were established under a center-pivot irrigation sprinkler. Two transponders were placed permanently so that soils could be sampled at the same site during the spring and fall. Soil, plant samples, and crop yields were collected for each plot. For the 12 technology transfer fields, farmer yield data from the entire center-pivot irrigation sprinkler area (54.7 ha) were used.
Plant and Soil Samples Plant samples for small grain, potato, and lettuce were collected by harvesting 0.4 m2 in each plot. Potato vines, roots, and tubers were collected prior to farmers harvesting their fields. For the whole fields, spring wheat samples were collected. The mean root depth was measured for all crops by
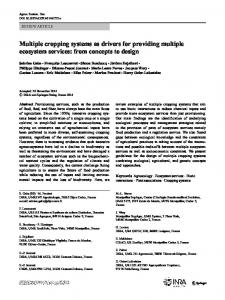
Fig. 2. Observed and NLEAP-simulated residual soil NO3⫺–N (a) from the bottom of the root depth (BRD) to the maximum soil depth (BRD - 0.91 m) and (b) for the entire soil depth (0.0–0.91 m). Calibration of the NLEAP 1.20 version for potato (P), lettuce (L), barley (B), and canola (CN) grown in the San Luis Valley.
1052
SOIL SCI. SOC. AM. J., VOL. 64, MAY–JUNE 2000
Fig. 3. Observed and NLEAP-simulated (a) available water in the root zone at harvest on a hectare basis (b) and residual soil NO3⫺–N in the root zone. Validation of the NLEAP 1.20 version for potato (P), lettuce (L), barley (B), and canola (CN) grown in the San Luis Valley.
digging a hole at each site and measuring root depth. The mean root depth was measured for barley (Hordeum vulgare L.) (0–0.61 m); canola (Brassica napus L.) (0–0.76 m); lettuce (0–0.37 m); potato (0–0.40 m); and spring wheat (0–0.84 m). Soil samples were collected in each 20.9-m2 plot in spring before planting and in the fall after harvesting. Twenty randomly located soil cores were composited for the initial and final soil samples at the whole field sites. For initial and final samples, soils were sampled in 0.30-m intervals down to 0.91 m. Initial soil measurements included: percentage of coarse fragments by weight and by volume, percentage organic matter, pH, cation-exchange capacity, and water content. Available soil water at harvesting was measured at about one-third of the randomly selected sites. Soil samples collected from each 0.30-m depth increment were air dried and sieved through a 2-mm sieve. The percentage by weight of the coarse fragments was used to calculate the percentage of coarse fragments by volume (Delgado et al., 1999). Bulk densities were estimated from texture as described by the USDA-SCS (1988). Sieved samples were extracted with 2 M KCl and the NO3⫺–N and NH4⫹–N were colorimetrically determined by automated flow injection analysis. Plant samples were dried at 55⬚C, ground, and analyzed for total C and N content by automated combustion using a Carlo Erba automated C–N analyzer (Carlo Erba, Milan, Italy). Soil types where NLEAP simulations were conducted are described in Table 1.
Climate Data and Management Practices Climatic data from the Center, CO weather station in the San Luis Valley were collected. Rain and snow amounts were measured locally during the growing season at all sites. The
Fig. 4. Observed and NLEAP-simulated residual soil NO3⫺–N (a) from the bottom of the root depth (BRD) to the maximum soil depth (BRD - 0.91 m) and (b) for the entire soil depth (0.0–0.91 m). Validation of the NLEAP 1.20 version for potato (P), lettuce (L), barley (B), and canola (CN) grown in the San Luis Valley.
modified Jensen-Haise method was used to calculate potential evapotranspiration (Etp) used in NLEAP (Follett et al., 1973; Jensen et al., 1990). Irrigation, N fertilizer application, planting, harvesting, cultivation, and other agricultural management practices were collected at all sites. The average N fertilizer application by crop was 213, 297, 106, 234, and 33 kg N ha⫺1 for potato, lettuce, canola, spring wheat, and barley. Center-pivot sprinklers were calibrated for accuracy, and irrigation water samples were collected three times during the growing season and analyzed for NO3⫺–N.
NLEAP 1.20 Inputs Crop planting and harvesting dates; N, water, and cultural management inputs and timing; soil and climate information; and yield were collected at the plot for the calibration and validation or for the entire center-pivot area. All N additions such as initial NO3⫺–N content of the soil, amount and type of N fertilizer added, amount of N in the irrigation water, and crop residue mass and its N content were collected at each site and entered into the model. Potato, barley, lettuce, canola, and wheat data collected for the calibration were used to develop a “region.idx” file. This region.idx file was then used with the validation and technology transfer sites.
NLEAP 1.20 Outputs The NLEAP 1.20 was used to simulate the effects of crop management on residual soil NO3⫺–N in a 0- to 0.91-m soil depth and available soil water in the root zone. The initial soil NO3⫺–N for spring of each growing season was entered and the model simulated the residual soil NO3⫺–N for the three
DELGADO ET AL.: SIMULATION OF NITRATE-NITROGEN DYNAMICS FOR CROPPING SYSTEMS
Fig. 5. Observed and NLEAP-simulated (a) available water in the root zone at harvest on a hectare basis and (b) residual soil NO3⫺–N in the root zone. Technology transfer of the NLEAP 1.20 version for potato (P), lettuce (L), barley (B), and spring wheat (SW) grown in the San Luis Valley.
soil layers within the 0- to 0.91-m soil depth of these cropping systems. Simulated NO3⫺–N for the root zone, bottom of the root zone to the 0.91-m depth, and the whole soil depth (0–0.91 m) were compared with the observed values.
Statistical Analyses Correlations were made between predicted and observed available soil water using SAS REG (SAS Inst., 1988). The SAS REG procedure was also used for correlation between predicted and observed residual soil NO3⫺–N. For these analyses, intercept (b0) and slope (b1) were tested with SAS REG for differences from 0 and 1, respectively.
RESULTS AND DISCUSSION The new NLEAP 1.20 version accurately simulated the available soil water for the root zone of these crops (0-BRD, Fig. 1a, P ⬍ 0.001). The residual soil NO3⫺–N in the root zone of potato, lettuce, and small grains were also accurately simulated (Fig. 1b, P ⬍ 0.001). The model simulated RSN below the root zone to the baseline soil depth of 0.91 m (Fig. 2a, P ⬍ 0.001) and for the whole soil depth 0 to 0.91 m (Fig. 2b, P ⬍ 0.001). The new version was able to simulate the RSN across different soil depths of the validation data set (Fig. 3 and 4, P ⬍ 0.001). For these analyses, b0 and b1 were not significantly different from zero and one, respectively, for the calibration and validation data sets (P ⬍ 0.001). Our results agreed with results from Shaffer
1053
Fig. 6. Observed and NLEAP simulated residual soil NO3⫺–N (a) from the bottom of the root depth (BRD) to the maximum soil depth (BRD - 0.91 m) and (b) for the entire soil depth (0.0–0.91 m). Technology transfer of the NLEAP 1.20 version for potato (P), lettuce (L), barley (B), and spring wheat (SW) grown in the San Luis Valley.
et al. (1991), Khakural and Robert (1993), Beckie et al. (1994), Follett et al. (1994), and Shaffer et al. (1995). This study presents the first NLEAP calibration and validation where BMPs are simulated on a similar baseline soil depth for multiple crops with different rooting depths. This new capability of simulating the effects of BMPs on RSN in the root zone and below the root zones of lettuce (0–0.37 m), potato (0–0.40 m), canola (0–0.76 m), barley (0–0.61 m), and spring wheat (0–0.84 m) improves the capabilities and potential for using the model as a technology transfer tool to evaluate the agricultural systems. By using this new version the model can be used to compare how BMPs affect RSN on a similar depth for different rooting crops in a rotation. Although with the technology transfer sites the whole center-pivot irrigation sprinkler field was used for the simulations, NLEAP still predicted available soil water for the root zone and RSN for multiple soil depths (Fig. 5 and 6, P ⬍ 0.001). The b0 and b1 were not significantly different from zero and one, respectively (P ⬍ 0.001). With the technology transfer data set, the r 2 values were lower than for the calibration and validation simulations. This suggests that by having more precise information with the plot design the model simulations will be more accurate than when whole fields are simulated with farmers’ information. However, with the technology transfer simulations of the whole field (54.7 ha) circle, NLEAP 1.20 was capable of simulating the available soil water and RSN (P ⬍ 0.001).
1054
SOIL SCI. SOC. AM. J., VOL. 64, MAY–JUNE 2000
CONCLUSIONS
REFERENCES
This was the first NLEAP calibration and validation for potato, lettuce, canola, spring wheat, and barley conducted on a similar soil depth and the first calibration and validation of NLEAP that simulates NO3⫺–N dynamics below the rooting zone of shallower-rooted crops that are grown in a rotation. We validated a new concept of using NLEAP simulations of BMPs for crops with different rooting depths (e.g., barley–potato or lettuce–potato–barley). This new version will allow the use of NLEAP to evaluate the effect of BMPs on RSN on the basis of a similar depth for different possible rotations of potato, lettuce, canola, spring wheat, and barley. Since deeper-rooted crops can scavenge residual soil NO3⫺–N that is not available to shallower rooted crops, this is an important new capability that can be applied to evaluations of the effects of BMPs on cropping systems. The new NLEAP 1.20 version simulated the effect of BMPs on RSN for the root zone of shallow- and deeprooted crops, and for the soil depth of the agroecosystem (0–0.91 m). NLEAP 1.20 allows users to evaluate the effects of BMPs on RSN for crop rotations across different agroecosystems. NLEAP 1.20 was demonstrated to be a useful tool in evaluating the effect of BMPs on RSN and transport of NO3⫺–N from and out of the root zone of these cropping systems. This technology transfer effort shows that extension agents, farmers, consultants, and others can use NLEAP 1.20 as a technology transfer tool to evaluate NO3⫺–N dynamics for cropping systems and to compare them on similar soil depths, a capability that was not available with the previous 1.10 version of NLEAP.
Beckie, H.J., A.P. Moulin, C.A. Campbell, and S.A. Brandt. 1994. Testing effectiveness of four simulation models for estimating nitrates and water in two soils. Can. J. Soil Sci. 74:135–143. Delgado, J.A., M.J. Shaffer, and M.K. Brodahl. 1998. New NLEAP for shallow and deep rooted crop rotations. J. Soil Water Conserv. 53:338–340. Delgado, J.A., R.T. Sparks, R.F. Follett, J.L. Sharkoff, and R.R. Riggenbach. 1999. Use of winter cover crops to conserve soil and water quality in the San Luis Valley of South Central Colorado. p. 125–142. In R. Lal (ed.) Soil quality and soil erosion. CRC Press, Boca Raton, FL. Follett, R.F., G.A. Reichman, E.J. Doering, and L.C. Benz. 1973. A nomograph for estimating evapotranspiration. J. Soil Water Conserv. 28:90–92. Follett, R.F., M.J. Shaffer, M.K. Brodahl, and G.A. Reichman. 1994. NLEAP simulation of residual soil nitrate for irrigated and non irrigated corn. J. Soil Water Conserv. 49:375–382. Jensen, M.E., R.D. Burman, and R.G. Allen (ed.) 1990. Evapotranspiration and irrigation water requirements. ASCE Manuals and Reports on Engineering Practice no. 70. American Society of Civil Engineers, New York. Khakural, B.R., and P.C. Robert. 1993. Soil nitrate leaching potential indices: Using a simulation model as a screening system. J. Environ. Qual. 22:839–845. Ritchie, J.T., D.C. Godwin, and S. Otter–Nacke. 1985. CERES Wheat. A simulation model of wheat growth and development. Texas A&M Univ. Press, College Station. San Luis Valley Water Quality Demonstration Project (SLVWQDP). 1999. Best management practices for nutrient and irrigation management in the San Luis Valley. Colorado State Univ. Coop. Ext., Fort Collins. SAS Institute. 1988. SAS/STAT user’s guide. Ver 6.03. 3rd ed. SAS Inst., Cary, NC. Shafer, M.J., A.D. Halvorson, and F.J. Pierce. 1991. Nitrate Leaching and Economic Analysis Package (NLEAP): Model description and application. p. 285–322. In R.F. Follett et al. (ed.) Managing nitrogen for groundwater quality and farm profitability. SSSA, Madison, WI. Shaffer, M.J., and W.E. Larson. 1987. NTRM, a soil-crop simulation model for nitrogen, tillage, and crop residue management. USDAARS Conserv. Res. Rep. 34-1. Shaffer, M.J., B.K. Wylie, and M.D. Hall. 1995. Identification and mitigation of nitrate leaching hot spots using NLEAP-GIS technology. J. Contam. Hydrol. 20:253–263. USDA-SCS. 1988. National agronomy manual. 2nd ed. U.S. Gov. Print. Office, Washington, DC. Wagenet, R.J., and J.L. Hutson. 1989. LEACHM: Leaching Estimation and Chemistry Model—A process based model of water and solute movement, transformations, plant uptake and chemical reactions in the unsaturated zone. Continuum Vol. 2. Water Resour. Inst., Cornell Univ., Ithaca, NY. Williams, J.R., P.T. Dyke, and C.A. Jones. 1983. EPIC—A model for assessing the effects of erosion on soil productivity. p. 555–572. In W.K. Lauenrroth et al. (ed.) Proc. of the Third Int. Conf. on State of the Art in Ecol. Modeling. Colorado State Univ. 24–28 May 1982. Elsevier Scientific, New York.
ACKNOWLEDGMENTS The authors thank Mr. Jacob Czeke, Mr. David Wright, Ms. Anita Kear, Dr. William O’Deen, Ms. Mebrat Gesese, Mr. Andrew Neuhart, Mr. Michael Golinski, Mr. Robert Lober, and Mr. Kevin Lee for their capable assistance during collection and analysis of soil and plant samples; Mr. Donald “Smokey” Barker for his coordination of activities of USDA/ NRCS and USDA/NRCS/SLVWQDP personnel in this project; to the San Luis Valley Water Quality Demonstration Project (SLVWQDP) personnel Mr. Ronald Riggenbach and Mr. Randy Ristau, and especially Mr. James Sharkoff who collected the root depth and management information; Mr. Merlin Dillon from Colorado State University Cooperative Extension Service; and to USDA-NRCS personnel, especially Mr. Lawrence Kawanabe, Mr. Richard Sparks, Ms. Linda Warsh, and Ms. Norma VanNostrand for coordinating study activities with local producers.