simulator capable of providing results for analysis and possibilities to optimize ... and optimize the engineering of signalling systems, using the Hamlet tool. ..... seeks out possible interferences with train progress) also assists in the search for.
Computers in Railways XIII
61
Simulation system for the optimization of a block distribution under the ERTMS-1 signalling system M. Soler, J. López & J. M. Mera CITEF, Railway Technology Research Centre of the Universidad Politécnica de Madrid, Madrid, Spain
Abstract Execution of the design of the signalling belonging to a railway system must take various aspects into consideration, given that all factors are interconnected. The infrastructure to be implemented must also take into account the capacity of the trains to provide the desired service, and hence to comply with expectations in the headway calculated in order to meet passenger demand. An analysis of such systems on real platforms is highly costly, one solution being first to develop simulators which can work independently and which offer reliable results in line with reality. The Hamlet tool developed at Citef (Railway Technology Research Centre of the Universidad Politécnica de Madrid – UPM) is intended as a simulator capable of providing results for analysis and possibilities to optimize aspects of the infrastructure studied. This paper outlines in specific terms the techniques developed and validated for analysis of compliance with headways in operating plans and strategies for the optimization of the block distribution of lines for the purpose of improving this headway. In order to evaluate properly the developed tool and techniques, it has been analyzed a real line operated using ERTMS level 1 signalling system. Keywords: ERTMS-1, Movement Authority (MA), release speed, signalling, headway, interlocking.
1 Introduction Designs intended for engineering projects must take many factors and the relationship and dependencies which exist among them into consideration. Designs intended to create Railway Engineering projects are no exception; more WIT Transactions on The Built Environment, Vol 127, © 2012 WIT Press www.witpress.com, ISSN 1743-3509 (on-line) doi:10.2495/CR120061
62 Computers in Railways XIII specifically, those intended to create or modify railway installations must take into account factors such as energy calculation, civil engineering, signalling and safety, with the clearly defined aim of providing potential users with a service in terms of volume of passengers, travel times, frequencies and entry/exit locations. Access to a reliable simulation tool which can assist the engineer in his design and analysis task is one of the challenges now faced in order to make such designs increasingly reliable, ensure that they share more characteristics with the real system, that the testing of various issues can be integrated, and naturally to ensure that the tool is ultimately capable of providing optimum designs in design areas. The above premise addresses the need to have a tool in place which incorporates all the challenges raised, this being the idea behind the generation of the Hamlet tool (‘Herramienta Avanzada Multidisciplinar para Líneas Eléctricas de Trenes’, or ‘Advanced Multidisciplinary Tool for Electric Train Lines’). Railway simulators are fairly widespread, both those based on an overriding corporate need and those generated at universities, taking advantage of research possibilities. As a precursor to Hamlet, the SEE (‘Simulador de Explotaciones Eléctricas’ or ‘Electrical Operations Simulator’) [1] was developed. It can analyze operational plans and electrical calculations, for both AC and DC, and ultimately succeeded in generating a reliable and fairly flexible simulator for the analysis of infrastructure, proposed time grids and the robustness of the proposed energy system in order to cover traffic data. The work undertaken on this software evolved over time into questions and an approach to different focuses on the integration of a comprehensive railway engineering tool. As a result, having established the baseline for the idea marking the launch of the project, the next step is to focus on the proposed system in order to validate and optimize the engineering of signalling systems, using the Hamlet tool. In [2] the authors raise the importance of having a support system for engineers in the signalling area, and thus refer to a tool and method (JACK) which would help validate the interlockings which can be installed in railway systems. Both this work and all the work intended to analyze and/or optimize railway systems, require that the simulation core must function correctly and be sufficiently validated. This core means that they can simulate the motion forces which will be employed by the trains, basic signalling elements (track circuits, signals, points, etc.). Within the context of this specific study, simulator development working groups face the problem that it is extremely difficult to obtain one uniform method which can handle any type of signalling system on any line. Researchers focus on dealing with specific problems, and so specialize and obtain results which serve to advance optimization systems. Analyzing the various techniques, Chang and Du [3], accepting the complexity of the task of optimizing the quantity of track circuits and points, propose a system based on genetic algorithms, dividing the section between stations into 3 zones. In two of these (critical and constraint sections) the objective modeled by the fitness function is the ability to balance the circuit quantities and lengths, as they hold that any modification would alter the defined headway. However, the intermediate
WIT Transactions on The Built Environment, Vol 127, © 2012 WIT Press www.witpress.com, ISSN 1743-3509 (on-line)
Computers in Railways XIII
63
section (or stretchable section) would have a margin for improvement, and the algorithm could therefore establish variations to the original design, and so obtain an improved design. Another group by Citef, González et al. [4], proposed an algorithm to evaluate the conditions related with the signalling system and once analyzed, using genetic algorithms, is able to improve the configuration taking into account the headway or even enhancing the quantity of track circuits and signals. Chang et al. [5] approach the problem by proposing a different approach. On the basis of the ITMS tool, they devised an optimization for the ATO system based on fuzzy logic, and also deal with the re-sizing of track circuits and how this affects the performance levels of operations between stations. Ho et al. [6] provide a tool capable of simulating the key characteristics of a railway system, detailing in their article the complexities with which they were required to work, and furthermore explaining their focus and motivations in generating an analysis and optimization system for railway signalling systems. The alternative proposed through the use of Hamlet is the versatility offered by the integration of the various modules (infrastructure, train performance, operational plans, traffic, electrification, signalling systems), and more specifically the ability to interact with the program in order to improve railway line signalling designs. In this case the system chosen is ERTMS-1, the train safety-related characteristics of which were implemented in the simulator, which therefore refers to balises, signals, track circuits, points. Aside from this, it proved necessary to devise a results analysis methodology which could easily detect blackspots which would prevent operations from fulfilling expectations, thus making it possible to calculate possible changes to rectify these errors. It should be pointed out that the technology employed in programming Hamlet was object-oriented programming using VC++ on a Windows platform, while scripts were created in Matlab for results analysis. The key characteristics of Hamlet and the methodology and process serving to optimize lines which have ERTMS-1 systems installed will be explained in the following section.
2 Tools and methodology The method for validation and optimization of the engineering of an ERTMS-1 railway signalling system is integrated within the Citef Hamlet project. One of the objectives to be achieved by means of this tool is successful integration of analysis and optimization for various railway disciplines. Naturally, when one fully embarks on engineering projects as complex as railways systems are, the first factor to be taken into consideration is the need to combine and link up within one single tool the greatest possible volume of constituent sub-systems, in this case the analysis of railway lines. Based on this approach, the different modules integrated within Hamlet will be listed, along with the basic capacities and characteristics of each. Finally, it should be stressed that the Hamlet program architecture was programmed using VC++, an object-oriented language.
WIT Transactions on The Built Environment, Vol 127, © 2012 WIT Press www.witpress.com, ISSN 1743-3509 (on-line)
64 Computers in Railways XIII
Figure 1:
Modules and main skills of Hamlet.
2.1 Hamlet tool 2.1.1 Infrastructure This is the supporting structure on which the railway lines will be positioned. The approach is thus that any configuration and elements for the geometry of a railway line must be exportable into Hamlet by means of all the capacities provided by the infrastructure. The basic formation for the infrastructure would comprise sections and nodes. Each node would represent the location at which the tracks position points for track crossovers. Using this configuration core, one has the ability to insert within it the inherent elements involved in the implementation of signalling systems, such as track circuits, signals, points.. 2.1.2 Train For simulation of the rolling stock, Davis Formulae have been studied and employed, giving as the final function the balance between motive and resistance forces. Bearing in mind the target function to be employed, which is general for any type of train, the other aspect which must be generalized involves the configuration data, which must be common to any type of rolling stock, and thus allow for the simulation of a range of trains: metro, local or high-speed. Hamlet fulfils this principle, and tests have been performed with different types of train. 2.1.3 Electrics The electrical algorithm and model is devised in order to be able to simulate with any type of configuration, either direct or alternating current, and for local/metro or high-speed lines respectively. The module is thus equipped to divide the line into the electrical sections into which the actual line is divided, and naturally the electrical algorithm has integrated functions which can include elements such as neutral zones, autotransformers, traction substations, overhead power line crosssection, etc.
WIT Transactions on The Built Environment, Vol 127, © 2012 WIT Press www.witpress.com, ISSN 1743-3509 (on-line)
Computers in Railways XIII
Figure 2:
Example current calculations.
Figure 3:
65
Example voltage calculations.
2.1.4 Signalling Given the different levels of signalling which exist, the plan has been gradually to introduce these levels in accordance with the difficulty and the needs of the results and analyses desired. Clearly, the basic aspects of a signalling system were integrated from the outset, such as for example track circuits, signals, points, interlocking simulation, balises. 2.2 Modeling ERTMS-1 system In specific terms, for the ERTMS-1 level it was necessary to plan how to transfer the basic characteristics which would allow for an analysis of a line with this level of signalling. ERTMS balises, how to simulate the Movement Authority, block distribution and the exchange of information with trains in order correctly to calculate the accelerations/decelerations required at any given time. Movement Authority (MA); this is the information of distance and speed the train is allowed to move, is determined based on the train position and calculating the distance to the first closed signal, taking into account the actual route of the train. To determine the aspects of the signals involved, a interlocking system is simulated, on which every paths needed for the whole possible routes in the line has been introduced. Each path is managed by one signal and changes its state depending on the conditions of the occupation of the tracks inside the corresponding path. Each time train is over an ERTMS-balise, calculates its Movement Authority and the balise communicates the result. Another element that has been taking into account in the simulator has been Release speed. This speed is activated in case the train is stopped in front of the signal that changes into a proceed aspect, and would allow the train to run until the next ERTMS-balise using this specific speed, so receive a new MA.
WIT Transactions on The Built Environment, Vol 127, © 2012 WIT Press www.witpress.com, ISSN 1743-3509 (on-line)
66 Computers in Railways XIII 2.3 Analysis and adjustment of headways Launching simulations using Hamlet provides a series of data serving to reach conclusions with a view to analyzing the performance of the line and subsequently establishing alternative solutions or improvements. The Matlab program has been used to handle and process the results obtained by Hamlet. The tool’s matrix calculus potential made it possible to create different scripts which served to analyze the following, having collated data from the simulations: 2.3.1 Circulation grids Space-time diagram. The route of the trains is clearly detailed, revealing the stops and the distance between them. This is particularly useful in the headway verification process, as it clearly identifies that one train has interfered with another, as a distinction is made in the following train between different zones in its trajectory, where the line is distorted. At these points it is highly likely that there would be a headway disturbance.
Figure 4:
Example circulation grid.
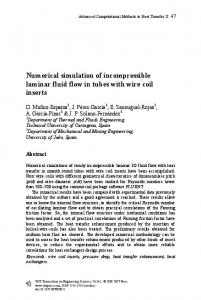
2.3.2 Speed diagrams Space-speed diagram. This monitors the trains along the line route, indicating at all times the speed at which they are traveling. The approach in order to detect a possible line hold-up is to observe the trajectory described by both the first train and the one following it. If the braking curve of the second train at any point diverts from the train in front (normally this will be earlier), this will mean that the first train has interfered in the progress of the second, and the headway will therefore have increased. This figure also makes it very simple to establish the points of conflict. 2.3.3 Block train diagram Space-time diagram with block representation. One can use the same graph to examine the space-time diagram for a circulation arrangement and how this would evolve following the headway, by superimposing these on the blocks and kilometer point occupied on the line. Another trajectory is finally added, indicating the reference position to calculate the braking curve on the part of the following train. This is fundamental in establishing the misalignment which occurs in the headway and where this happens, before devising a potential WIT Transactions on The Built Environment, Vol 127, © 2012 WIT Press www.witpress.com, ISSN 1743-3509 (on-line)
Computers in Railways XIII
67
solution. As will be demonstrated subsequently in the tests performed, it is clear that this is a highly illustrative and powerful approach in validating and optimizing the block distribution of a railway line. The three abovementioned methods provide rapid detection and analysis of the potential of the line to comply with the established headway and also provides the zone where action will be required in order to address the misalignments which arise. The last step is either to confirm that the block distribution is appropriate or otherwise make the necessary adjustment to those zones where imbalances have been discovered. As a result, the endpoint of the description of the algorithm or steps employed in the fine-tuning process involves the strategies taken into consideration in resizing in accordance with the block distribution of the affected zone: 2.3.3.1 Shorten block length This alternative arises when the circuit is of such a length that the first train spends a considerable time circulating along it and consequently the signal associated with the block will remain at red, and the second train does not have sufficient margin to reach the signal at green, in accordance with the braking curve. By shortening the length, the first train leaves the circuit earlier, freeing up the block, and the signal then changes to green allowing the following train to continue without having to brake. 2.3.3.2 Distribution of blocks This action generates a shorter distance at the front train allowing it to leave the block, and thus frees up the signal controlling it, leaving the block free for the following train. This option is naturally more expensive than the preceding one. 2.3.3.3 Introduction of new signals This last solution model would be associated with the previous one. In order for distribution to be effective, it must be associated with a new signal at the exit from the block. The result is that the following trains are not limited by the curve at the previous signal but rather the new signal, which relaxes the curve and gives greater margin.
3 Outcomes Having reached the point at which the entire approach, methodology and simulator have been tested, the initial phase for this type of simulator is to seek out a railway system for which complete similarity between the factors to be simulated and the actual design can be established. In this study the results obtained in a project undertaken by Citef for an actual line at the planning stage will be presented. The railway system is a tunnel shared by local and longdistance traffic. The infrastructure would contain 2 tracks with ERTMS-1 signalling, which should provide an operating headway of 120 seconds. One of the key analyses required in this project is to observe the performance of the proposed signalling system, comparing the headway and the desired operational plan. The study of this requirement is employed in the test case. This means first WIT Transactions on The Built Environment, Vol 127, © 2012 WIT Press www.witpress.com, ISSN 1743-3509 (on-line)
68 Computers in Railways XIII analyzing the initial design and subsequently, on the basis of the results and the methodology described, gradually improving the design until it ultimately complies with the key requirement, that the established headway should be fulfilled. The description of the basic elements involved in the test simulations would begin with the type of train selected. As mentioned earlier, the line was devised for both local and high-speed train traffic to run on it. For these tests the train type was standardized, as this does not affect the ultimate objective and development of the tests. The selected train has the basic characteristics associated with a high-speed train. The simulator is capable of acquiring all relevant train characteristics, such as length and weights, aerodynamic coefficients and resistances, accelerations/decelerations and traction and braking curves, among others. As for the line, it should be stated that for the test section it comprises 2 tracks with 5 stations. Lastly, the operational plan established for the tests is the analysis of a scenario in which the trains are required to achieve a headway of 120 seconds. Each station stop is 45 seconds. The departure and arrival points of the trains will be positioned at locations before and after the first and last stations respectively. 3.1 Test scenario 3.1.1 E Station–A Station, with trains every 2 minutes This operation contains 2 direct direction trains, departing with a separation of 2 minutes from E station, stopping for 45 seconds at the aforementioned stations and terminating at A station. Continuing with the process explained above, and once all the elements required in order properly to simulate the specific line have been configured, the simulation begins in order to obtain the initial results for circulation of the two trains: An initial examination reveals that the second train finds its progress interrupted at practically all the stations, a clear indication that there are signals preventing it from proceeding with the desired headway, forcing the train to brake and thereby increasing the headway. The resolution algorithm sets out certain steps, the most important being that there must be an adjustment to the block distribution in order to fulfill the desired headway in the circulation order, as the previous changes affect the rest of the line, and hence train circulation. The explanation involves selection of the adjustments applied to correct the section containing the E and C stations, which both provide good examples of how the algorithm functions. 3.1.1.1 E Station The initially proposed blocks and signalling layout for the circulation in question is presented in the following diagram: The incident which occurs at the station is analyzed, the impact which the first train has on the second, as it can be seen on the focused part in figure 5.
WIT Transactions on The Built Environment, Vol 127, © 2012 WIT Press www.witpress.com, ISSN 1743-3509 (on-line)
Computers in Railways XIII
Figure 5:
69
Initial examination of two consecutive trains by the line.
Figure 6:
Proposed and signalling layout in E station.
The block occupation study, with the help of the forward positioner (which seeks out possible interferences with train progress) also assists in the search for incompatibilities in terms of fulfilling the headway. It is clear that when the second train is approaching the station, the line situation in front forces it to break in order to comply with the signalling, and this action therefore causes a delay to the train. As may be seen more clearly in this other figure, and as described in the methodology, this is performed by superimposing the train-blocks and using the aforementioned Matlab script: Using the projection represented with the line representing the second train, is clear this train would reach the same block where is stopped the first train, before it leaves. Due to this situation, second train will be forced to break and causing an increment in the headway. The aim is to eliminate this occupation by altering the signalling element conditions.
WIT Transactions on The Built Environment, Vol 127, © 2012 WIT Press www.witpress.com, ISSN 1743-3509 (on-line)
70 Computers in Railways XIII
Figure 7:
Train-blocks in E station.
The possibilities offered by the tool mean that any modification to the scenario configurations is simple and adaptable to change, meaning that the difficulty lies in establishing how to partition the blocks prior to the station in order to rectify this shortcoming. Following an initial analysis, we find that the block containing the station (AT108) has sufficient margin to be divided into 2, with a new signal being inserted at the point of entry. The expectation is that with this change, the first train will depart the block containing the station more quickly, thereby making it highly likely that it will no longer interfere with the second train. And indeed, as may be seen in the following figure, the first train does not interfere with the second and the headway thus remains constant.
Figure 8:
Speed diagram with fixed headway.
WIT Transactions on The Built Environment, Vol 127, © 2012 WIT Press www.witpress.com, ISSN 1743-3509 (on-line)
Computers in Railways XIII
71
Following the example and focused on the problems located in E station, was fixed using speed curves graphs. Figure 5 shows a clear interference in the trip of the second train produced by the first, appears a difference in the curves of each other. The first action taken was to add a signal right at the end point of the E platform, in order to ensure that the train departs earlier and the preceding signal allows the second train to start up earlier. However, this proved insufficient, demanding further analysis of the line and the graphs. The solution which was found was to introduce a signal into the block, and more specifically to divide critical block practically into two. As there is block sub-distribution, this automatically allows the trains to travel closer together without interfering with the headway. Relaunching the simulation reveals that the imprecision has been corrected, and the line thus complies with the 120-second requirement up to this point.
4 Conclusions The proposed methodology has been extensively analyzed on various tests with actual lines implemented using signalling systems for control and safety, in this case ERTMS-1. In addition, with the software tool on which the simulations are tested the various modules have been examined, verifying their validity and the similarity with the actual performance of the components they represent, in terms of geometry, rolling stock, operational plan/traffic and, in this case, the given signalling system. The three techniques to validate the headway with the proposed block distribution proved effective, as they are swiftly obtained once simulation has been completed with Hamlet, are quickly analyzed, both in order to inspect correct behavior or reveal incorrect behavior, and, furthermore, are fully compatible with one another, thereby guaranteeing the means to focus on the error dictating the headway deviation. With the support of the tests illustrated, it has been established that the proposed strategies to resolve the misalignments caused by block distribution in traffic provide solutions which redress the misalignments and thus are useful in adjusting the desired headways. Meanwhile, in more challenging cases it is possible that several of these may need to be combined in order to resolve the conflict, without this having negative effects on concurrent strategy. Subsequent research and improvements further exploring this line of work will play a fundamental role in establishing the interaction of the various modules, introducing a greater range of signalling systems, and hence versatility, while research is also ongoing into the introduction of optimization systems, multi-objective evolution strategies, in order to allow the user to analyze designs or even propose designs on the basis of initial objectives and configurations, thereby allowing the system to evaluate them as a whole and offer alternative improvements in accordance with different objectives, for example their budgetary cost or environmental impact.
WIT Transactions on The Built Environment, Vol 127, © 2012 WIT Press www.witpress.com, ISSN 1743-3509 (on-line)
72 Computers in Railways XIII
References [1] J.Sanz.Bobi, F.Jorreto, J.Garzón. A simulation tool for sizing electrical railway lines. Proceedings of JRCICE2007. 2007 ASME/IEEE Joint Rail Conference & Internal Combustion Engine Spring Technical Conference. March 13-16 2007, Pueblo, Colorado, USA. ISBN 0-7918-3795-5. [2] Cinzia Bernadeschi, Alessandro Fantechi, Stefania Gnesi, Salvatore Larosa, Giorgio Mongardi, Dario Romano. A formal verification environment for railway signalling system design. Formal Methods in System Design, 12, 139-161 (1998). [3] C.S. Chang, D. Du. Improved optimization method using genetic algorithms for mass transit signalling block-layout design. Electric Power Applications, IEEE Proceedings, May 1998. [4] J. González, C. Rodríguez, J. Blanquer, J.M. Mera, E. Castellote, R. Santos. Increase of metro line capacity by optimisation of track circuit length and location: In a distance to go system. J. Adv. Transp. 2010; 44:1-19. [5] CS Chang, CS Chua, HB Quek, X.Y. Xu, SL Ho. Development of train movement simulator for analysis and optimization of railway systems. Developments in Mass Transit Systems, 1998. International Conference on (Conf. Publ. No. 453). [6] T.K. Ho, B.H. Mao, Z.Z. Yuan, H.D. Liu, Y.F. Fung. Computer simulation and modeling in railway applications. Computer Physics Communications 143 (2002) 1-10.
WIT Transactions on The Built Environment, Vol 127, © 2012 WIT Press www.witpress.com, ISSN 1743-3509 (on-line)