Brian E. Goodlin, Herbert H. Sawin, Duane S. Boning. MIT ... D. Montgomery, Introduction to Statistical Quality ... 3-D representation of fault detection space.
Simultaneous Fault Detection and Identification for Plasma Etching Processes Brian E. Goodlin, Herbert H. Sawin, Duane S. Boning MIT 77 Mass. Ave., 66-219 Cambridge, MA 02139 Barry M. Wise Eigenvector Research, Inc. 830 Wapato Lake Rd. Manson, WA 98831 State-of-the-art plasma processes are often pushed to the limits of the current technology, resulting in processes that have little or no margin for error. Increasingly, there is a need for fast, accurate, and sensitive detection and identification of equipment and process faults to maintain high process yields in manufacturing. In this work, we present an approach that simultaneously combines fault detection and classification together. Our algorithm uses linear discriminant analysis [1] methods to train for specific kinds of faults, e.g. a leaky mass flow controller. We can then monitor a small number of fault detection control charts, which are expressly set up to determine whether a specific fault has occurred or not. It can be shown that this approach provides higher sensitivity to specific kinds of faults than other multivariate approaches such as T2, while detecting and classifying them simultaneously. We will review an example set of data and describe the performance of the new approach and compare it to other multivariate approaches. This work is an extension of the multivariate endpoint detection approach that will be discussed in another talk at this symposium, based on [2].
(see Figure 2). Unfortunately, the Hotelling’s T2 approach to fault detection also has several weaknesses. First, once the data is mapped to the 1-D T2 control chart, all information regarding the location of faults in the fault detection space is lost. The second problem is that while T2 can be sensitive to general kinds of faults, it does not have the highest sensitivity to specific types of faults. The addition of noisy or repetitive measurements can drastically reduce the sensitivity of T2, particularly when a large number of process parameters are utilized. Our linear discriminant based fault detection algorithm provides a special mapping of the multivariate space to a 1-D direction that maximizes the ability to see a specific fault. This direction is simply a linear combination of the original process variables, so it is easy to create a univariate SPC chart for it. For each fault that commonly occurs, a separate chart is created that maximizes the ability to see that particular fault. This leads to higher sensitivity to faults than T2 as well as simultaneous detection and classification of these faults. References 1. P. Lachenbruch, Discriminant Analysis, 1975. 2. B. Goodlin, Ph.D. Thesis, MIT, 2002 (not yet published). 3. R. Bunkofske, AEC/APC Symposium XIII, Banff, Canada, 2001. 4. B. Wise, N. Gallagher, S. Butler, D. White, G.G. Barna, Journal of Chemometrics, 13, 379-96, 1999. 5. D. Montgomery, Introduction to Statistical Quality Control, 3d. Edition, 1997.
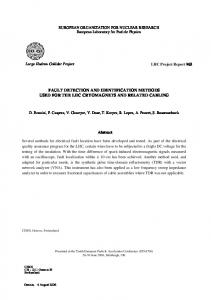
Until recently, most faults were detected by monitoring statistical process control (SPC) charts on certain output parameters such as etch rate or critical dimension. When a process was deemed out of control, the process and equipment engineers were then put to the task of trying to identify the source of the problem. More recently, large amounts of processing data are being stored and can be brought up to help the engineer to identify faults. In some cases, companies have begun to combine some of these machine and process data into multivariate statistics, such as Hotelling’s T2, for the detection of faults as well [3-4]. In this work, we analyze existing approaches to multivariate fault detection and identification for process and machine faults in simple terms that a process engineer can understand. For example, we can describe the machine fault detection space as shown in Figure 1, where each axis shown represents a particular process or machine variable being monitored. For each wafer (lot) collected, data are plotted in this multivariable space and can generally bounded by some hyperellipse in the total fault detection space. Process engineers are used to viewing faults from SPC charts along a single dimension, so the multivariate picture is typically mapped into a 1-D space which we can view. The most common approach is to calculate an appropriately weighted distance measurement, such as Hotelling’s T2 [5]. If we assume that the data are approximately multivariate normal distributed, then we can set appropriate limits on a control chart. In many cases, the Hotelling’s T2 can be shown to have sensitivity to faults that would ordinarily not be detected on individual SPC charts for machine parameters
Figure 1. 3-D representation of fault detection space. Normal process is bounded by an ellipse; faults lie outside of the normal operating region.
Figure 2. Example comparing mapping of 2-D multivariate data to T2, shows that T2 can pick up faults that the univariate charts cannot. x1 and x2 are arbitrary machine process variables.