Nature of adsorbed species during the reduction of CrO3/SiO2 with CO In situ FTIR spectroscopie study Abdelhamid Bensalem,*f Bert M. Weckhuysen and Robert A. Schoonheydt Centrum voor Oppervlaktechemie en Katalyse, Departement Interfasechemie, K.U. Leuven, Kardinaal Mercierlaan 92, B-3001 Heverlee, Belgium
In situ FTIR spectra of adsorbed CO on CrO3/SiO2 catalysts have been investigated at elevated temperatures to elucidate the nature of the species formed during the reduction process with CO. The results show the formation of three species: bicarbonates, monodentate carbonate and inorganic carboxylate. The reduction of CrO3/SiO2, which occurs through the formation of surface bicarbonate and carboxylate compounds, starts near 100°C.
1
Introduction
Chromium(vi) supported on silica is one of the most studied and controversal catalytic systems used industrially for production of polyethylene.1 Phillips catalysts (Cr/SiO2) are well known but some basic questions are still unresolved. One area of disagreement centers on the valence state of the active chromium center. Hexavalent chromium does not catalyze the polymerization of ethylene2 and the active oxidation state of Cr/SiO2 during industrial production of polyethylene is achieved through a reduction procedure, but details remain unknown. Among the different approaches used to produce reduced chromium oxides supported on silica thermal reduction with CO is convenient. CO reduction of Cr/SiO2 catalysts results in the formation of traces of Cr 5+ as well as Cr 3+ and Cr 2+ , their relative proportion depending on the reduction temperature and time.3 Three types of Cr" ions have been found (A, B and C), having two, three and four oxygen ligands, respectively, so that the ability to coordinate additional ligands is in the order A > B > C.4 Although CO adsorbed on Cr/SiO2 has previously been extensively studied by spectroscopy,4"14 all previous work was focussed on the oxidation state and coordination environment of chromium after CO reduction. No data on the mechanism of reduction of Cr 6+ are available in the literature. Indeed, the IR spectra were taken at room temperature and focussed on the carbonyl region (2300-1800 cm"1). The aim of this work is to throw some light on the nature of the species formed during the reduction process of CrO3/SiO2 with CO. This has been done by performing in situ IR investigations of adsorbed CO in the region 1800-1200 cm"1, during thermal heating of Cr/SiO2 in CO from room temperature to 400 °C. The adsorption of CO at elevated temperatures was also followed as a function of time.
2
Experimental
A CrO3/SiO2 catalyst was prepared by impregnating silica (Candea, surface area = 800 m2 g" ') with an aqueous solution of chromium(vi) trioxide (CrO3). An amount of solution equal to the pore volume (1.2 ml g"1), was mixed with the support under continuous stiring. The Cr content, determined by ion coupled plasma (ICP) analysis, was 0.5 wt.%. Pellets of comt Present address: Laboratoire de Chimie des Matériaux Divisés et Catalyse, Université Paris 7, 2 place jussieu 75251 Paris cedex 05, France. E-mail:
[email protected]
pressed powder ( κ 20 mg cm ~ 2 ) were introduced in the IR cell and activated following a procedure consisting of a treatment at 400 °C in O2 flow for 2 h and then in He flow for 1 h. In situ IR measurements were recorded on a Nicolet 730 FTIR spectrophotometer using a home-made cell connected with an evacuation-gas manipulation system. This conventional cell with CaF2 windows and a furnace is applicable for in situ thermal treatments to ca. 400 °C. The temperature was controlled by an electronically steered heating system and circulating tap water cooled the CaF2 windows. The temperature was measured to an accuracy of ± 3 °C. 100 scans were collected in the wavenumber range 4000400 cm" 1 (resolution = 4 cm"1). An IR spectrum obtained under He flow was used as the background to which the spectrum, after treatment by CO, was ratioed. We should note here that we have also carried out preliminary experiments in the diffuse reflectance mode using a commercial DRIFT cell from Spectratech, which offers the possibility of in situ pretreatments up to 550°C. However, DRIFT experiments are difficult to obtain with low Cr loaded samples, and only those performed on samples with loading >4 wt.% present exploitable data. Since the industrial catalysts have a Cr loading close to 0.5 wt.%, we preferred to perform our experiments in the transmission mode using a conventional cell. We also found that in experiments carried out at different temperatures on the support the silica does not adsorb CO under our experimental conditions. 3
Results
3.1 Adsorbed species formed during the reduction of Cr/SiO2 with CO
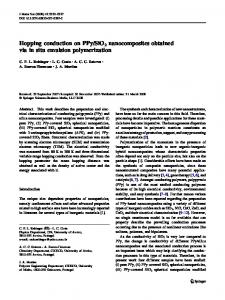
At room temperature, the interaction of CO with CrO3/SiO2, calcined and evacuated at 673 K, shows no IR bands due to adsorbed CO. Introduction of CO at 100°C immediately gives three strong bands at 1642, 1584 and 1443 cm" 1 and three weak bands at 1227, 1385 and 1371 cm" 1 , (Fig. 1). All these bands grow quickly with time and after 25 min six distinct peaks are visible. In order to distinguish the different species contributing to the IR spectrum the variation of the five most important bands with CO adsorption time is presented in Fig. 2 with the 1584 cm" 1 band taken as the reference. The bands at 1584 and 1385 cm" 1 grow at the same rate; hence their intensity ratios remain the same. The relative intensities of the bands at 1227, 1642 and 1443 cm" 1 show the same behavior. They all decrease in a similar manner with increasing adsorption time. J. Chem. Soc., Faraday Trans., 1997, 93(22), 4065-4069
4065
1587 0.15
25 min 20 min
1371
14 min 11 min 4 min
0.00
1800
1600 1400 wavenumber/cm "
1200
0.00
1800
1700
1600
1500
1300
1400
1200
wavenumber/crrr1
Fig. l In situ FTIR spectra of the adsorbed species following CO reduction of 0.5% Cr/SiO2 at 100 °C
Fig. 4 In situ FTIR spectra of the adsorbed species following CO reduction of 0.5% Cr/SiO2 at 200 °C
On this basis the six bands are classified into two groups, arising from two surface species. The species labelled A is characterized by bands at 1642, 1443 and 1227 cm"1 and species B is characterized by bands at 1584 and 1385 cm" 1 . Fig. 3 displays a series of IR spectra of adsorbed CO during heating under CO flow from 100 to 200 °C. Species A (1642, 1443 and 1227 cm"1), dominant at 100°C, has almost completely disappeared at 200 °C. Species B (1584, 1385 cm"1) becomes the dominant species, but a third band at 1371 cm"1 starts to grow. A new species with a band at 1457 cm"1, also grows at the expense of species A. Finally, a very weak band at 1506 cm"1 starts to be visible at 150 C and grows very slowly with temperature. At 200 °C, the spectrum is composed of four strong bands at 1587 and 1385 cm"1 (species B), 1459 and 1373 cm"1, and a
very weak band at 1509 cm '. All these bands, except that at 1509 cm"1, increase with adsorption time as shown in Fig. 4. In an attempt to assign the 1459 and 1373 cm" 1 bands, we compare (Fig. 5) the time dependence of their intensities relative to the band at 1587 cm"1. Fig. 5 shows that their intensity variation is similar and different from that of the 1587 cm"1 band. This implies that the bands at 1459 and 1373 cm"1 can be ascribed to a new species C. Fig. 6 quantitatively illustrates the evolution of the three main bands at 1642, 1584-1589 and 1371-1373 cm"1, which are taken as representative of the three species A, B and C, respectively. The bands at 1373 and 1585 cm" 1 grow more than threefold with increasing adsorption temperature in the range 100-200°C, while the band at 1642 cm"1 decreases in intensity by a factor of two.
2.52.0-
ι Bandât 1587cm
LO-
1.5 Band at 1642 cm "'
Bandât 1642cm"
1.0-
»Band at 1443 cm"
0.5-
Bandât 1385cm"
0.0-
Band at 1227cm"
-5
0
5
10
15
20
25
30
35
40
time/min
Band at 1373 cm" Bandât 1459cm"
0.5
10
Fig. 2 Variations of FTIR band intensities of the adsorbed species at 100 °C as a function of time
15
20
25
30
35
time/min Fig. 5 Variations of FTIR band intensities of the adsorbed species at 200 °C as a function of time
0.08 1584
Bandât 1585cm"
0.06
Band at 1373 cm"
€ 0.04 .Q B 3.3 Thermal stability of the different adsorbed species
The desorption of adsorbed CO was undertaken starting from 200 °C to examine the thermal stability of the surface species. After achieving a steady-state adsorption at 200 °C, the sample was heated in an He flow from 200 to 400 °C. Between 200 and 300 °C, all the bands are almost unaffected. Above 300 °C, the bands of species B decrease strongly and at 400 °C, their intensity is already halved. On the other hand, the bands of species C start to decrease slowly at 380 °C. These results confirm the conclusion that the bands at 1584-1589 (B), 14571459 (C), 1383-1385 (B) and 1371-1373 (C) cm"1 arise from two kinds of surface species distinguished by their difference in behavior when subjected to evacuation. The variation of the two species B and C characterised by the bands at 1588 and 1457 cm"1, respectively, is illustrated more clearly in Fig. 9.
1600 1500 1400 wavenumber/crrT1
1300
1200
Fig. 8 In situ FTIR spectra of the adsorbed species formed at the first stage (4 min), (a) Adsorption at 100 °C; (b) adsorption at 400 °C.
Upon heating in CO from 200 to 300 °C, the bands due to species B and C grow in intensity, with those of B at a higher rate. Above 300 °C, the bands of species B (1585 cm"1) decrease and those of species C (1456 cm"1) continue to increase in intensity (Fig. 7). These results suggest that the thermal stability of species C is higher than of species B.
To study the influence of the adsorption temperature on the formation of the three species (A, B, C), three adsorption experiments were performed at 100, 200 and 400 °C on fresh samples. Each sample was pretreated at 400 °C in an O2 flow for 2 h and then in a He flow for l h prior to CO adsorption. Fig. 8 displays the spectra recorded in the first stage of adsorption (4 min after CO was introduced). This figure clearly shows that (i) species A (bands at 1642, 1443 and 1227 cm"1) is dominant at 100 °C and (ii) at 400 °C, only species B (bands at 1584 and 1384 cm"1) is detected. After 30 min, the spectra recorded at 200 and 400 °C indicate the coexistence of species B and C. However, at 100 °C species B coexists with species A. It is also important to note that when the temperature is increased from 100 to 200 °C, the intensities of the bands due to species B increase by a factor of ten. These results are in full agreement with our previous data: at low temperature species A is dominant and B grows slowly with time. The formation of species B is accelerated with an increase of temperature. Species C is only formed at high temperature and grows at the expense of species B. These results suggest the transformation
1700
0.25- 1588« 0.20-
1457·-
0.050.00200
250 300 350 temperature of desorption/°C
400
Fig. 9 Variations of FTIR band intensities of the adsorbed species at 200 °C during desorption in He flow
Species C is more stable than species B and consequently, the order of thermal stability of the three species detected is A < B < C.
4 Discussion 4.1
Assignment of the bands
On the basis of spectral investigations of various carbonate and carboxylate compounds (mainly bulk solid spectra), the following scheme (Table 1) has been proposed by Davidov15 to interpret the spectra of surface carbonate and carboxylate compounds. On supported CrO3 no detailed data are available to our knowledge, but on ot-Cr2O3, Zecchina et al.16 have reported IR studies of CO2 adsorption. Table 2 lists some assignments
Table 1 Summary of the adsorbed surface carbonate and carboxylate species and their band positions and assignments for CO adsorbed on transition-metal oxides15 species
band position/cm ~ ' (assignment)
inorganic carboxylate non-coordinated carbonate monodentate carbonate bidentate carbonate
1560-1630 (v„COCT); 1350-1420 (v.COCT) 1450-1420 (v„COf~); 1090-1020 (v.CO*-)
bridged carbonate
1530-1470 (V..COQ-); 1370-1300 (v.COCT) 1080-1040 (vC=O) 1530-1620 (vC=O); 1270-1250 (v„COO) 1030-1020 (v.COO) 1620-1670 (vC=O); 1220-1270 (v..COO) 980-1020 (v.COO)
J. Chem. Soc., Faraday Trans., 1997, Vol. 93
4067
Table 2 Assignments of carbonate-like surface species observed after CO2 adsorption on a-Cr2O3 16 wavenumber/cm "
assignment
1560, 1340 1590, 1305 1635, 1285 1490, 1365· 1620, 1430, 1225 1630, 1440
bidentate carbonate bidentate carbonate bidentate carbonate monodentate carbonate bicarbonate carboxylate
of carbonate-like species related to the present work. By comparing our results presented above with those presented in Tables 1 and 2, one can assign species C to monodentate carbonate: 1458 cm" 1 forv as COCr and 1373cm" 1 forv s COO~. These two bands cannot be ascribed to bidentate carbonate since it is known that the splitting is smaller in the monodentate complex than in the bidentate complex.15 Indeed, Nakamoto 17 demonstrated that the difference between v(C—O1) and v(C—O2) is ca. 100 cm' 1 for a monodentate complex but >200 cm" 1 for a bidentate complex. For carboxylate species, symmetric and antisymmetric stretching vibrations are usually found in the regions 1350-1420 and 1550-1630 cm" 1 , respectively (Table 1). For a-Cr2O3,15 Av( = vas - vs) is ca. 200 cm" 1 . Then, the bands near 1585 and near 1385 cm" 1 , previously grouped as species B may be attributed to inorganic carboxylate rather than to carbonate species. Zecchina et al.16 have reported three bands (1620, 1430, 1225 cm" 1 ) attributed to bicarbonate species (Table 2). The same species have also been observed on other oxides (A12O3, ZrO 2 , ZnO).18"20 Then, we propose to assign species A (1642, 1444, 1227 cm" 1 ) to a bicarbonates species; the antisymmetric mode being at 1642 cm" 1 and the symmetric mode at 1444 cm" 1 . The 1227 cm" 1 peak corresponds to the OH bending mode. Owing to very weak transmission in the high frequency region, it has not been possible to observe the OH stretching mode that is expected at ca. 3600 cm" 1 . The other factor that must be taken into account in the analysis of differences between carbonate and carboxylate compounds is their thermal stability. It is known that monodentate carbonates are more thermally resistant than bicarbonate species.18"20 This is in accord with our assignment of species A to a bicarbonate and C to monodentate carbonate. On the other hand, in many studies concerning the adsorption of CO on oxides,17·21"24 it is shown that inorganic carboxylates are less thermally resistant than monodentate carbonates. This tendency reinforces our assignment of species B to inorganic carboxylate. Table 3 summarizes the assignment of the different bands. IR spectroscopie studies of CO adsorption on MgO,25 CaO and SrO26 have shown that adsorbed CO gives rise to a large number of bands attributed to carbonate species and some unusual polymeric CO species. Furthermore, the polymeric species were sensitive to oxygen, being destroyed upon exposure to O 2 , however, no apparent change in our spectra of adsorbed CO was found after exposure of the sample surface preadsorbed with CO to an oxygen flow for 30 min at 200 or 400 °C. We therefore rule out the possibility of polymeric CO Table 3 Summary of the adsorbed surface species and their band positions and assignments for CO treated CrO3/SiO2 catalysts surface species bicarbonate monodentate carbonate inorganic carboxylate 4068
band positions/cm * 1 (assignment) 1227 (vO-H), 1442-1446 (v.COO); 1642-1648 (v„COO) 1371-1376 (v.COO"), 1453-1459 (v..COO") 1381-1386 (v.COO"), 1585-1589 (v.,COO")
J. Chem. Soc., Faraday Trans., 1997, Vol. 93
species in the present study. The band at 1509 cm" 1 is very weak and not regularly observed and has not been assigned. 4.2
Mechanism of the reduction of CrO3/SiO2 with CO
According to our model,27 the reduction process of supported CrO3 with CO is a two-step mechanism :
Cra + CO
Cra(CO)ads
>Cr+(C02)ads
(m