DOI: 10.1021/acs.analchem.5b02029 Anal. Chem. 2015, 87, 9336−9343
Site-Specific Characterization and Absolute Quantification of Pegfilgrastim Oxidation by Top-Down High-Performance Liquid Chromatography-Mass Spectrometry Ines C. Forstenlehner,† ‡ Johann Holzmann,‡,§ Hansjörg Toll,‡,§ and Christian G. Huber,*,†,‡ †
Christian Doppler Laboratory for Innovative Tools for Biosimilar Characterization, University of Salzburg, Hellbrunnerstrasse 34, 5020 Salzburg, Austria
‡
Department of Molecular Biology, Division of Chemistry and Bioanalytics, University of Salzburg, Hellbrunnerstrasse 34, 5020 Salzburg, Austria
§
Analytical Characterization Biopharmaceuticals, Sandoz GmbH, Biochemiestrasse 10, 6250 Kundl, Austria
KEYWORDS PEGylated rhG-CSF, pegfilgrastim, Orbitrap, oxidation, absolute quantification *
Corresponding Author:
Dr. Christian G. Huber Department of Molecular Biology, Division of Chemistry and Bioanalytics, University of Salzburg Hellbrunner Strasse 34, 5020 Salzburg, Austria Phone: (+)43 662 8044 5738 Fax: (+)43 662 8044 5751 E-mail:
[email protected]
1
1 2 3 4 5 6 7 8 9 10 11 12 13 14 15 16 17 18 19 20 21 22 23 24 25 26 27 28 29 30 31 32 33 34 35 36 37 38 39 40 41 42 43
ABSTRACT The characterization and absolute quantification of protein biopharmaceuticals and their product-related impurities, e.g. oxidation variants, is essential due to their potential impact on biological activity and immunogenicity. Here we present site assignment and absolute quantification of oxidation variants of pegfilgrastim, a poly(ethylene glycol) modified recombinant human granulocyte-colony stimulating factor. Pegfilgrastim stressed with 1.0 % hydrogen peroxide served as a model protein for developing a top-down high-performance liquid chromatography-mass spectrometry (HPLC-MS) platform that allowed direct site assignment of Met122, Met127, and Met138 oxidation within a total analysis time of 30 minutes. Three different absolute quantification methods, namely UV absorption spectroscopy, fullscan MS, and all-ion fragmentation (AIF) MS were compared. Additionally, the monitoring of all generated fragment ions or selected sets of fragment ions were evaluated for the AIF method. Linearity of calibration curves from 5.0-25 ng µL-1, 25250 ng µL-1, and 100-1000 ng µL-1 was confirmed. The AIF method achieved a lower limit of detection of 0.85 ng µL-1 and a lower limit of quantification of 2.54 ng µL-1. Based on the comparison of relative standard deviations of interday measurements, AIF was concluded to be the method of choice for concentrations up to 50 ng µL-1, and UV measurements should be carried out above this concentration. Finally, an expired pegfilgrastim batch was analyzed as a a real biopharmaceutical sample to confirm the feasibility of our approach for monitoring low levels of oxidation variants. INTRODUCTION The biopharmaceutical pegfilgrastim is a poly(ethylene glycol) modified (PEGylated) recombinant human granulocyte-colony stimulating factor (rhG-CSF) that is primarily administered to counteract neutropenia induced by chemotherapy.1 PEGylation of proteins results in a number of advantages such as lower immunogenicity and a longer serum half-life due to reduced renal clearance.2,3 Treatment with the nonPEGylated G-CSF (filgrastim) needs daily injections for around 2 weeks whereas one injection of pegfilgrastim is sufficient for each chemotherapy cycle.4 However, the N-terminally, covalently attached poly(ethylene glycol) (PEG) makes mass spectrometric analysis of the protein and its impurities significantly more challenging because of PEG heterogeneity.5 Oxidation represents one of the major product related impurities of protein biopharmaceuticals that requires strict monitoring due to its potential impact on immunogenicity and biological activity.6-10 The main oxidation sites of rhG-CSF are its four methionines, namely Met1, Met122, Met127, and Met138, leading, under mildly oxidative conditions, predominantly to methionine sulfoxide derivatives.11 Met1, which represents also the site of PEGylation,12 is described to be most prone to oxidation, whereas Met122 is located within the hydrophobic core of the protein and therefore features the lowest oxidation susceptibility. Both Met127 and Met138 are found in the loop region between the third and fourth helices. With the exception of Met1, all oxidized variants are described to possess reduced biological activity.13
2
44 45 46 47 48 49 50 51 52 53 54 55 56 57 58 59 60 61 62 63 64 65 66 67 68 69 70 71 72 73 74 75 76 77 78 79 80 81 82 83
Although a number of reports exist about the characterization of filgrastim and its oxidation variants,11,13-15 studies on the PEGylated version can scarcely be found.16 Holzmann et al. employed top-down mass spectrometry (MS) for site specific assignment of oxidation in filgrastim and could differentiate eight different oxidation variants by exploiting diagnostic fragments.11 Similar studies have not been reported for pegfilgrastim. Bagal et al. described the intact measurement of pegfilgrastim and oxidized variants which yielded a mass difference of 16 Da that was concluded to be oxidation. However, oxidation assignment was done by peptide mapping and only one oxidation site, the Met122, was found.16 The routine strategy for the quantitative analysis of methionine oxidation in proteins consists of proteolytic digestion, subsequent separation of oxidized and non-oxidized peptides, their detection by UV spectroscopyand/or MS, and the comparison of the peak areas of non-oxidized and oxidized peptide pairs.14,17-20 Absolute quantification has been achieved by the addition of labelled21,22 or analogue proteins23 before proteolytic digestion, or labelled peptides after digestion.24 Houde et al. have demonstrated relative quantification of peptides by mass spectrometry postulating that non-oxidized and oxidized peptides would have similar ionization efficiencies and therefore ratios of peak areas. This assumption was validated by comparison of UV and MS data.17 A similar approach was applied for the quantification of nonmodified PEGylated molecules. However, only non-PEGylated peptides were exploited as surrogates for the quantitative analysis.25,26 The quantification based on peptides gathered by enzymatic digestion is, nonetheless, not capable of distinguishing specific, multiply oxidized protein variants and their abundances, but merely gives overall information on the abundance of specific modification sites. Moreover, enzymatic reactions and extensive sample preparation could lead to artifacts such as deamidation27 or oxidation,28 especially when changing the optimal storage conditions of the protein to the optimal buffer conditions for the protease. Li et al. reported a quantification method for a 20 kDa PEGylated peptide that applied in-source fragmentation prior to MS analysis in order to simplify the spectrum and quantify based on a fragment,29 but the application of fragmentation to perform quantitative analysis of oxidation in a PEGylated protein has not been explored so far. The chromatographic separation of pegfilgrastim oxidation variants and their intact mass spectrometric analysis was previously shown by our group.30 Therefore, we aim here at developing and evaluating a site-specific and absolute quantification method capable of handling intact PEGylated proteins and their oxidized variants without the need for digestion and extensive sample preparation.31 We focus on elucidating the oxidation sites of stressed pegfilgrastim by top-down MS and intend to perform mass spectrometric quantification based on the calibration-response curve method of peak areas for intact masses or fragments.
3
84 85 86
EXPERIMENTAL SECTION Materials. Acetonitrile (LC–MS grade) was purchased from VWR (Leuven, Belgium). Hydrogen peroxide (H2O2, 35.0–36.5%) was obtained from Merck
87 88 89 90 91 92 93 94 95 96 97 98 99 100 101 102 103
(Darmstadt, Germany). Methanol (LC–MS Chromasolv grade), trifluoroacetic acid (TFA, ≥99.5%), formic acid (FA, 98–100%), triethylamine (TEA, ≥99.5%), ammonium hexafluorophosphate (99.99%), and carbonic anhydrase (from bovine erythrocytes, 100%) were purchased from Sigma-Aldrich Chemie GmbH (Steinheim, Germany). Ultrapure water was produced in house by a Milli-Q System (Millipore Corporation, Billerica, USA). The PEGylated rhG-CSF (drug substance, 16.2 mg mL–1 solution in 10 mmol L–1 acetate, 50 mg mL–1 sorbitol, pH 3.8–4.2) was provided by Sandoz GmbH (Kundl, Austria). The expired pegfilgrastim batch (Neulasta, 6 mg, 0.6 mL injection solution, expired 09/2011) was produced by Amgen (Breda, Nederland). Sample Preparation. The PEGylated rhG-CSF calibration standards were prepared in ultrapure water in appropriate concentrations over a concentration range of 0.50–1000 ng µL–1. A stock solution of carbonic anhydrase was prepared in 20% acetonitrile and 0.050% TFA and added to each calibration standard to a final concentration of 100 ng µL–1. The carbonic anhydrase was used as carrier protein for diminishing loss of calibrant because of adsorption to surfaces especially of the low concentrated solutions. Oxidation was induced in a 1.0 mg mL–1 pegfilgrastim sample by addition of H2O2 to a final concentration of 1.0% for 15 min at room
104 105 106 107 108 109 110 111 112 113 114 115 116
temperature. The oxidation process was stopped through buffer exchange to ultrapure water by using ultrafiltration (Amicon Ultra 0.5 mL centrifugal filters with a 3 kDa cutoff, EMD Millipore, Darmstadt, Germany). Subsequently, carbonic anhydrase was also added to the stressed samples. For the measurement of intact proteins, triethylamine was prepared in a concentration of 400 mmol L–1 in 50% methanol. The high mass calibration of the mass spectrometer was executed with 1.0 mg mL–1 ammonium hexafluorophosphate in 50% methanol and 0.10% FA. The determination of extinction coefficients for non-stressed and stressed pegfilgrastim samples was carried out on a nanophotometer (Model P330, Implen GmbH, Munich, Germany) at 214 nm. A molar extinction coefficient of 260 348 L mol−1 cm−1 at 214 nm was determined both with an oxidized or non-oxidized 1.0 mg mL-1 standard solution of pegfilgrastim. Buffer exchange to ultrapure water by ultrafiltration was carried out for the stressed samples because H2O2 was interfering
117 118 119 120 121 122 123
with the UV-absorbance of the analyte. High-performance liquid chromatography. The chromatographic separation of oxidation variants was carried out in a capillary/nano HPLC system (Model UltiMate 3000, Thermo Fisher Scientific, Germering, Germany) at a flow rate of 200 µL min–1. The Discovery BIO wide pore C18 column (150 x 2.1 mm i.d., 3.0 µm particle size, 300 Å pore size, Supelco, Bellefonte, PE, USA) was operated at a column temperature of 50°C. A gradient of solutions A (H2O + 0.10% TFA) and B
124 125 126
(acetonitrile + 0.10% TFA) was formed as follows: 53.2% B for 0.5 min, 53.2–53.6% B for 15 min, 53.6–56.6% B for 0.50 min, 56.6–57.0% B for 15 min, 57.0–95.0% for 0.50 min, 95.0% for 2.5 min, 95.0–53.2% B for 0.10 min and 53.2% B for 7.0 min. In
4
127 128 129 130 131 132 133 134 135 136 137 138 139 140 141 142 143 144 145 146 147 148 149 150 151 152 153 154 155 156 157 158 159 160 161 162 163 164 165 166 167 168 169 170
spite of its tendency for ion suppression, TFA was chosen as an additive for ion-pair reversed-phase HPLC of proteins, because it facilitates sufficient (baseline) separation of the investigated pegfilgrastim oxidation variants.32 Moreover, TFA as additive allowed serial UV-detection at 214 nm and mass spectrometric detection of the separated proteins, which was essential for the comparison of both detection modes. For minimizing quantitative uncertainty, a full loop injection of 1.0 µL was chosen. UV detection was carried out at a wavelength of 214 nm in a 45 nL Z-shaped capillary cell. For the intact measurements, triethylamine was added via a T-piece and a syringe pump (Model Fusion 100 T, Chemyx Inc., Stafford, TX, USA) equipped with a 5000 µL syringe (Hamilton, Reno, NV, USA) before the ESI spray as described previously.30 Mass spectrometry. All measurements were conducted on a quadrupole-Orbitrap mass spectrometer (Q Exactive) from Thermo Fisher Scientific (Bremen, Germany) by using the heated ESI source and applying a heater temperature of 70°C. The following instrumental parameters were used: sheath gas flow of 35 arbitrary units, auxiliary gas flow of 15 arbitrary units, spray voltage of 3.5 kV, capillary temperature of 300°C, S-lens RF level of 80.0, in-source CID of 70.0 eV, AGC target of 1e6, and a maximum injection time of 100 ms. The measurements of intact proteins with postcolumn addition of triethylamine (TEA) were performed with full scan data acquisition, a scan range of m/z 2500–6000 and a resolution of 17 500 at m/z 200. The fragmentation experiments utilizing all ion fragmentation (AIF) were carried out in the higher-energy collisional dissociation (HCD) cell upon applying a normalized collision energy (NCE) of 12 (corresponding to 48 eV collision energy at m/z 2000), a scan range of m/z 1000–3000 and a resolution of 140 000 at m/z 200. Source collision-induced dissociation (SID) and normalized collision energy (NCE) values were optimized to obtain maximum signal intensity of the diagnostic y-fragments. Individual parameters are given in the figure legends. Mass calibration was executed by using ammonium hexafluorophosphate. For the fragmentation experiments the instrument was calibrated with a lower m/z of 670 and an upper m/z of 2626. High mass calibration was done within the mass range of m/z 2137–5559. Data evaluation. All peaks were manually integrated using Chromeleon 7.1 (Thermo Fisher Scientific, Germering, Germany) for UV Data and Xcalibur 2.2 for MS data (Thermo Fisher Scientific, San Jose, CA, USA). The extent of oxidation in the standard substance was determined by relative quantification of the UV areas by applying the SmartPeaks integration assistant option and choosing the integration type: exponentially skimmed riders. The deconvolution of the fragment ion spectra was carried out by applying the Xtract algorithm in the software Xcalibur 2.2 (Thermo Fisher Scientific). Extracted ion current chromatograms (EICCs) were taken from the five most intense isotopic peaks and before integration, whereas reconstructed total ion current chromatograms (RTICC) were used to represent the sum of the intensities of all detected (fragment) ions. Gaussian smoothing of 7 points was generally performed.
5
171 172 173 174 175 176 177 178 179 180 181 182 183 184
Quantification was accomplished based on external calibration using non-oxidized pegfilgrastim as standard protein throughout. All determined peak areas were manually transferred to an Excel sheet (Microsoft Excel 2010, vers. 14.0.7116.5000, Microsoft Corporation, Redmond, WA, USA), which is available as Supplementary Table (see Excel file provided as Supporting Information). Calibration curves of five interday injections were constructed for three different concentration ranges: 5–25 ng µL–1, 25–250 ng µL–1, 100–1000 ng µL–1. Data treatment included the calculation of the regression equation and the correlation coefficient (R2), the calculation of the confidence intervals (C.I.) based on f = n–2 and a confidence level of 95%, and the limit of detection (LOD) and limit of quantification (LOQ) (see Excel file provided as Supporting Information). Sequence coverage of fragmentation experiments was determined with the ProSightPTM33 online tool (https://prosightptm2.northwestern.edu/) provided by the Kelleher Research Group (Northwestern University, Evanston, IL, USA).
185 186 187 188 189 190 191 192 193 194 195 196 197 198 199 200 201 202 203 204 205 206 207 208 209 210 211
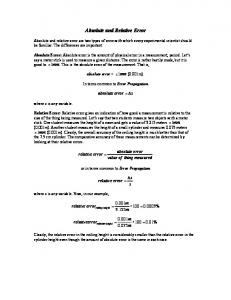
RESULTS AND DISCUSSION Oxidation site assignment. PEGylated rhG-CSF contains 4 methionines, namely Met1, Met122, Met127, and Met138, which can be oxidized through mild treatment with hydrogen peroxide to obtain a suitable reference sample.13 The chromatographic separation of the four main oxidation variants of stressed PEGylated rhG-CSF and the determination of the degree (but not the site) of oxidation by intact protein mass spectrometry have previously been shown by our group.30 Here, oxidation site assignment to the respective methionines was carried out on the basis of characteristic fragments.11 In a first step, post-column addition of triethylamine was used for charge-stripping to shift signals for PEGylated, multiply charged pegfilgrastim species into a detectable m/z range. However, this was accompanied by a significant loss of signal intensity. On the other hand, when carrying out all-ion fragmentation (AIF) on the intact protein in the HCD cell, which is a mode of fragmentation that decomposes all charge states of the protein transmitted into the collision cell without prior mass selection in the quadrupole, several y-ions were readily detectable even in the absence of triethylamine. For example, y47, y50, and y78 (see fragments labeled in Figure 1) were useful as diagnostic fragments for Met122, Met127 and Met138 oxidation.11 Although the C-terminus featured good sequence coverage in our measurements, no b-ions containing the N-terminus were retrieved (see Figure 1), most probably because of the attachment of PEG to the amino group of the N-terminal methionine.12 The b-ions would therefore have an additional mass of approximately 20 kDa, which shifts them out of the upper m/z limit of the Q Exactive of m/z 6000. Another possible reason for missing b-ions is the partial fragmentation of PEG, resulting in a large number of different b-ions below the detection limit. Due to that, Met1 is not covered in the fragmentation experiments and needs to be elucidated by
6
212 213 214
ning the da ata on the oxidation degree ga athered by y intact meeasuremen nts with combin the info ormation gained by oxidation o siite mapping of Met12 22, Met1277 and Met1 138.
215 216 217 218 219
Figure 1 1. Top-down n fragment io on spectrum of non-oxidiized pegfilgrrastim. The ddiagnostic fra agments: y47 (blu ue), y50 (red), and y78 (green) are in ndicated; (a)) raw spectru um; (b) sequuence coverage map generate ed with ProS Sight PTM. Sample; S 1000 0 ng µL–1 pe egfilgrastim, R = 140 0000 at m/z 200; SID 70, NCE 12. Other meassurement conditions are given in the Experimenta al Section.
220 221 222 223 224 225 226 227 228 229 230 231 232 233 234 235 236 237 238 239
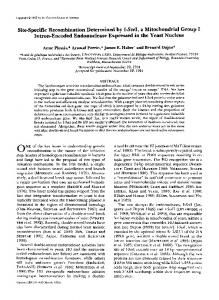
Figure 2 depicts the recon nstructed to otal ion cu urrent chro omatogram m (RTICC) as well Cs) of the e diagnostiic fragmen nts y47, as extrracted ion current chromatogrrams (EICC y50, an nd y78 tha at are suita able for diffferentiatin ng the non-modified pegfilgrasttim and its oxiidized varriants. In the emp ployed gra adient, the e carrier protein carbonic c anhydrrase eluted in the column ho old-up volume and did not i nterfere with w the pegfilgrastim varriants (see e Figure S S-1). In to otal, eight different chromatographic e, each rep presenting g different oxidation vvariants. The T first peaks were distinguishable four pe eaks at low wer retentio on times a ll contain oxidized o Met122, M as evidenced d by the zed y78 (ttrace g in Figure 2)) and the presence of y78 absencce of the non-oxidiz contain ning one, two, t or thrree additio onal oxyge en atoms (traces ( h, I, j in Fig gure 2). Peak 1 containss triply oxidized y78 8 (trace j), which alllows direcct identifica ation of oxidize ed Met122,, Met127, and a Met13 38. Peak 2 features a non-oxidizzed y47 (trrace b), ore Met138 8 is not oxidized, but a singly oxidized o y5 50 (trace e)), which directs to therefo a Met1 127 oxidattion and a doubly o oxidized y78 y (trace i), corrobborating th hat also Met122 2 is oxidizzed. Moreo over, it can n be dedu uced that peak p 3 shhows Met122 and Met138 8 oxidation n (traces c, e, and i), while peak 4 on nly points towards Met122 oxidatio on (trace h). h Met1 is s not coverred in this data and could c onlyy be elucidated by compa arison to the data on the overall oxidation o degree ggained by y intact measurements. However, the intacct measure ements we ere not cconclusive in this respecct for the firrst four chromatogra aphic peaks s due to in nsufficient ssignal inte ensity of
7
240 241 242 243 244 245 246 247 248 249 250 251 252 253 254 255 256 257 258 259 260 261 262 263 264 265 266 267 268 269 270 271 272 273 274 275 276 277 278 279 280 281 282
the minor oxidation variants (see Figure S-2a and b). Nevertheless, data published on the non-PEGylated rhG-CSF11 give clear evidence that Met1 is oxidized in all those peaks as it is most prone to oxidation. In a similar manner as detailed above we can conclude that peak 5 shows Met1, Met127 and Met138 oxidation, peak 6 features Met1 and Met127 oxidation, peak 7, oxidized Met1 and Met138, and peak 8, Met1 oxidation (see Figure 2). The peak labeled as "S" is a system peak, resulting from the steep increase of the acetonitrile gradient after an almost isocratic elution step (see Figure S-3) yielding a dense cloud of signals in the mass spectra. It is potentially composed of coeluting low level oxidation variants, e.g. oxidation on other amino acid residues than methionine. However, due to the plethora of low abundant signals, a specific variant could not be unambiguously assigned. Quantification strategies. Since oxidation is one of the major shelf-life limiting factors for protein biopharmaceuticals, its absolute quantification is of utmost relevance, especially in the lower concentration range. Nonetheless, quantification methods based on MS have not been employed so far, neither for in-process control nor for product release analysis because of challenging implementation requirements for a regulated GMP environment. Still, several MS-based strategies have been described in the literature for the absolute quantification of intact proteins, including selected-reaction monitoring (SRM)34 and intact full-scan MS measurements.31 Quantification relying on full-scan MS offers the benefit of monitoring several charge states and collecting information on the whole protein, including possible other post-translational modifications such as disulfide bond formation or sequence variation with the disadvantage of higher spectral background and potential interferences due to the presence of several multiply charged species.31 In order to tackle the high complexity of intact protein mass spectra, physical separation of the protein variants before full-scan MS is mandatory for successful quantification. SRM methods, quantifying analytes on the basis of fragments generated from preselected precursor ions, on the other hand, hold the advantages of higher specificity and lower limits of detection at the cost of higher methodological complexity. Utilizing data generated by UV-absorbance and mass spectrometric detection, we evaluated the concentration-response curves obtained either by monitoring the signals of multiply charged intact protein species (intact full scan MS) or by observing fragments generated upon AIF by means of full scan data acquisition (AIFMS) in a quadrupole-Orbitrap mass spectrometer. UV-absorbance detection, employing solutions of the non-oxidized protein as calibration standards, served as reference method yielding a conventional true value to estimate bias and to assess statistical parameters of the calibration, such as limits of detection/quantitation or confidence intervals. To ensure that the oxidation state does not influence the UV absorption coefficient, a non-stressed and a stressed pegfilgrastim sample of the same concentration were measured on a nanophotometer and no significant difference could be observed in terms of absorptivity (see Figure S-4).
8
1 23 4
S
56 7 8
2.105 1.105
RTICC
(a)
1.104
y47
(b)
0 5000
y47+O
0 5000
y50
Relative Abundance
0
(c)
5.105
(d)
5.105
0 1.106
5.105
y50+O
2000 0 2000 1000 0
y50+2O
2000 1000 0
y78
(e) (f)
0 1.105 0 1.106
(g)
y78+O
(h)
0
0 5.105 0
5000
y78+2O
0 5000
y78+3O
0 6
295 296 297
1.106 0
0
4000
283 284 285 286 287 288 289 290 291 292 293 294
4.107 2.107 0 2.106
10
14
18
22
26
(i)
2.105
(j)
2.105 0
0
30
Time (min) Figure 2. Oxidation site assignment based on EICCs of diagnostic fragments y47 (blue), y50 (red), y78 (green), being non-, singly (+O), doubly (+2O), or triply (+3O) oxidized (the 5 most intense isotope peaks of the charge state +4 were extracted). The zoomed chromatographic traces on the left side visualize the minor oxidation variants present in peak 1-4. Peak identification: 1, Met122, Met127, Met138 oxidized; 2, Met122, Met127 oxidized; 3, Met122, Met138 oxidized; 4, Met122 oxidized; S, system peak; 5, Met127, Met138 oxidized; 6, Met127 oxidized; 7, Met138 oxidized; 8, non-oxidized. Met1 oxidation is not covered in this evaluation. Sample, 1.0 µL 1000 ng mL–1 PEGylated rhG-CSF stressed with 1.0% H2O2 for 15 min at room temperature; R = 140 000 at m/z 200, SID 70, NCE 12. Further experimental details are provided in the Experimental Section.
Absolute quantification of oxidation variants. A 1.0% H2O2 stressed pegfilgrastim sample served as a model mixture as it features both very low- and high-abundant variants (see peaks 1-4 and 5-8 in Figure 2). Since pure standards for each oxidation variant were not available, we deduced the concentrations of oxidized
9
298 299 300 301 302 303 304 305 306 307 308 309 310 311 312 313 314 315 316 317 318 319 320 321 322 323
variants from a calibration curve created with the peak areas of the non-oxidized standards. Because also the "non-oxidized" standard featured a low level of oxidation, the actual standard concentrations were adjusted after comparing the relative peak areas in UV traces of the 1000 ng µL–1 calibration standard, which revealed an overall oxidation degree of 1.1%. Measurement series included the analysis of fourteen different calibration standards (0.50-1000 ng µL-1) followed by two blank measurements and one blank injection of pure water. Measuring from low to high concentration, calibration series were repeated three times, then each sample solution was analyzed in triplicate, and then each calibration series was run two additional times. Data evaluated from reconstructed total ion current chromatograms (RTICC) of the multiply charged intact protein species revealed that the signal-to-noise ratios were insufficient to calibrate concentrations below approximately 200 ng µL-1, therefore, this quantification strategy was no longer followed. For the other quantification approaches involving AIF, peak areas were deduced either from RTICCs of all fragment ions detected upon AIF (further called MS, AIF-RTICC) or from EICCs of selected y-ions (+4 charge state and 5 most intense isotope peaks, further called MS, AIF-EICC). Calibration curves were established for three different concentration ranges, namely 5-25 ng µL–1, 25-250 ng µL–1, 100-1000 ng µL–1. For UV measurements, no calibration curve was generated for the concentration range of 5– 25 ng µL–1 because of low signal-to-noise ratios, and the second calibration curve was constructed from 50-250 ng µL–1. Individual calibration curves and statistical parameters are provided as supporting material (see also the section figures of merit below). Table 1 summarizes the quantitative results of the three technical replicates of the 1.0% H2O2 stressed pegfilgrastim analysis. The method based on UV absorbance
324 325 326 327 328 329 330 331 332 333 334 335 336 337 338 339 340
could not detect the low abundant oxidized Met122 variants (peak 1 to 4 in Figure 2). Peak 5, the triply oxidized variant containing Met1, Met127 and Met138 oxidation results in comparable concentrations between the UV- and the AIF-RTICC method with a deviation of only 0.88%. However, AIF-EICC quantification based on the y47 fragment yielded a deviation of 57.9% between the two quantification methods. Close inspection of the fragment ion spectra of oxidized and non-oxidized pegfilgrastim variants revealed that the relative signal intensities of the observed yfragments differed considerably, which indicates an influence of methionine oxidation on fragmentation behavior (see Figure S-5). Consequently, utilization of non-oxidized protein to quantify the oxidized variants on the basis of selected y-fragments is inappropriate. Nonetheless, the decent congruence of results obtained with the UV- and AIFRTICC methods (Table 1) proof the suitability of top-down mass spectrometric detection for intact protein quantification. These results suggest that the total abundance of ions does not change upon methionine oxidation, although the relative intensities of fragment ions may change, which is in agreement with a report that the oxidation of Met127 as well as Met138 induces local conformational changes.13
10
341 342
Table 1. Quantification of the oxidation variants of the 1.0% H2O2 stressed pegfilgrastim sample based on the different data evaluation approaches. Concentrationa) UV
MS, AIF-RTICC –1
–1
MS, AIF-EICC (y47) –1
[ng µL ]
[ng µL ]
[ng µL ]
Peak 1b)
n.d.d)
3.35 ± 0.19f)
0.85 ± 0.32g)
Peak 2
n.d.
3.44 ± 0.19f)
1.55 ± 0.32f)
Peak 3
n.d.
3.93 ± 0.18f)
1.24 ± 0.32g)
Peak 4
n.d.
4.38 ± 0.18f)
3.00 ± 0.31f)
Peak 5c)
102.40 ± 4.45e)
103.31 ± 8.17
43.11 ± 8.32
Peak 6
114.28 ± 4.44
119.48 ± 8.20
91.51 ± 8.05
Peak 7
324.77 ± 13.16
326.63 ± 47.73
162.76 ± 46.75
436.54 ± 12.96
495.93 ± 46.90
505.42 ± 43.41
n.d.
0.9988
0.9968
0.9738
0.9751
0.9506
0.9583
Peak 8 2
–1
R (5-25 ng µL ) 2
–1 h)
h)
R (25-250 or 50-250 ng µL )
0.9921
R2 (100-1000 ng µL–1)
0.9961
a)
The concentrations are mean values of 3 consecutive injections of the 1.0% H2O2 stressed sample
343 344 345 346 347 348 349 350 351 352
Figures of merit. The linearity of all calibration curves, except the 5-25 ng µL-1 MS, AIF-EICC (y47), was confirmed by applying the Mandel’s fitting test (see Excel
353 354 355 356 357 358 359 360 361 362 363 364 365 366 367
file provided as Supporting Information). Relative standard deviations (RSDs) of quintuplicate injections of each calibration standard are plotted in Figure 3 and ranged between 1.6 and 47% for the different methods. As expected, RSDs decrease with increasing sample concentration with UV- and full-scan intact MS detection. However, for the MS, AIF-RTICC method, RSDs start increasing again after a minimum at 25 ng µL–1, which is most probably a consequence of the interplay between the maximum number of ions admissible for injection into the Orbitrap35,36 (automatic gain control AGC target value) and the maximum ion collection time. At concentrations higher than 100 ng µL–1 we observed a continuous reduction in ion collection time in order to limit the number of injected ions, which may be the reason for a larger fluctuation in mass spectrometric signals (see Figure S-6). Additionally, the relative standard deviations of peak areas were evaluated for interday and intraday quintuplicate injections of the 500 ng µL–1 standard. Intraday measurements show RSDs of 0.6 to 1.5% whereas interday measurements are in the range of 5.8-12% (Table 2). Relative process standard deviation for the different
depicted in Figure 2, the initial total protein concentration was 1000 ng µL-1; b)peak numbering corresponds to Figure 2; c)peak 5 is described in detail in the text. d)n.d. = not detectable. e) 95% confidence intervals were calculated using a two sided t-test; f)note that the lowest calibration point used for quantification was 5.0 ng µL-1. Even though all concentrations are above the lower limit of quantification, their concentrations need to be considered estimates; g)peaks 1 to 4 are below the limit of quantification for the AIF-EICC approaches (see Table 2). Therefore these concentrations have to be considered as estimates. h)UV detection was calibrated within the range of 50-250 ng µL–1.
11
368
calibration ranges and detection methods are displayed in Table 2 and range from 50
peak (UV) peakarea area (UV) peak (MS, AIF) peakarea area (AIF-MS)
40
peakarea area (MS) peak (MS, intact full scan)
30 25
LOQ, UV
RSD [%]
35
LOQ, full scan Intact MS
LOQ, AIF-RTICC
45
20 15 10
RSD 5%
5 0 1
10
100
1000
Concentration of calibration standards [ng µL-1] 369 370 371 372 373
2.4 to 15%. Figure 3. Relative standard deviations of the peak areas (RSDs) at the respective concentrations of the calibration curves. RSDs represent 5 different measurements carried out within 3 days corresponding to the interday precision. Table 2. Limits of detection (LOD) and limits of quantification (LOQ) for each quantification method. UV MS, intact full-scan MS, AIF-RTICC MS, AIF-EICC (y47) –1
[ng µL ]
LOD (n=5)
21.8
LOQ (n=5)
65.4
a) b)
65.3
a)
195.9
a)
4.18
a)
6.39%
n.d.
2.40
3.91
6.18
n.d.
13.52
13.16
4.11
13.57
14.92
13.66
n.d.
–1 c)
a)
a)
b)
11.72%
Vx0% (100-1000 ng µL )
1.39
7.06%
5.75%
–1 c)
2.54
a)
1.41%
RSD (%) (interday, n=5)
Vx0% (25-250 ng µL )
–1
[ng µL ]
b)
0.55%
–1 c)
–1
[ng µL ]
0.85
RSD (%) (intraday, n=5)
Vx0% (5-25 ng µL )
374 375 376 377 378 379 380
a)
[ng µL–1]
b)
n.d.
1.49% b)
b) b)
All values are mean values from five injections carried out within 3 days. a)LODs calculated according to the regression line method using the slope b and the residual standard deviation sy of the 5–25 ng µL–1 calibration curves for AIF-RTICC and AIF-EICC, 25–250 ng µL–1 for the intact measurements, and 50–250 ng µL–1 for UV-measurements. b)Interday and intraday RSDs were evaluated for the 500 ng µL–1 calibration standard; c)relative process standard deviation
/ ̅
standard deviation of the calibration, b, slope of the calibration line, concentrations.
. 100% with sy, residual ̅ , mean of standard
12
381 382 383 384 385 386 387 388 389 390 391 392 393 394 395 396 397 398 399 400 401 402 403
Comparison of the quantification methods. A comparison of RSDs of UV and MS measurements suggests that the method of choice for pegfilgrastim concentrations below 50 ng µL–1 is MS-based AIF-RTICC as it features lower RSDs and lower limits of detection/quantification. Protein concentrations below 35 ng µL–1 can only be quantified by means of MS-based AIF-RTICC. For concentrations higher than approximately 100 ng µL–1, UV quantification yields more reliable results. The comparatively high LODs with intact full-scan MS with the postcolumn addition of TEA makes the qualitative or quantitative monitoring of low-concentrated productrelated impurities unfeasible (see Figure S-2). Finally, the data presented in Table 2 clearly show that a serial implementation of UV absorbance and mass spectrometric detection as readily feasible with common HPLC-MS platforms such as the one utilized in this study facilitated the confident qualitative and quantitative analysis of proteins in a concentration range of 5 to 1000 ng µl-1, which corresponds to a molar concentration of 124 nmol L-1- 25 µmol L-1. The relative process standard deviations in this combined setup were equal or below 6.2%, representing a sound basis for implementation in a GMP regulated environment in a not too distant future. On the other hand, a combination of all-ion fragmentation with detection of all fragment ions clearly represents a viable alternative to intact full-scan MS enabling MS-based detection to enhance the detectability of low-concentrated impurities. Our investigations also clearly show that selected-reaction monitoring (similar to AIFEICC), which is the gold standard for peptide quantification, is only applicable when authentic reference standards (in our case well-definded oxidized protein variants) are available.
404 405 406 407 408 409 410 411 412 413 414 415 416 417 418
Quantification of oxidation in a real biopharmaceutical sample. A pegfilgrastim sample stored for 3 years beyond its expiry date was utilized to check for oxidation variants in a real sample. The quantification range was chosen based on the sample concentration. The RTICC of the AIF-MS measurement of the expired pegfilgrastim sample is depicted in Figure 4. The main component (peak 3) was quantified with the UV-method, which was found to be optimal for concentrations above 100 ng µL-1, and gave a concentration of 679.68 ± 13.10 ng µL-1. The oxidation variants, peak 1 and 2, were quantified with the MS, AIF-RTICC method due to their concentration below 50 ng µL-1. Peak 1, consisting of the oxidized Met127 variant, yielded a concentration of 5.23 ± 0.18 ng µL-1 (0.76% of the total detected protein mass of 688 ng, corresponding to 7.6 mg.g-1) and peak 2, oxidized Met138, yielded 3.63 ± 0.18 ng µL-1 (0.53%, corresponding to 5.3 mg.g-1). Both concentrations were above the lower limit of quantification. Here we could show that our method developed for monitoring and quantifying oxidation variants of pegfilgrastim is feasible for monitoring low levels of impurities of a relevant biopharmaceutical sample.
13
3
MS, AIF-RTICC
(a)
5.107 4.107 3.107 2.107 1.107 0
(b)
1.5.106 1.0.106
Met138 ox
1
Met127 ox
0.5.106 0
22
100 80 60 40 20 0 1000
419 420 421 422 423 424 425 426 427 428 429 430 431 432 433 434 435 436 437 438 439 440
24
2
26
28
30
Time (min)
32
34
y43 1167.38 y47 1269.68
y50+O 1338.71
1400
(c) y78+O 2128.10
y57+O 1574.81
m/z
1800
2200
Figure 4. MS, AIF-RTICC of an expired pegfilgrastim batch. (a) RTICC, (b) zoomed RTICC (3% relative abundance), (c) mass spectrum of peak 1 with the oxidation sites assigned. Sample, 1.0 µL 1.0 mg mL–1 pegfilgrastim (Neulasta, exp. 09/2011), measurements done 08/2014; R = 140 000 at m/z 200, SID 70, NCE 12.
CONCLUSIONS All ion fragmentation combined with full scan MS detection allow both oxidation site assignment and absolute quantification of oxidized methionine and non-oxidized variants of pegfilgrastim. In-depth data analysis reveals that the monitoring of selected ions or a set of selected ions is not appropriate to reliably quantify oxidized variants using non-oxidized standards. A comparison of UV-absorbance and MSbased absolute quantification strategies reveals that each approach has an optimal concentration range. While the high-abundant main components are better quantified by UV detection, MS detection is the method of choice for the determination of lowconcentrated impurities. Since both detection modes are not providing selectivity for certain analytes, adequate chromatographic separation of all protein variants prior to their detection is indispensable. The application of both methods in series allows a reliable quantification in a concentration range of 2.5-1000 ng µL–1 with relative process standard deviations below 6.5%. The feasibility of our approach for monitoring and absolutely quantifying low level impurities in a protein biopharmaceutical was successfully exemplified on an expired pegfilgrastim sample.
441
14
442
NOTES
443 444 445 446 447 448 449 450 451 452 453 454 455
Hansjörg Toll and Johann Holzmann are employees of Sandoz GmbH, which provides financial support for the Christian Doppler Laboratory for Innovative Tools for Biosimilar Characterization. Christian G. Huber's salary is partly funded by the Christian Doppler Laboratory for Biosimilar Characterization. The authors declare no other competing financial interest.
456
SUPPORTING INFORMATION
457 458
Supporting Information available: This material is available free of charge via the Internet at http://pubs.acs.org.
459 460 461 462 463
REFERENCES (1) Holmes, F. A.; Jones, S. E.; O'Shaughnessy, J.; Vukelja, S.; George, T.; Savin, M.; Richards, D.; Glaspy, J.; Meza, L.; Cohen, G.; Dhami, M.; Budman, D. R.; Hackett, J.; Brassard, M.; Yang, B. B.; Liang, B. C. Ann. Oncol. 2002, 13, 903-909.
464
(2)
Piedmonte, D. M.; Treuheit, M. J. Adv. Drug Deliv. Rev. 2008, 60, 50-58.
465
(3)
Jevsevar, S.; Kunstelj, M.; Porekar, V. G. Biotechnol. J. 2010, 5, 113-128.
466
(4)
Harris, J. M.; Chess, R. B. Nat. Rev. Drug Discov. 2003, 2, 214-221.
467 468
(5)
Huang, L. H.; Gough, P. C.; DeFelippis, M. R. Anal. Chem. 2009, 81, 567577.
469
(6)
Schellekens, H. Nat. Rev. Drug Discov. 2002, 1, 457-462.
470
(7)
Sharma, B. Biotechnol. Adv. 2007, 25, 310-317.
471 472 473
(8)
Silva, M. M.; Lamarre, B.; Cerasoli, E.; Rakowska, P.; Hills, A.; Bailey, M. J.; Wheeler, J. X.; Burns, C. J.; Gaines-Das, R. E.; Jones, C.; Robinson, C. J. Biologicals 2008, 36, 383-392.
474 475
(9)
Skrlin, A.; Kosor Krnic, E.; Gosak, D.; Prester, B.; Mrsa, V.; Vuletic, M.; Runac, D. J. Pharm. Biomed. Anal. 2010, 53, 262-268.
476
(10)
Gucinski, A. C.; Boyne, M. T. 2nd, Anal. Chem. 2012, 84, 8045-8051.
ACKNOWLEDGMENTS The financial support by the Austrian Federal Ministry of Economy, Family, and Youth, the National Foundation of Research, Technology, and Development, and by a Start-up Grant of the State of Salzburg is gratefully acknowledged. We thank Kai Scheffler, Martin Samonig, and Jonathan Josephs from Thermo Fisher Scientific for technical support and scientific discussions. We also acknowledge Therese Wohlschlager for her valuable comments.
15
477 478
(11)
Holzmann, J.; Hausberger, A.; Rupprechter, A.; Toll, H. Anal. Bioanal. Chem. 2013.
479
(12)
Molineux, G. Curr. Pharm. Des. 2004, 10, 1235-1244.
480 481
(13)
Lu, H. S.; Fausset, P. R.; Narhi, L. O.; Horan, T.; Shinagawa, K.; Shimamoto, G.; Boone, T. C. Arch. Biochem. Biophys. 1999, 362, 1-11.
482 483
(14)
Yin, J.; Chu, J. W.; Ricci, M. S.; Brems, D. N.; Wang, D. I.; Trout, B. L. Pharm. Res. 2005, 22, 141-147.
484 485
(15)
Yin, J.; Chu, J. W.; Ricci, M. S.; Brems, D. N.; Wang, D. I.; Trout, B. L. Pharm. Res. 2004, 21, 2377-2383.
486
(16)
Bagal, D.; Zhang, H.; Schnier, P. D. Anal. Chem. 2008, 80, 2408-2418.
487 488
(17)
Houde, D.; Kauppinen, P.; Mhatre, R.; Lyubarskaya, Y. J. Chromatogr. A 2006, 1123, 189-198.
489
(18)
Griffiths, S. W.; Cooney, C. L. J. Chromatogr. A 2002, 942, 133-143.
490 491
(19)
Zang, L.; Carlage, T.; Murphy, D.; Frenkel, R.; Bryngelson, P.; Madsen, M.; Lyubarskaya, Y. J. Chromatogr. B 2012, 895-896, 71-76.
492 493
(20)
Sandra, K.; Vandenheede, I.; Sandra, P. J. Chromatogr. A 2014, 1335, 81103.
494 495
(21)
Heudi, O.; Barteau, S.; Zimmer, D.; Schmidt, J.; Bill, K.; Lehmann, N.; Bauer, C.; Kretz, O. Anal. Chem. 2008, 80, 4200-4207.
496 497
(22)
Ji, C.; Sadagopan, N.; Zhang, Y.; Lepsy, C. Anal. Chem. 2009, 81, 93219328.
498 499
(23)
Mayr, B. M.; Kohlbacher, O.; Reinert, K.; Sturm, M.; Gropl, C.; Lange, E.; Klein, C.; Huber, C. G. J. Proteome Res. 2006, 5, 414-421.
500
(24)
Kirkpatrick, D. S.; Gerber, S. A.; Gygi, S. P. Methods 2005, 35, 265-273.
501 502
(25)
Yang, Z.; Ke, J.; Hayes, M.; Bryant, M.; Tse, F. L. J. Chromatogr. B 2009, 877, 1737-1742.
503 504
(26)
Wu, S. T.; Ouyang, Z.; Olah, T. V.; Jemal, M. Rapid Commun. Mass Spectrom. 2011, 25, 281-290.
505
(27)
Du, Y.; Wang, F.; May, K.; Xu, W.; Liu, H. Anal. Chem. 2012, 84, 6355-6360.
506 507
(28)
Perdivara, I.; Deterding, L. J.; Przybylski, M.; Tomer, K. B. J. Am. Soc. Mass. Spectrom. 2010, 21, 1114-1117.
508 509
(29)
Li, H.; Rose, M. J.; Holder, J. R.; Wright, M.; Miranda, L. P.; James, C. A. J. Am. Soc. Mass. Spectrom. 2011, 22, 1660-1667.
510 511
(30)
Forstenlehner, I. C.; Holzmann, J.; Scheffler, K.; Wieder, W.; Toll, H.; Huber, C. G. Anal. Chem. 2014, 86, 826-834.
16
512 513
(31)
Ruan, Q.; Ji, Q. C.; Arnold, M M. E.; Hum mphreys, W. W G.; Zhu , M. Anal. Chem. 2011, 83, 8937-8944 4.
514
(32)
Huber, C. G.; Prems staller, A. JJ. Chromattogr. A 199 99, 849, 1661-173.
515 516
(33)
LeDuc, R. D.; Taylorr, G. K.; Kim, Y. B.; Januszyk, J T. T E.; Bynuum, L. H.; Sola, J. V.; Garave elli, J. S.; Kelleher, K N N. L. Nucl. Acids A Res.. 2004, 32,, W340-345.
517 518
(34)
Ji, Q. C.; Rodila, R R.; Gage, E. M.; El-Sho ourbagy, T. T A. Anal. Chem. 20 003, 75, 7008-7014 4.
519 520
(35)
Kalli, A.; Smith, S G. T.; T Sweredo oski, M. J.;; Hess, S. J. Proteom me Res. 20 013, 12, 3071-3086 6.
521 522
(36)
Bateman, K. P.; Kellmann, M.;; Muensterr, H.; Papp p, R.; Tayloor, L. J. Am m. Soc. Mass. Spe ectrom. 2009, 20, 144 41-1450.
523 524 525
FOR T TOC ONLY Y:
526 527
17