Sketch-Based Image Retrieval by Shape Points Description in Support Regions Houssem Chatbri and Keisuke Kameyama School of Systems and Information Engineering Department of Computer Science, University of Tsukuba {chatbri,
[email protected]}
I. I NTRODUCTION Sketch-Based Image Retrieval (SBIR) is the branch of Content-Based Image Retrieval concerned with the use of sketch images as queries to retrieve sketch or full color images. The SBIR paradigm offers to the user the possibility of expressing his/her thoughts with a drawing, which is of particular interest when the user is unable to express the query by text keywords, nor an example image is available. The particularity of SBIR lies in the difference between sketch images and full color images in the image content representation. While in full color images, the color information can be used as features, in sketch images only the shape information is available [1]. In addition, dealing with handdrawn sketches adds in the challenge of user drawing style variance [2]. In this work, we consider also the issue of noise that exist usually in sketch images [3]. The challenges listed above motivate the need for distinctive and robust shape features. Many approaches have been proposed for this purpose. Features for SBIR can be classified into local and global. Local features are distinctive but prone to noise, while global features are more robust against noise but less distinctive [4][5]. Many currently available methods for SBIR combine local and global features in order to reach a fair tradeoff between distinctiveness and robustness against noise. The Edge Relational Histogram (ERH) method [6][7], in particular, achieves good performances, comparing with other global and local methods. ERH works as follows: For each sketch point p, local features are extracted by representing the 8 connected neighbor pixels in a 3 × 3 matrix (the center is set to 0) in which 1 stands for a sketch point and 0 stands
(b)
255
(a)
Global features
Abstract—We introduce a statistical shape descriptor for Sketch-Based Image Retrieval. The proposed descriptor combines feature information in near and far support regions defined for each sketch point. Two feature values are extracted from each point, corresponding to near and far support regions from the point’s perspective, and used to populate a 2-D histogram representing the shape features of the sketch image. The boundary between the support regions is calculated accordingly to each sketch point, which makes the approach scale invariant. We report results of objective evaluation of the proposed approach regarding robustness against noise, and comparative evaluation with three state-of-the-art methods, using an image database of scanned handwritten alphabets, digits, mathematical symbols and expressions. Experimental results show that the proposed method has competitive distinctiveness and robustness against noise.
0
Local features
255
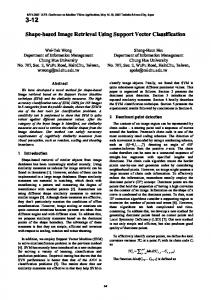
(c) Fig. 1. ERH’s sensitivity to noise: (a) A neat sketch. (b) A noisy sketch. 1 2 (c) illustrates overlapped ERH feature histograms, HERH and HERH , corresponding to images (a) and (b). The blue dots show overlapping non2 zero bins, while the red dots are non-zero bins existing only in HERH . 1 2 Correspondence between HERH and HERH is 10%.
for a background point. p’s global features are also stored in a 3 × 3 matrix in which every bin shows the number of sketch points located within a particular direction. The matrix is normalized and thresholded to generate a binary matrix. Next, a binary number is extracted from each of the two binary matrices by concatenating the 8 bin values starting from a starting bin in a counter-clockwise manner. Finally, the two binary numbers are converted to decimal and used to populate a 256 × 256 histogram. Sketch matching is done using the Histogram Intersection similarity measure [8]. ERH achieves the best performances when compared with two global methods and a local method [6][7]. In addition, the method is invariant to translation and scale, while rotation and symmetry invariance can be reached by generating multiple histograms per single image, corresponding to each orientation
Bin 3
Bin 2
Bin 1
p Bin 4
Bin 5
(a) Input skeleton image and point p 4
12
4
8
0
2
0
0
0 0
8
(e) fc(near)
(b) Sketch segmented using dmean corresponding to p 0
13
9
0.14
0
0
0
0
(f) fc(f ar)
0.42
0.28
Bin 6
Bin 7
(c) Feature extraction layout
0.14
0.25
0
0.06
0
0
(g) fn(near)
Bin 0
0
0.28
1
0
0
0
0
0.4
(h) fn(f ar)
(d) Feature extraction layout as seen from p 1
1
1
1
0
0
0
0
(i) fth(near)
0
1 0
1
0
(j) fth(f ar)
Fig. 2. Feature extraction process: (a) Input skeleton image and an arbitrary sketch point p. (b) Near region (green) and far region (blue) highlighted for point p. (c) Feature extraction layout. (c) Feature extraction layout as seen from p. (e) Near region’s sketch points count. (f) Far region’s sketch points count. (g) Near region’s feature after normalization. (h) Far region’s feature after normalization. (i) Near region’s feature after thresholding. The feature generates the binary number (01000100)2 . (j) Far region’s feature after thresholding. The feature generates the binary number (01001010)2 .
or symmetry. However, the method is sensitive to noise. Fig. 1 illustrates this issue: Both images in Fig.s 1(a) and 1(b) represent the capital letter ’T ’. However, because image 1(a) is neat and image 1(b) is significantly noisier, their corresponding histograms, illustrated in Fig. 1(c) look considerably different. This limitation is explained by the fact that noise changes the pixel-scale local details of a sketch drastically. In this work, we tackle ERH’s above described limitation. We follow a similar framework to ERH with introducing a new feature extraction mechanism. The outline of this manuscript is as follows: In Sec. II, we describe the proposed descriptor in details. Experimental results of comparative evaluation are discussed in Sec. III. Sec. IV concludes the paper. II. T HE PROPOSED APPROACH
IF distance(p, ps ) ≤ dmean THEN ps ∈ Near Region ELSE ps ∈ Far Region where ps is a sketch point. Sketch points located in each region are counted within 8 directions (Fig. 2(c) and Fig. 2(d)) to generate two 8-component features, fc(near) and fc(f ar) , relative to each region (Fig. 2(e) and Fig. 2(f)). Afterwards, a normalization is performed by dividing each 8-component feature by the sum of all bins of that feature, generating fn(near) and fn(f ar) (Fig. 2(g) and Fig. 2(h)). Then, a thresholding is performed to generate binary valued 8-component features, fb(near) and fb(f ar) (Fig. 2(i) and Fig. 2(j)): IF fn [k] < θ THEN fb [k] ← 0
A. Feature extraction
ELSE fb [k] ← 1
We aim to improve ERH by avoiding using pixel-scale details. Instead, we propose features that explore near and far information in two support regions as regarded from a sketch point. Our approach, Support Regions Descriptor (SRD), works as follows (Fig. 2): For each sketch point p the average distance, dmean , from p to all the other sketch points is first calculated as follows (Fig. 2(a) and Fig. 2(b)): dmean
Second, from the perspective of p, sketch points are classified into near region pixels and far region pixels, as follows:
N 1 X = distance(p, pi ) N i=1
(1)
where N is the total number of sketch points, pi is a sketch →: point and distance(p, pi ) returns the norm of the vector − pp i →k distance(pi , p) = k− pp i
(2)
where θ is the binarization threshold and k is the bin index of the 8-component feature. Next, the two binary 8-component features are used to generate two binary numbers, bnear and bf ar , by concatenating bins’ entries from a starting bin in an anti-clockwise direction (Fig. 2(i) and Fig. 2(j)). Finally, the two binary numbers are converted into decimal numbers dnear and df ar . The couple (dnear , df ar ) is used to populate a 256 × 256 feature histogram H. The feature histogram H is normalized by dividing by the sum of all bins. Fig. 3 shows the feature histogram of SRD which improves robustness against noise when compared with ERH. Although the sketch image in Fig. 1(b) contains a significant amount of noise comparing to the sketch image in Fig. 1(a), the correspondence between their respective histograms, generated
255 Far regions features
(a)
(b)
(c)
Fig. 4. Examples from the images used for experiments. (a) Original image. (b) Image (a) was thinned using [9] and belongs to Dataset 1. (c) Image (a) was thinned using [3] and belongs to Dataset 2.
0
Near regions features
255
(a)
Fig. 3. Our method’s robustness against noise: Overlapped feature histograms 1 2 of the proposed method, HSRD and HSRD , corresponding to images in Fig.s 1(a) and 1(b). The blue dots show overlapping non-zero bins, while the 2 red dots are non-zero bins existing only in HSRD . Correspondence between 1 2 HSRD and HSRD is 61%.
by SRD, is 61%, while being 10% in case of ERH. The similarity measure, defined in Sec. II-B, in this case was equal to 0.70, while in case of ERH it was equal to 0.24. B. Matching When a sketch query and a database sketch are to be matched, their corresponding feature histograms, H q and H db , are compared using the Histogram Intersection similarity measure [8], S, defined as follows: S=
255 X 255 X
q db min(Hgl , Hgl )
(3)
g=0 l=0
S takes real values in the interval [0, 1]. When two sketches are similar, S takes values near 1. Otherwise, S takes small values near 0. Because the near and far support regions are defined adaptively for each sketch point by calculating dmean , the approach is invariant to scale. Rotation invariance can also be introduced as in ERH [6][7] by generating multiple feature histograms for the query per rotation shift. In the next section, we evaluate SRD objectively and report comparative experimental results with three state-of-the-art methods. III. E XPERIMENTAL RESULTS We evaluate the effectiveness of SRD using a database of scanned images that contains 1431 images of handwritten alphabets, digits, mathematical symbols and mathematical expressions. The number of classes is 105 and the number of images per class ranges between 8 and 16 images. The images were collected by asking 8 subjects to imitate a sample of each class. Scale variance was introduced by asking the subject to introduce a same image in a different scale.
(b)
(c)
(d)
Fig. 5. Examples from the images used in Experiment 1. Pairs {(a), (b)} and {(c), (d)} represent the same image class with a scale difference.
We generate two thinned image datasets using two different thinning techniques on the original database: • Dataset 1: Generated using a conventional thinning algorithm [9]. Images in Dataset 1 are mostly affected by noise (Fig. 4(b)). • Dataset 2: Generated using Adaptive Thinning Framework (ATF) [3]. ATF was designed to produce neat thinned images less affected by noise (Fig. 4(c)). Throughout the experiments that follow, the binarization threshold was empirically chosen as θ = 0.125. A. Experiment 1 In this experiment, we aim to evaluate SRD’s robustness against noise. For this purpose, we match pairs of images from Dataset 1 and Dataset 2, that correspond to the same raw image in the original database: For instance, Fig. 4(c) is matched against Fig. 4(b). Then, we calculate the average value, Sa , of the distance measure S between corresponding thinned images. The average measure was Sa = 0.47 in case of ERH and Sa = 0.71 in case of SRD which gives an improvement factor of 1.5. This shows that the feature extraction mechanism introduced in SRD contributes to improving robustness against noise. B. Experiment 2 In this experiment, we evaluate SRD’s performances in regards to scale-invariance. We conduct a sketch matching experiment on 210 images. Each pair of images represents a same image class with two different scales. The scale difference is generated by taking an image that a subject has drawn in a different size (Fig. 5). We calculate the average value, Sa , of the distance measure S between corresponding pairs images. The average measure was Sa = 0.40 in case of ERH and Sa = 0.57 in case of SRD which gives an improvement factor of 1.4. This shows that the feature extraction mechanism introduced in SRD contributes to improving scale invariance.
C. Experiment 3 In this experiment, SRD is compared with Shape Context (SC) [10][11], Angular Partitioning (AP) [12] and Edge Relational Histogram (ERH) [6][7]. Retrieval is performed on Dataset 1 and Dataset 2. From each dataset, a query image was selected randomly from each class images to generate a 105 query dataset. Precision-recall graphs were obtained by varying the number of recalled images. Fig. 6 shows the precision-recall graphs of the 4 methods using the two datasets. Table I shows the Area Under the Curve (AUC) value corresponding to each method. TABLE I AUC VALUES USING DATASET 1 AND 2.
AUC using Dataset 1 AUC using Dataset 2
SRD 0.41 0.41
ERH 0.28 0.36
SC 0.31 0.32
AP 0.22 0.25
D. Discussion The proposed method, SRD, combines local and global features in order to improve distinctiveness and robustness against noise. The improvement over ERH lies in the feature extraction mechanism: In ERH, local pixel-scale features are used together with global features. While this has been shown to improve the method’s distinctiveness, it makes ERH prone to noise, as highlighted in Fig. 1. In SRD, we avoid the use of pixel-scale local features because of their sensitivity to noise. Instead, near and far support regions are used to collect information about the pixel distributions as seen from a sketch point. Experiment 1 demonstrates that this feature extraction mechanism improves robustness against noise. Another property of the introduced feature extraction mechanism is related to the way support regions are extracted; The border separating the two support regions is calculated dynamically for each sketch point, which is sketch size adaptive. Experiment 2 shows that scale invariance is improved over ERH. The size-adaptive scheme is however computationally heavier than ERH. The distinctiveness of SRD is evaluated by comparing it to ERH and two other well-known methods: Shape Context (SC) and Angular Partitioning (AP). Experiment 3 shows that SRD surpasses the other methods both when using noisy images and when using neat images. It is also interesting to notice that the performance of SRD remains nearly the same whether the data is noisy or neat, which shows that SRD is robust against noise and keeps high distinctiveness in presence of noisy data. IV. C ONCLUSION In this work, we proposed a shape descriptor for SketchBased Image Retrieval. The proposed approach uses a similar framework to ERH [6][7], with introducing a new feature extraction mechanism. We showed that relying on pixel-scale local features, as used in ERH, is sensitive to noise, and a better feature would be sketch points distribution in near and
Fig. 6. Precision-recall graphs corresponding to SRD, SC [10], AP [12] and ERH [6][7] using Dataset 1 and Dataset 2. AUC values are shown in Table I.
far support regions defined for each sketch point. Comparative evaluation with state-of-the-art methods [6][7][12][10] shows that the proposed approach is competitively distinctive and robust against noise. R EFERENCES [1] S. Liang and Z. Sun, “Sketch retrieval and relevance feedback with biased SVM classification,” Pattern Recognition Letters, vol. 29, no. 12, pp. 1733–1741, 2008. [2] R. Davis, “Magic paper: Sketch-understanding research,” Computer, vol. 40, no. 9, pp. 34–41, 2007. [3] H. Chatbri and K. Kameyama, “Towards making thinning algorithms robust against noise in sketch images,” in Proceedings of International Conference on Pattern Recognition. ICPR’12, 2012, pp. 3030–3033. [4] D. Zhang and G. Lu, “Review of shape representation and description techniques,” Pattern recognition, vol. 37, no. 1, pp. 1–19, 2004. [5] E. G. M. Petrakis, A. Diplaros, and E. Milios, “Matching and retrieval of distorted and occluded shapes using dynamic programming,” IEEE Transactions on Pattern Analysis and Machine Intelligence, vol. 24, no. 11, pp. 1501–1516, 2002. [6] Y. Kumagai, T. Arikawa, and G. Ohashi, “Query-by-sketch image retrieval using edge relation histogram,” in Proceedings of MVA2011 IAPR Conference on Machine Vision Applications, 2011, pp. 83–86. [7] Y. Kumagai and G. Ohashi, “Query-by-sketch image retrieval using edge relation histogram,” IEICE, vol. E96-D, no. 2, pp. 340–348, 2013. [8] M. Swain and D. Ballard, “Color indexing,” International journal of computer vision, vol. 7, no. 1, pp. 11–32, 1991. [9] F. Zhang, Y. Wang, C. Gao, S. Si, and J. Xu, “An improved parallel thinning algorithm with two subiterations,” Optoelectronics Letters, 2008. [10] S. Belongie, J. Malik, and J. Puzicha, “Shape context: A new descriptor for shape matching and object recognition,” Advances in neural information processing systems, pp. 831–837, 2001. [11] ——, “Shape matching and object recognition using shape contexts,” IEEE Transactions on Pattern Analysis and Machine Intelligence, vol. 24, no. 4, pp. 509–522, 2002. [12] A. Chalechale, G. Naghdy, and A. Mertins, “Sketch-based image matching using angular partitioning,” IEEE Transactions on Systems, Man and Cybernetics, Part A: Systems and Humans, vol. 35, no. 1, pp. 28–41, 2005.


![[PDF] Image Description and Retrieval (Advances in ... - Google Sites](https://m.moam.info/img/260x300/pdf-image-description-and-retrieval-advances-in-go_64784016097c47a9708c9e03.jpg)


