Data analytics of Facebook or Twitter data, the fundamental assumption of SNA that ..... we assembled a list of real-world events with respect to the. Bangladesh ...
Social Set Visualizer: A Set Theoretical Approach to Big Social Data Analytics of Real-World Events 1
Benjamin Flesch1 , Ravi Vatrapu1,2 , Raghava Rao Mukkamala1 , Abid Hussain1
Copenhagen Business School, Denmark and 2 Westerdals Oslo School of Arts, Comm & Tech, Norway {bf.itm, rv.itm, rrm.itm, ah.itm}@cbs.dk
Abstract—Current state-of-the-art in big social data analytics is largely limited to graph theoretical approaches such as social network analysis (SNA) informed by the social philosophical approach of relational sociology. This paper proposes and illustrates an alternate holistic approach to big social data analytics, social set analysis (SSA), which is based on the sociology of associations, mathematics of set theory, and advanced visual analytics of event studies. We illustrate our new approach by applying it to relate real-world events with their reflections in terms of user interactions on social media platforms. We present and discuss a theoretical and conceptual model of social data followed by a formal description of our technique based on set theory and event studies with a real-world social data example from Facebook. We then illustrate our new approach by reporting on the design, development, and evaluation results of a state-of-the-art visual analytics dashboard, the Social Set Visualizer (SoSeVi). Using SoSeVi, we conducted a real-world case study that consists of approximately 90 million Facebook user interactions from 11 different companies that have been mentioned in the traditional media in relation to the garment factory accidents in Bangladesh, and analyze the results. The enterprise application domain for the dashboard is corporate social responsibility (CSR) and the targeted end-users are CSR researchers and practitioners. The design of the dashboard was based on the social set analysis approach to computational social science mentioned above. The development of the dashboard involved cutting-edge open source visual analytics libraries (D3.js) and creation of new visualizations such as of actor mobility across time and space, conversational comets, and more. Evaluation of the dashboard consisted of technical testing, usability testing, and domain-specific testing with CSR students and yielded positive results. In conclusion, we discuss the new analytical approach of social set analysis and conclude with a discussion of the benefits of set theoretical approaches based on the social philosophical approach of associational sociology. Keywords—Big social data, Social set analysis, Big data visual Analytics, New Computational Models for Big Social Data.
I.
I NTRODUCTION
This paper introduces a new research approach situated in the domains of Data Science [1]–[3] and Computational Social Science [4] with practical applications to Big Social Data Analytics in organizations [5]–[7]. It addresses one of the important theoretical and methodological limitations in the emerging paradigm of Big Data Analytics of social media data [8]. In particular, it address the major limitation in existing research on Big Social Data analytics that computational methods, formal models and software tools are largely limited to graph theoretical approaches [9] (such as SNA [10]), and are informed by the social philosophical approach of relational sociology [11]. There are no other unified modeling approaches
to social data that integrate the conceptual, formal, software, analytical and empirical realms [12]. This results in a research problem when analyzing Big Social Data from platforms like Facebook and Twitter as such data consists of not only dyadic relations but also individual associations [13]. For Big Social Data analytics of Facebook or Twitter data, the fundamental assumption of SNA that social reality is constituted by dyadic relations and interactions that are determined by structural positions of individuals in social networks [14] is neither necessary nor sufficient [15]. For example, consider a Facebook post made on the official Facebook wall of Lionel Messi, the soccer prodigy who plays for FC Barcelona and Argentina’s national football team. Each official post by Messi to his Facebook page typically receives more than 100,000 likes, 25,000 comments and 18,000 shares. Such association-based and content-driven social media interactions involving large number of social actors are unlike the other social interactions such as face-to-face, email, phone and instant messaging in the sense that what binds the interacting social actors together in the first instance is not so much the relational ties (strong vs. weak ties) but associations ranging from the player himself, the teams that he plays for, to the cultural, ethnic, national and linguistic attributes. Modeling such Facebook interactions using affiliation networks creates the problem of an extremely low number of nodes with an extremely high number of nodes as spokes. Further, such SNA assumes the central social psychological concept of ”homophily” that social actors with similar interests (that is, associations) prefer to interact with each other. To overcome this limitation and address the research problem, this paper proposes an alternative holistic approach to Big Social Data analytics that is based on the sociology of associations and the mathematics of set theory and offers to develop fundamentally new methods and tools for Big Social Data analytics, Social Set Analysis (SSA). Our overarching research question is stated as, How, and in what way, can methods and tools for Social Set Analysis derived from the alternative holistic approach to Big Social Data analytics based on the sociology of associations and the mathematics of set theory result in meaningful facts, actionable insights and valuable outcomes? The rest of the paper is organized as follows. First, we present a philosophical template for holistic approaches to computational social sciences, compare and contrast the dominant approach of social network analysis with the proposed novel approach of social set analysis and discuss the benefits of set theoretical approaches based on the social philosophical approach of associational sociology in Sec II. As part of that, we also present and discuss a theory of and conceptual model
for big social data. Second, we outline a formal model of big social data based on set theory in Sec. III and describe our method in unambiguous manner using formal semantics. Fourth, we illustrate our new analytical approach by reporting on the design, development, and evaluation results of our state-of-the-art visual analytics dashboard, the Social Set Visualizer (SoSeVi) along with a case study on Bangladesh Factory Disasters in Sec. IV. Fifth and last, we discuss the findings from our illustrative case study, offer methodological and analytical reflections on social set analysis, identify its limitations, and outline future work directions. We have not provided any dedicated section for related work, but we have referred the relevant literature at appropriate places throughout the paper. II.
Social Network Analysis
Social Set Analysis
Basic Premise
There exists a relation between social actor A and social actor B
There exists an association by actor A with some entity E which can be an actor or an artifact
Social Action
Interpersonal Relations
Individual Actions
Unit of Analysis
Dyadic
Monadic, Polyadic
Social Structure
Networks
Sets
Mathematics
Graph Theory
Set Theory
Table I.
Dyadic
&
T WO P HILOSOPHIES OF C OMPUTATIONAL S OCIAL S CIENCES
T HEORETICAL F RAMEWORK
The theoretical concepts behind our proposed approach of Social Set Analysis are discussed here. A. Computational Social Science Large-scale and content driven social media platforms such as Facebook are of extreme importance to organizations in terms of marketing communications, corporate social responsibility, democratic deliberation, public dissemination and so on. Social media analytics in practice [6], [7], [16] has been based on an implicit, inherent and latent understanding of social associations as expressed by metrics and key performance indicators such as brand sentiment, brand associations, conversation keywords, reach and more. The theoretical aim of this project is to make a positive contribution in terms of an associational sociological approach to Big Social Data analytics, in order to address the twin problems of (a) largely absent academic research and (b) mostly latent industry practice on social media analytics, mainly from a sociology of associations in general and SSA in particular. As such, the primary scientific objectives of our approach is to theoretically formulate, mathematically model and empirically investigate an alternate holistic approach based on associational sociology [17], set and fuzzy set theories [18], and SSA [13]. To achieve these objectives, the theory of social data is developed which will be discussed next. The philosophical comparison between the traditional approach of SNA and the proposed new approach of SSA is shown in Table I. Our main criticism on the limitations of the relational sociology assumptions of SNA is that it is primarily focused on exploring structural relationships between social actors, whereas large-scale social media platforms are increasingly social content driven. B. Set Theoretical Big Social Data Analytics As articulated in [13], based on Smithson and Verkuilen [19] there are five advantages to applying classical set theory [20] in general and fuzzy set theory [18] in particular to computational social sciences: 1) Set-theoretical ontology (e.g. Fuzzy, Rough sets) is well suited to conceptualize vagueness, which is a central aspect of social science constructs. For example, in the social science domain of marketing, concepts such as brand loyalty, sentiment and customer satisfaction are vague.
2) Set-theoretical epistemology is well suited for analysis of social science constructs that are both categorical and dimensional. That is, a set-theoretical approach is well suited for dealing with different degrees of a particular type of construct. For example, social science constructs such as culture, personality, and emotion are all both categorical and dimensional. A set-theoretical approach can help conceptualize their inherent duality. 3) Set-theoretical methodology can help analyze multivariate associations beyond the conditional means and the general linear model. In addition, set theoretical approaches analyze human associations prior to relations and this allows for both quantitative variable centered analytical methods as well as qualitative case study methods. 4) Set-theoretical analysis has high theoretical fidelity with most social science theories, which are usually also logically expressed in terms of set theory. For example, theories on market segmentation and political preferences are logically articulated as categorical inclusions and exclusions that natively lend themselves to set theoretical formalization and analytics. 5) Set-theoretical approach systematically combines set-wise logical formulation of social science theories and empirical analysis using statistical models for continuous variables. For example, in the case of predictive analytics, it is possible to employ set and fuzzy theory to dynamically construct data points for independent variables such as brand sentiment (polarity, subjectivity, etc.).
Social Set Analysis (SSA) as employed in this paper is concerned with the mobility of social actors across time and space. For mobility across time, we conduct SSA of big social data from the Facebook walls of eleven companies from the same industry with an analytical focus on the set of actors that interacted with the company before, during and after the realworld events, and set theoretical intersections of the three time periods. Similarly, for mobility across space, we conduct set inclusions and exclusion of actors who interacted with different Facebook walls. This will allow us to uncover not only the interactional dynamics over time and space but also identify actor sets that correspond to marketing segmentations such as brand loyalists, brand advocates, brand critics and social activists.
C. Theory of Social Data Our theory of social data is drawn from the theory of sociotechnical interactions by Vatrapu [21]. Social media platforms such as Facebook and Twitter, at the highest level of abstraction, involve individuals interacting with (a) technologies and (b) other individuals. These interactions are termed sociotechnical interactions. There are two types of socio-technical interactions: 1) interacting with the technology per se (for example, using the Facebook app on the user’s smartphone) and 2) interacting with social others using the technology (for example, liking a picture of a friend in the Facebook app of the user’s smartphone). These socio-technical interactions are theoretically conceived as (a) perception and appropriation of socio-technical affordances, and (b) structures and functions of technological intersubjectivity. Briefly, socio-technical affordances are action-taking possibilities and meaning-making opportunities in an actor-environment system bounded by the cultural-cognitive competencies of the actor and the technical capabilities of the environment. Technological intersubjectivity (TI) refers to a technology supported interactional social relationship between two or more actors. A more detailed explication of the theoretical framework in terms of its ontological and epistemological assumptions and principles is beyond the scope of this paper but for details, please confer Vatrapu [21]. Socio-technical interactions as described above result in electronic trace data that is termed social data. In the previously discussed example of a Facebook user liking a friend’s picture on their smartphone app, the social data is not only rendered in the different timelines of the user’s social network but it is also available via the Facebook Graph API. Large volumes of such micro-interactions constitute the macro world of big social data that is the analytical focus of this paper. Based on the theory of social data described above, we present a descriptive model of social data below Social data consists of two types: Social Graph and Social Text. Social Graph maps on to the first aspect of sociotechnical interactions that involve perception and appropriation of affordances (which users/actors act up on which technological features to interact with what other social actors in the systems). Social Text maps on to the second aspect of socio-technical interactions that constitute the structures and functions and technological intersubjectivity (what the users/actors are trying to communicate to each other and how they are trying to influence each other through language).
an artifact, whereas an activity (e.g. promotion, campaign etc.) can spread across many actions, artifacts and actors. Social graph consists of the structure of the relationships emerging from the appropriation of social media affordances such as posting, linking, tagging, sharing and liking. It focuses on identifying the actors involved, the actions they take, the activities they undertake, and the artifacts they create and interact with. Social text consists of the communicative and linguistic aspects of the social media interaction such as the topics discussed, keywords mentioned, pronouns used and sentiments expressed. We now turn our attention to formalizing the conceptual model as we believe that formal models are essential for the application of computational techniques and tools, given not only the large volumes of data involved but also their ambiguity and unstructured nature. D. Event Study Methodology Event studies is a finance methodology to assess an impact on corporate wealth (e.g. stock prices) caused by events such as restructuring of companies, leadership change, mergers & acquisitions [22]–[24]. It has been a powerful tool since the late 1960s to assess financial impact of changes in corporate policies and used exclusively in the area of investments and accounting to examine stock price performance and the dissemination of new information [25]. While there is no unique structure for event study methodology, at a higher level of abstraction, it contains identifying three important time periods or windows. First, defining an event of interest and identifying the period over which it is active (event window), the second involves identifying the estimation period for the event (pre-event or estimation window) and the final one being identifying the post-event window [24]. In social set analysis of a real-world event, we have applied event study methodology to identify the three important time periods of user interactions on social media platforms: before (pre-event window), during (event window) and after (post-event window). III.
F ORMAL M ODEL
In this section, we will recall concise formal semantics for social data model from [12], [13], [26] and extend them suitably for formalising actor mobility across time and space. First, we define type of artifacts and actions in a sociotechnical system (Def. 3.1). Definition 3.1: We define R as a set of all artifact types as R = { wall, status } and ACT as a set of actions that can be performed as ACT = {post, comment, share, like, tagging}. The social data model contains Social Graph and Social Text, which is formally defined in Def. 3.2 as follows, Definition 3.2: Formally, Social Data is defined as a tuple S = (G, T) where
Figure 1.
Social Data Model
There is no distinction between a user and an actor in the model. With respect to action/activity, an action (e.g. post, comment, like etc.) is an atomic event done by an actor on
(i) G is the social graph representing the structural aspects of social data as defined further in Def. 3.3 (ii) T is the social text representing the content of social data and is further defined in Def. 3.4
The following definition describes the social graph formally, Definition 3.3: The Social Graph is defined as a tuple G = (U, R, Ac, rtype , B, !post , !share , !like , !tag , !act ) where (i) U, R, Ac are finite sets of actors, artifacts and activities respectively, (ii) rtype : R ! R is artifact type function and B : R * R is parent artifact function, (iii) !post : U * Pdisj (R) is a partial function mapping actors to mutually disjoint subsets of artifacts, (iv) !share , !like ✓ U ⇥ R are relations mapping actors to artifacts indicating the (v) !tag ✓ U ⇥ R ⇥ (P(U [ Ke)) is tag relation mapping artifacts to power sets of actors and keywords (vi) !act ✓ R⇥Ac is a relation mapping artifacts to activities. Each artifact is posted or created by a single actor, which is defined as a partial function (!post ) mapping actors to mutually disjoint sub sets of artifacts. On contrary, !share and !like allows many-to-many relationship, indicating that an artifact can be shared/liked by many actors and each actor can share/like many artifacts. The !tag relation is a bit different mapping actors, artifacts and power set of actors and keywords to allows an actor to tag other actors or keywords in an artifact. The definition of the Social Text is as follows, Definition 3.4: In Social Data S = (G, T), we define Social Text as T= (To, Ke, Pr, Se, !topic , !key , !pro , !sen ) where (i) To, Ke, Pr, Se are finite sets of topics, keywords, pronouns and sentiments respectively, (ii) !topic , !key , !pro , !sen ✓ R ⇥ To are relations defining mapping between artifacts to topics, keywords, pronouns and sentiments respectively. As shown in Def. 3.4, the definition of social text is quite straight forward as it contains four sets and four relations mapping them directly to artifacts. We define a time function that provide timestamp of an action in Def. 3.5, whereas notion of Facebook wall as a space is defined in Def. 3.6. Definition 3.5: With Social Data S, let T : (u, r, ac) 7! N be time function that keeps tracks of timestamp (t 2 N) of an action (ac 2 ACT ) performed by an actor (u 2 U) on an artifact (r 2 R). Definition 3.6: With Social Data S, let W be a set of Facebook walls such that each wall w 2 W.w 2 R^rtype (w) = wall. Definition 3.7: With Social Data S, we define match ✓ U ⇥ W as a relation associating actors to walls as follows,
match(u, w) =
8 > > > > > > > > > > > > > > > > > > > > > > > > > > >
if (u, w) 2!post
(1)
>
if ( , w) 2!post ^ (u, w) 2 (!like _ !share )
(2)
>
if 9r.(u, r) 2!post ^ r B w
(3)
>
if 9r.( , r) 2!post ^ r B w ^ (u, r) 2 (!like _ !share )
(4)
if 9r, r0 .( , r), (u, r0 ) 2!post ^ (r B w) ^ (r B r0 )
(5)
> > > > > > > > > > > > > > > > > > > > > > > > > > > > > : ?
if 9r, r0 .( , r), ( , r0 ) 2!post ^ (r B w) ^ (r B r0 ) ^ (u, r0 ) 2!like otherwise
(6) (7)
In the def. 3.7, we define a boolean function match that keeps track whether an actor (u) interacted with a Facebook wall (w) or not. It returns true (>), if the actor is the creator of the wall (1), or if he likes the wall (2), or if he posts messages on the wall (3). Similarly making comments on posts (5) or liking or sharing (4) of posts pertaining to wall or even liking a comment will also makes the actor to belongs to a wall as formally explained in Def. 3.7. In the analysis, the terms user and actor are used interchangeably throughout the paper without any difference in semantics. A. Mobility of Actors across Time As part of social set analysis, we have considered three different time frames for an event: before, during and after, which corresponds to pre-event, event and post-event timelines of the event methodology. For an event, sets containing unique actors who performed interactions during (Ud ), before (Ub ) and after (Ua ) are computed. Let tsd , tsb and tsa be the sets of time spans for during, before and after periods respectively. The during (Ud ) actors set contains the actors who have either posted or commented or liked an artifact in the preevent time period (tsd ), can be computed as below. Let ac 2 {post, comment}, then Ud = {u | 9r 2 R.(u, r) 2!post ^ T(u, r, ac) 2 tsd } [ {u | 9r 2 R.(u, r) 2!like ^ T(u, r, like) 2 tsd } [ {u | 9r 2 R.(u, r) 2!share ^ T(u, r, share) 2 tsd } where T(u, r, ac) and T(u, r, like) are timestamps of the respective actions. As indicated above the set Ud contains all the unique actors that have performed at least either a post, or a comment or a like or a share on an artifact during the event period. Similarly, the unique actor sets Ub and Ua can computed easily by replacing the tsd with tsb and tsa in the above equation, where the time stamp of the actions belongs to time spans: before (tsb ) and after (tsa ) the event period respectively. Finally intersections between actor sets (Ud , Ub , Ua ) are computed using standard set operations. As an example, the set of unique actors who have performed actions only during the event period (neither before nor after)
can be computed using the principle of Venn diagram as: Ud \ (Ud \ Ub ) [ (Ud \ Ua ) .
consumers and directly addressed to the respective clothing brands, which were in the consumers’ immediate reach through means of social media channels such as Facebook.
B. Mobility of Actors across Space
The factory disasters in Bangladesh prompted major consumer-facing textile industry brands like H&M and Walmart to join campaigns supporting textile workers’ rights in Bangladesh. A more sustainable, but lagging impact is felt by the introduction of better methods of supply chain management such as social contracts in supply chains [35].
In social set analysis, mobility across space corresponds to a notion of actors interacting with different Facebook walls. Given a set of Facebook walls (W), actors mobility across space can be computed as follows. UW = {u | 8w 2 W.match(u, w) = >} where UW is the set of actors who have interacted with all the walls in a given set of Facebook walls (w 2 W). Mobility across space is useful for analytical purposes in domains ranging from brand loyalty (actors who have visited only one wall) to social activism (actors who might be visiting many walls to express their protest over the companies). C. Mobility of Actors across Time and Space By combining mobility across time and space, we can compute the set of actors that have interacted within a specific time period (e.g. during event), who also have interacted with given set of walls (W) by taking intersection of two sets: W UW d = Ud \ U . IV.
T OOL AND C ASE STUDY: S OCIAL S ET V ISUALIZER AND BANGLADESH FACTORY D ISASTERS
The garment industry in Bangladesh is the second-largest exporter of clothing after China, and employs more than 3 million - mainly female - workers. This is emphasized by [27] in reference to a large factory fire in Bangladesh at the 25th of November 2012 which killed 112 workers. The garment industry in Bangladesh has rapidly grown during the past 20 years while approving of lax safety regulations and frequent accidents [28]. “Bangladesh’s garment sector [..] employs forty percent of industrial workers and earns eighty percent of export revenue. Yet the majority of workers are women. They earn among the lowest wages in the world and work in appalling conditions. Trade unions and associations face brutal conditions as labour regulations are openly flouted” [29]. At April 24th, 2013, factory disasters in the Bangladeshi garment sector culminated in the largest textile industry tragedy to date with the collapse of Rana Plaza, a factory building in an industrial suburb of Bangladesh’s capital Dhaka [30], in which more than 1100 garment workers died from the factory’s collapse and subsequent fires [31]. This event has been reported by media outlets all over the world and deeply shocked many end consumers of clothing products originating from Bangladesh. In various research publications, safety and struggles of workers in the Bangladesh garment industry have been widely discussed [29], also with special regard to ongoing protests [32], globalization-related problems [33] and ethical aspects of the factory disasters [34]. Nevertheless, the lack of publicly shown empathy by many major textile industry companies created a public outcry against perceived unethical behavior in textile industry supply chains. In many cases, this public outcry was expressed by
A. Methodology Our research methodology consisted of seven steps. First, we assembled a list of real-world events with respect to the Bangladesh factory accidents. Second, we created a list of the traditional news media (print newspapers, TV and radio) reports of the real-world factory accidents in Bangladesh. Third, we reviewed the media reports and extracted a list of 11 multi-national companies (as shown in Table. II) that have been frequently mentioned in the traditional media reports in relation to the Bangladesh garment factory accidents. Fourth, since strategic Corporate Social Responsibility communication is conducted by companies on their Facebook pages, we extracted the full archive of the social data from the Facebook walls of the 11 companies using SODATO [8]. Fifth, we designed, developed and evaluated the Social Set Visualizer dashboard of this Facebook corpus of approximately 180 million data points. Sixth, we addressed and answered a set of research questions using the dashboard. Seventh and last, we deployed the dashboard internally to support ongoing research by CSR researchers and practitioners. Table II.
OVERVIEW OF FACEBOOK DATASET OF R ETAIL CLOTHING COMPANIES
Facebook Wall
Posts
Comments
Likes
Total
1) Benetton
2,411
51,156
3,760,914
3,814,481
12,390
44,224
3,196,564
3,253,178
3,711
18,651
79,855
102,217
21,211
121,684
3,168,950
3,311,845
100,461
262,588
7,779,411
8,142,460
24,744
154,620
3,064,581
3,243,945
7) Mango
3,498
204,695
18,661,291
18,869,484
8) Primark
1,343
73,229
1,333,181
1,407,753
66
80
1,801
1,947
284,523
2,147,994
44,812,653
47,245,170
3,136
12,437
246,294
261,867
457,494
3,091,358
86,105,495
89,654,347
2) Calvin Klein 3) Carrefour 4) E.C. Ingles 5) H&M 6) JC Penny
9) PVH 10) Walmart 11) Zara Total:
B. Data Collection & Processing The event timeline of Bangladesh factory accidents and media reports was collected through desk research including systematic searches in web and media databases. Facebook data was collected through the Social Data Analytics Tool (SODATO) [36]–[38]. SODATO-provided Facebook activity datasets are generated as independent files for each company’s
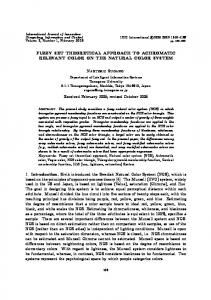
Facebook wall, and were combined into one for using them as a whole data set that can be filtered or expanded on demand. Figure 2 shows SoSeVi’s system schematic for the data acquisition, processing and visualization. The general concept follows the stages of the “Big Data Value Chain” introduced by Miller and Mork [39], with steps of preparation, organization and integration of the data prior to visualization and analysis. Data preparation tasks are performed in a preprocessing step which converts all CSV files to from their character encoding UTF-16 to the more commonly used UTF8 and handles edge cases in which the generated SODATO output lacks proper data type encapsulation. Subsequently, a data normalization phase performs sanity checks on the input data and identifies malformed data or unneeded information. Lastly, all distinct data sets are aggregated while conserving information regarding their original source in an additional variable. The aggregated data is then imported into a database management system (DBMS), from which it can be accessed for visual analytics purposes.
display both on a 4K display used in a conference room and a normal tablet. Performance: A key objective for the visual analytics dashboard displays the performance in terms of both server and client side software components. As the dashboard needs to deal with large-scale data sets it should be able to process the data efficiently. In order to achieve higher performance sharing of data processing between server and client software components needs to be established. Thereby, workload may be shifted as needed and user interface waiting times are reduced. Ease of Use: For end users, ease of use depicts an important non-functional requirement. The visual analytics dashboard should be designed in a way that enables users to work with the dashboard without any prior briefing or training on how to use it. Extensibility: Lastly, during realization of the visual analytics dashboard, an extensible framework should be used so that future changes can be implemented with only moderate effort and without unnecessary technical hindrances. 2) Design Principles: The design of a visual analytics dashboard such as SoSeVi needs to follow a set of core principles, through which the above stated goals can be achieved. The following design principles are adopted: Detail on Demand: The detail on demand principle strives to first present an easily graspable overview to the user, as that it can be processed visually and intellectually in short time. Only subsequently, when the user decides to, the level of detail shown in the visual analytics tool can be increased. Ready-made Visualizations: The SoSeVi Visual Analytics dashboard is based on social media data from Facebook. The dashboard may consist of a combination of multiple visualizations and each visualization needs to highlight unique features of the underlying social interactions between actors and artifacts. This allows the dashboard as a whole to be kept clean and organized, preventing it from becoming too complex.
Figure 2. Big Data Acquisition Pipeline of the Social Data from Facebook used later on in the Visual Analytics Tool
C. Design In this section, the design process of the visual analytics dashboard of SoSeVi is outlined. 1) Design Goals & Objectives: The visual analytics dashboard has the following design goals. Multidimensionality: A visual analytics dashboard consists of a mash-up of multiple visualizations which can be utilized by the user in combination to maximize efficiency. The type and size of each visualization need to be carefully evaluated. Accessibility: The dashboard should be accessible as easily as possible for users. It should therefore have as few hard dependencies in terms of installed software, operating system or device type as possible. Responsiveness: The dashboard needs to be responsive to different device types and screen sizes. It should be able to
User-centric Design (UCD): [40] emphasizes that in user-centric design, “the role of the designer is to facilitate the task for the user and to make sure that the user is able to make use of the product as intended and with a minimum effort to learn how to use it”. When designing the interface, a focus is put on optimization of the user experience. 3) SoSeVi: Visualization Framework: The technology choice for realizing the dashboard visualizations is the D3.js Javascript-based visualization framework which uses dynamic SVG images for data visualization. D3.js constitutes a lightweight and very extendable Javascript visualization framework which can display visualizations for a multitude of browser-based clients. The flexibility provided by D3.js enables the creation of new kinds of interactive visualizations which are able to run on any device with decent processing resources including Windows, MacOS and Linux based systems with screen sizes up to 4K devices. Figure 3 presents the software architecture of SoSeVi. DashboardView is the main view of the web application which contains the SoSeVi and is initially shown to the user. RawdataView presents a detailed search interface for the
about different types of events which are part of the event timeline. In the case at hand, the event timeline is based on the Bangladesh factory disaster events, which means that the event types classified are encoded in the legend.
Figure 3.
Software Architecture
Facebook activity data. Many visualizations in DashboardView refer to RawdataView in order to provide the user with further information. ActorsView presents a dedicated interface for analysis tasks related to Actor Mobility across time and space of companies’ facebook walls. The visualizations of actor mobility in DashboardView refer to ActorsView in order to provide the user with further details when requested. Furthermore, ActorsView presents a handy set of tools for analysis of actor mobility and cross-postings between different time frames and Facebook walls.
The user-driven filtering interface contains two components. On the left hand side, the user may input start and end dates of the timeframe to be visualized in the dashboard. Mouse or touch interactions with the input fields will reveal a hidden date picker component. This date picker enables the user to either input dates using a keyboard or specifying the day, month and year using their mouse or even a touch screen. Secondly, on the right hand side, the user may select the companies whose Facebook walls are shown in the dashboard. User interaction with the available input field can be performed in various ways. The user can directly type Facebook walls into the field, which are then displayed in the visualization. An alternative method is that the user selects an item from a drop down menu that ap-pears when the input field is focused. To summarize, the SoSeVi big data visual analysis dashboard empowers users to use it in different ways. The dashboard adheres to the user’s preferred interaction method without making any assumptions. This means tablet users may also type in their selection of the Facebook walls, or desktop users may use the Datepicker to manually select a date. The dashboard may be accessed at http://5.9.74.245:3000/, access credentials will be provided to the research community upon request.
D. Development of SoSeVi: Dashboard Interface
E. Evaluation
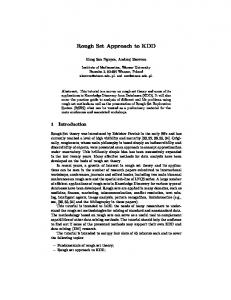
Figure 4 presents the SoSeVi dashboard and its constituent visualizations for the full dataset.
Benchmarking: Figure 5 displays benchmarking results of the dashboard’s underlying API. The results underline the varying complexity in calculating data needed for the visualizations of different event windows. According to the presented benchmark, visualizations of conversation content (ChartLanguageDistribution and ChartWordCloud) are much faster calculated and presented to the dashboard user than visualizations of actor mobility (ChartVennDiagram, ChartActorsOverlap). This can be explained by the fact that visualizations of Actor Mobility need to take each single actor into account, whereas visualizations of conversation content have access to much better speed improvements through precalculated datasets which derive from the main dataset. Due to the bad benchmark results of ChartVennDiagram, and a general discrepancy in performance, further optimizations are performed to the database as described further.
The Facebook activity visualization displays the social media activity on Facebook over the whole time period. It consists of a large main chart and a smaller mini chart underneath. Both charts use a line plot to display activity. The mini-chart can be used as a brush to change the time period of the data shown in the main chart. The Actor Mobility across Space visualization at the top right of the dashboard displays the number of different Facebook walls on which Actors have posted. For this visualization, a bar chart is used. The chart depicts the number of Actors based on the number of Facebook walls they have posted to. The Actor Mobility across Time visualization at the center right of the dashboard displays the number of Actors within each time period and their respective overlaps. For this visualization, an exploded Venn diagram is used which is aligned hexagonally. The Language Distribution visualization at the bottom right of the dashboard displays the number of social media Artifacts based on their language. For this visualization, a bar chart is used. It presents each language and the respective number of social media activities during the selected timeframe. The Word Cloud visualization located right beneath the Facebook Activity chart displays the results of the word frequency analysis based on conversation artifacts in the available social data. The font size of each word is determined by its overall frequency within all conversations that happened during the selected time period. A Legend for the event timeline is placed at the very top of the dashboard between the user-driven filtering interface and the Facebook Activity visualization. It conveys information
Randomized API Benchmark ChartWordCloud
227
ChartLanguageDistribution
110
ChartActorsOverlap
1,410
ChartVennDiagram
8,260 0
2,000
4,000
6,000
8,000
Average Response Time [ms]
Figure 5.
Performance Benchmark of four API Endpoints
Query Optimization: When using a RDBMS such as PostgreSQL in big data analytics, many opportunities for
Figure 4. Social Set Visualizer: For the selected time period (see date range fields in top-left) and selected facebook walls (see colour coded selection bubble chart next to visualizations) [1] Facebook Activity Chart; [2] Timeline of Bangladesh Factory Accidents & Facebook Actions; [3] Word Cloud of Text from Posts and Comments; [4] Actor Mobility across Space (Facebook walls); [5] Actor Mobility across Time (before, during, after time-period of selection and combinations of them); and [6] Language Distribution
increased performance can be realized through query optimization. The systematic optimization of slow database queries is demonstrated on the visualization of Language Distribution. All optimizations are benchmarked against the initial query in order to assess their effectiveness. The benchmarking process follows a strict methodology, in which each query will be executed n = 10 times and query execution time is logged. Then, the average execution time is used to decide on the feasibility of the optimization at hand. If the average execution time is reduced, the optimization step will be applied to the query. The optimization process may be repeated until sufficient reduction of the average query execution time is reached. Out of all queries, the language distribution query was identified as a very slow query and therefore we have performed optimizations on it. The initial query is displayed in Listing 1. It returns 24 rows after an execution time of approximately 10 seconds, which is way slower than the users’ anticipated loading time of a visual analytics dashboard. Based on the precalculation of as much data as possible and separating this data into its own database table, we optimized the performance of the query as shown in Listing 2. Listing 1. 1 2 3 4 5
Initial Query for Language Distribution
SELECT lang, COUNT(*) as count FROM fbdata WHERE eventname != ’LIKE’ AND "date" BETWEEN ’2009-01-01’ AND ’2014-06-12’ AND source in (’carrefour’, ’walmart’) GROUP BY lang ORDER BY count DESC;
5 6 7 8 9
SELECT lang, sum(count) as count FROM fbdata_language_distribution WHERE "date" BETWEEN ’2009-01-01’ AND ’2014-06-12’ AND source in (’carrefour’, ’walmart’) GROUP BY lang ORDER BY count DESC;
This performance improvement of the database query shown in listing 2 is based on the fact that the new query does not need to access the much larger f bdata table, but only uses a small subset which is available in the derived table. In the second round, further optimization are performed on the query in listing 2 by creating indexes on suitable columns such as datetime and others. After creation of the indexes on the derived table, the performance of the query is increased marginally as shown in Fig. 6. A performance improvement of 300 times was realized in the first optimization, whereas the second optimization step yielded only a 1.77 times improvement. Performance Optimization Steps Initial Performance
11,285.44
First Optimization
36.76
Second Optimization
20.75 0
Listing 2. 1 2 3 4
First Optimization of Language Distribution Query
CREATE TABLE fbdata_language_distribution AS SELECT date, source, lang, count(*) as count FROM fbdata GROUP BY date, source, lang ORDER BY date, source, lang ASC;
0.2
0.4
0.6
0.8
1
Average Query Runtime [ms]
1.2 ·104
Figure 6. Three-Step Performance Optimization of the Language Distribution Visualization
V.
D ISCUSSION
In this section, we first report a selected list of empirical findings generated from the tool and then discuss the substantive aspects of the set theoretical approach for big social data analytics. We conclude with limitations of our work and future research directions. A. Selected Empirical Findings from SoSeVi Due to space restrictions, we present only a subset of the empirical findings resulting from the use of the Social Set Visualizer (SoSeVi) tool by researchers and practitioners in the field of Corporate Social Responsibility (CSR). These empirical findings demonstrate the analytical utility of our proposed set theoretical approach to big social data and our social set analysis approach to visual analytics dashboards. The following points outline some of the key issues that were investigated using the SoSeVi: 1) The global supply chain concerns with regard to Bangladesh garment factories have been expressed by Facebook users from as far back as 2009 2) With regard to “Social Text” analysis of big social data, the distribution of the keyword “bangladesh” across time and space of 11 different Facebook walls is proportional to the severity of fatalities in Bangladesh garment factories and peaks for the Rana Plaza disaster that killed more than 1100 factory workers. 3) With regard to “Social Graph” analysis of big social data, in terms of actors, SoSeVi helped identify the most influential negative critics as well as positive advocates for each of the 11 companies before, during, and after the maximum accident density time period 4) There are many instances of authentic displays of support and expressions of empathy from Facebook users as well as robotic incidents of slacktivism 5) Surpisingly, majority usage the keyword please was with respect to opening of new stores in the case of H&M 6) Protestors and activists employed different social media strategies on the different Facebook walls of companies but with little evidence for social influence (in terms of the number of likes and comments on their posts) 7) Companies followed not only different CSR strategies but also different social media strategies before, during and after the Bangladesh garment factory accidents. Further, companies adopted different crises communication and management strategies yielding different outcomes 8) For almost all of the accidents, a majority of the users are posting during the news cycle, e.g. the coverage of the event through traditional media outlets, and they do not return to the Facebook walls again. This emphasizes that social media engagement during factory accidents is episodic and burst-y with little overlap to the businessas-usual period before or after the accident. B. Reflections on the IT-Artifact Computational social science research has reached a point where social media activity is ubiquitous yet hard to collect and analyze in domain-specific ways (with the notable exception of epidemiology). In conjunction with complex event timelines as depicted by the Bangladesh garment factory
disasters, the data at hand presents numerous opportunities for attaining deep insights. In this context, visual analytics present the means of reaching those insights to many users with different backgrounds, both experts and novices alike. The novel implementation of the present Social Set Visualizer (SoSeVi) dashboard showcases that the creation of visual analytics software, which meets the high technical, analytical and user experience requirements of present-day computing, is viable (and can be achieved by an academic research group with limited resources). Furthermore, the developed IT artifact leverages open-source visual analytics frameworks to maximum extent in order to achieve a pure implementation of important concepts in visual analytics. C. Reflections on the Set Theoretical Approach The current paradigm in computational social science is dominated by a theoretical focus on relationships of actors and artifacts, and the mathematical modeling of those relationships as social networks based on graph theory. This leads to the big social data triumvirate of relational sociology (as candidate social philosophy), graph theory (as candidate mathematical and formal model), and social network analysis (as candidate analytical framework). Our argument is not that relational sociology, graph theory, and social network analysis are invalid or ineffective. Social Network approaches have proven their analytical suitability and ability in diverse application domains ranging from epidemiology to organizational behavior. Instead, our argument is that other candidate sociological approaches, mathematical theories, and analysis techniques need to be explored to further advance the field of computational social science. After all, relational sociology is just one of the many competing and co-existing theories in sociology describing, explaining and predicting social phenomena; along with process, ethnomethodology, structuration, identity, structural functionalism, cognitive and cultural theories. Our paper’s primary contribution to not only to offer an alternate holistic approach of social theory (associations), mathematics (set theory), and analytics (social set analysis ) but also to demonstrate its technical viability, suitability and utility by designing, developing and evaluating an IT-artifact, the Social Set Visualizer (SoSeVi). In other words, we postulated and - hopefully - illustrated that Set Theory in general is better suited from a mathematical standpoint to model human social associations than network theory or graph theory. Beyond the immediate social network and particularly on large scale social media platforms such as Facebook, Twitter and Tencent QQ, we believe, and hope, that this fundamental change in the foundational mathematical logic of the formal model from graphs to sets will allow for new insights. D. Limitations One of this paper’s limitations is that we do not present domain-specific empirical findings in terms of crisis communication, crisis management, labor rights, industrial safety and/or corporate social responsibility. That said, such domain-specific empirical findings of the set theoretical approach can be found in [41], [42]. A second limitation is the lack of exposition of the full range of set theoretical approaches beyond the classical ”crisp sets” discussed in the paper (for example: fuzzy sets, rough sets, random sets, Bayesian sets). A third and final
limitation is the limited space devoted to the technical aspects of the IT-artifact.
[20] [21]
E. Future Research Current and planned future work in our computational social sciences lab is addressing some of the theoretical limitations identified above in terms of developing formal models and analytical methods for fuzzy, rough and random sets. Furthermore, we are planning on releasing a software library for “Social Set Analysis” that will allow researchers and practitioners to easily integrate set theoretical analytics into their big data analytics workbenches.
[22] [23] [24] [25]
R EFERENCES [1]
[2] [3]
[4]
[5] [6] [7] [8] [9] [10] [11] [12]
[13] [14] [15] [16] [17] [18] [19]
W. S. Cleveland, “Data science: an action plan for expanding the technical areas of the field of statistics,” International Statistical Review, vol. 69, no. 1, pp. 21–26, 2001. [Online]. Available: http://dx.doi.org/10.1111/j.1751-5823.2001.tb00477.x 1 M. Loukides, What Is Data Science? O’Reilly Media, 2012. 1 N. Ohsumi, “From data analysis to data science,” in Data Analysis, Classification, and Related Methods. Springer Berlin Heidelberg, 2000, pp. 329–334. [Online]. Available: http://dx.doi.org/10.1007/ 978-3-642-59789-3 52 1 D. Lazer, A. Pentland, L. Adamic, S. Aral, A.-L. Barabsi, D. Brewer, N. Christakis, N. Contractor, J. Fowler, M. Gutmann, T. Jebara, G. King, M. Macy, D. Roy, and M. Van Alstyne, “Computational social science,” Science, vol. 323, no. 5915, pp. 721–723, 2009. 1 R. Vatrapu, “Understanding social business.” in Emerging Dimensions of Technology Management. Springer, 2013, pp. 147–158. 1 J. Sterne, Social media metrics: How to measure and optimize your marketing investment. John Wiley & Sons, 2010. 1, 2 M. Sponder, Social media analytics: effective tools for building, intrepreting, and using metrics. McGraw-Hill, 2012. 1, 2 Z. Tufekci, “Big questions for social media big data: Representativeness, validity and other methodological pitfalls,” arXiv preprint arXiv:1403.7400, 2014. 1 J. L. Gross and J. Yellen, Graph theory and its applications. CRC press, 2005. 1 S. P. Borgatti, A. Mehra, D. J. Brass, and G. Labianca, “Network analysis in the social sciences,” Science, vol. 323(5916), pp. 892–895, 2009. 1 M. Emirbayer, “Manifesto for a relational sociology,” The American Journal of Sociology, vol. 103(2), pp. 281–317, 1997. 1 R. R. Mukkamala, A. Hussain, and R. Vatrapu, “Towards a formal model of social data,” IT University of Copenhagen, Denmark, IT University Technical Report Series TR-2013-169, November 2013. 1, 3 ——, “Towards a set theoretical approach to big data analytics,” in 3rd International Congress on Big Data (IEEE BigData 2014), June 2014. 1, 2, 3 M. S. Mizruchi, “Social network analysis: Recent achievements and current controversies,” Acta sociologica, vol. 37, no. 4, pp. 329–343, 1994. 1 R. Vatrapu, R. R. Mukkamala, and A. Hussain, “A set theoretical approach to big social data analytics: Concepts, methods, tools, and findings,” in ECCS Satellite Workshop 2014, 2014, pp. 22–24. 1 J. Lovett, Social media metrics secrets. John Wiley & Sons, 2011, vol. 159. 2 B. Latour, Reassembling the Social: An Introduction to Actor-NetworkTheory. Oxford University Press, USA, 2005. 2 C. C. Ragin, Fuzzy-set social science. University of Chicago Press, 2000. 2 M. J. Smithson and J. Verkuilen, Fuzzy Set Theory : Applications in the Social Sciences (Quantitative Applications in the Social Sciences). SAGE Publications, Feb. 2006. [Online]. Available: http://www.worldcat.org/isbn/076192986X 2
[26]
[27] [28] [29] [30]
[31] [32] [33] [34] [35] [36] [37]
[38]
[39] [40] [41] [42]
A. Kechris, Classical descriptive set theory. Springer Science & Business Media, 2012, vol. 156. 2 R. K. Vatrapu, “Explaining culture: An outline of a theory of sociotechnical interactions,” in Proceedings of the 3rd International Conference on Intercultural Collaboration, ser. ICIC ’10. New York, NY, USA: ACM, 2010, pp. 111–120. 3 P. Bromiley, M. Govekar, and A. Marcus, “On using event-study methodology in strategic management research,” Technovation, vol. 8, no. 1, pp. 25–42, 1988. 3 A. McWilliams and D. Siegel, “Event studies in management research: Theoretical and empirical issues,” Academy of management journal, vol. 40, no. 3, pp. 626–657, 1997. 3 A. C. MacKinlay, “Event studies in economics and finance,” Journal of economic literature, pp. 13–39, 1997. 3 J. Binder, “The event study methodology since 1969,” Review of quantitative Finance and Accounting, vol. 11, no. 2, pp. 111–137, 1998. 3 R. Mukkamala, A. Hussain, and R. Vatrapu, “Fuzzy-set based sentiment analysis of big social data,” in Enterprise Distributed Object Computing Conference (EDOC), 2014 IEEE 18th International, Sept 2014, pp. 71– 80. 3 V. Bajaj, “Fatal fire in bangladesh highlights the dangers facing garment workers,” New York Times, vol. 25, 2012. 5 H. Sato, “Cournot competition and reduction of corruption to prevent garment factory fires in bangladesh,” Advances in Management and Applied Economics, vol. 4, no. 4, pp. 17–20, August 2014. 5 P. Khanna, “Making labour voices heard during an industrial crisis: Workers’ struggles in the bangladesh garment industry,” Labour, Capital and Society/Travail, capital et soci´et´e, pp. 106–129, 2011. 5 J. A. Manik, J. Yardley, and B. DHAKA, “Building collapse in bangladesh leaves scores dead,” NY TIMES (Apr. 24, 2013), http://www. nytimes. com/2013/04/25/world/asia/bangladesh-buildingcollapse. html, 2013. 5 J. Burke, “Bangladeshi factory collapse leaves trail of shattered lives,” The Guardian, 2013. 5 S. A. Himi and A. Rahman, “Workers unrest in garment industries in bangladesh: An exploratory study,” Journal of Organization and Human Behaviour, vol. 2, no. 3, pp. 49–55, 2013. 5 S. Rahman, Broken Promises of Globalization: The Case of the Bangladesh Garment Industry. Lexington Books, 2013. 5 K. L. Stewart, “An ethical analysis of the high cost of low-priced clothing,” NABET, p. 128, 2013. 5 M. A. Islam, C. Deegan et al., “Social audits and multinational company supply chain: A study of rituals of social audits in the bangladesh garment industry,” Available at SSRN 2466129, 2014. 5 A. Hussain and R. Vatrapu, “Social data analytics tool (sodato),” in DESRIST 2014, ser. Lecture Notes in Computer Science (LNCS). Springer, vol. 8463, 2014, pp. 368–372. 5 ——, “Social data analytics tool: Design, development, and demonstrative case studies,” in Enterprise Distributed Object Computing Conference Workshops and Demonstrations (EDOCW), 2014 IEEE 18th International, Sept 2014, pp. 414–417. 5 A. Hussain, R. Vatrapu, D. Hardt, and Z. Jaffari, “Social data analytics tool: A demonstrative case study of methodology and software.” in Analysing Social Media Data and Web Networks. Palgrave Macmillan, 2014. 5 H. G. Miller and P. Mork, “From data to decisions: a value chain for big data,” IT Professional, vol. 15, no. 1, pp. 57–59, 2013. 6 C. Abras, D. Maloney-Krichmar, and J. Preece, “User-centered design,” Bainbridge, W. Encyclopedia of Human-Computer Interaction. Thousand Oaks: Sage Publications, vol. 37, no. 4, pp. 445–56, 2004. 6 R. R. Mukkamala, J. I. Srensen, A. Hussain, and R. Vatrapu, “Detecting corporate social media crises on facebook using social set analysis,” in Proceedings of IEEE Bigdata Congress, 2015. 9 ——, “Social set analysis of corporate social media crises on facebook,” in Proceedings of IEEE 19th International Enterprise Distributed Object Computing Conference (EDOC), 2015. 9