SOFTWARE METRICS AND DATA COLLECTION IN TERMS OF. FAULTS, FAILURES AND CHANGES PROBLEMS. Ajay Kumar, Mewar University, Chittorgarh, ...
International Association of Scientific Innovation and Research (IASIR) (An Association Unifying the Sciences, Engineering, and Applied Research)
ISSN (Print): 2279-0063 ISSN (Online): 2279-0071
International Journal of Software and Web Sciences (IJSWS) www.iasir.net SOFTWARE METRICS AND DATA COLLECTION IN TERMS OF FAULTS, FAILURES AND CHANGES PROBLEMS Ajay Kumar, Mewar University, Chittorgarh, Rajasthan (India) Seema Bawa, Thapar University, Patiala, Punjab (India)
___________________________________________________________________________ Abstract: We present an overview of current research in automotive software metrics data collection, focusing on efforts underway in the software development in terms of faults, failures and changes. Using some new techniques, we are able to collect accurate data so that we can easily measure our project errors free and also taking very less time and efforts. Such new techniques can be used by software analyst/engineer can easily extract and evaluate data in flexible manner. Generally, raw data concern with most common problems such as faults, errors, defects, anomalies and bugs. In this regards we apply some new automotive techniques for software metrics data collection so that we can easily define data and collect data in appropriate way. In this research paper we also define some observation of software development, testing, system operation and maintenance problems in terms of faults, failures and changes. Whenever a problem is observed, its key elements are automatically recorded, and finally we can investigate causes and cures in appropriate way. Keywords: Metric, Data identifier, Fault and Failure, Changes, GQM, Data collection, Error Severity. ______________________________________________________________________________________ I. INTRODUCTION Software metrics are often not absolute; they provide us with a systematic way to assess quality based on a set of clearly defined rules. They also provide the software engineer with on-the-spot, rather than after-the-fact insight. This enables the engineer to discover and correct potential problems before they become catastrophic defects. We consider measures that can be used to assess the quality of the product as it is being engineered. These measures of internal product attributes provide the software engineer with real time indication of the efficacy of the analysis, design, and code models; the effectives of test cases; and the overall quality of the software to be built. Here, we will agree that high-quality software is an important goal. Every software analyst and developers are also agreeing with this point. But the main question is raised how do we define quality? Quality to be “striving for excellence in reliability and functions by continuous improvement in the process of development, supported by statically analysis of the causes of failure” Quality as “high level of user satisfaction and low level of faults/defects, often associated with low complexity”. The next question how quality can be achieved? In this regards we have to collect some metrics for grading the software quality and also some observation of software development, testing, system operation and maintenance problems in terms of faults, failures and changes. This research paper defines the good data, its associated attributes, complete observation and new techniques for data collection. There are many different types of customers for a metrics program. This adds complexity to the program because each customer may have different information requirements [1]. Customers may include: (a) Functional Management: Interested in applying greater control to the software development process, reducing risk and maximizing return on investment. (b) Project Management: Interested in being able to accurately predict and control project size, effort, resources, budgets and schedules. Interested in controlling the projects they are in charge of and communicating facts to their management. (c) Software Engineers/Programmers: The people that actually do the software development. Interested in making informed decisions about their work and work products. These people are responsible for collecting a significant amount of the data required for the metrics program. (d) Test Managers/Testers: The people responsible for performing the verification and validation activities. Interested in finding as many new defects as possible in the time allocated to testing and in obtaining confidence that the software works as specified. These people are also responsible for collecting a significant amount of the required data. (e) Specialists: Individuals performing specialized functions (e.g., Marketing, Software Quality Assurance, Process Engineering, Software Configuration Management, Audits and Assessments, Customer Technical Assistance). Interested in quantitative information upon which they can base their decisions, finding and recommendations. (f) Customers/Users: Interested in on-time delivery of high quality software products and in reducing the overall cost of ownership. If a metric does not have a customer, it should not be produced.
IJSWS 14-134; © 2014, IJSWS All Rights Reserved
Page 42
Ajay Kumar et al., International Journal of Software and Web Sciences, 7(1), December 2013- February 2014, pp. 42-47
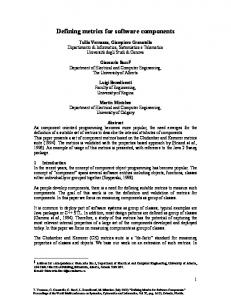
II. What are Software Metrics? Software metrics are an integral part of the state-of-the-practice in software engineering. More and more customers are specifying software and/or quality metrics reporting as part of their contractual requirements. Industry standards like ISO 9000 and industry models like the Software Engineering Institute’s (SEI) Capability Maturity Model Integrated (CMMI®) include measurement. Companies are using metrics to better understand, track, control and predict software projects, processes and products [1][2]. III. Some Basic Measurement Theory The use of measurement is common. We use measurements in everyday life to do such things as weigh ourselves in the morning or when we check the time of day or the distance we have traveled in our car. Measurements are used extensively in most areas of production and manufacturing to estimate costs, calibrate equipment, assess quality, and monitor inventories [6]. Science and engineering disciplines depend on the rigor that measurements provide, but what does measurement really mean? According to Fenton, "measurement is the process by which numbers or symbols are assigned to attributes of entities in the real world in such a way as to describe them according to clearly defined rules". An entity is a person, place, thing, event or time period. An attribute is a feature or property of the entity. To measure, we must first determine the entity. For example, we could select a car as our entity. Once we select an entity, we must select the attribute of that entity that we want to describe. For example, the car’s speed or the pressure in its tires would be two attributes of a car. Finally, we must have a defined and accepted mapping system. It is meaningless to say that the car’s speed is 65 or its tire pressure is 75 unless we know that we are talking about miles per hour and pounds per square inch, respectively. Software entities of the input type include all of the resources used for software research, development, and production. Each of these software entities has many properties or features that we might want to measure. We might want to examine a computer's price, efforts, performance, or usability. We could look at the time or effort that it took to execute a process, the number of incidents that occurred during the process, its cost, controllability, stability, or effectiveness. We might want to measure the complexity, size, modularity, testability, usability, reliability, error-free, accuracy or maintainability of a piece of source code [3]. So, software metrics programs must be designed to provide the specific information necessary to manage software projects and improve software engineering processes and services [4][10]. IV. DATA AND PROBLEMS TERMINOLOGY There are really two kinds of data with which we are concerned: Raw data results from the initial measurement of process, product or resource. But there is also a refinement process, extracting essential data elements from the raw data so that analysts can derive values about attributes.
Fig. 2: Process of defining data A. Good Data Good data concern with following attributes: Correctness: It means that the data were collected according to the exact rules of definition of the metric. Accuracy: It refers to the difference between the data and the actual data. Consistent: Data should be consistent from one measuring device or person to another, without large differences in value. Thus, two evaluators should calculate the same or similar function-point values from the same requirements document. Precision: It deals with the number of decimal places needed to express the data. Associated: It should be associated with a particular activity or time period. Also, data should be time-stamp, so that we know exactly when were collected. This association of values allows they were collected. This association of values allows us to track trends and compare activities. Replicated: All types of data related to project are stored in a historical database, so that baseline measure can be established and organizational goals set [5]. Thus, it is very important to access the quality of data and data collection before data collection begins.
IJSWS 14-134; © 2014, IJSWS All Rights Reserved
Page 43
Ajay Kumar et al., International Journal of Software and Web Sciences, 7(1), December 2013- February 2014, pp. 42-47
B. Problem Creates Problems Fault – A fault occurs when a human errors results in a mistake in some software product. That is the fault is encoding of the human error. Failure – A failure is the departure of a system from its required behavior. Failure can be discovered both before and after system delivery, as they can occur in testing as well as in operation. Anomalies – We usually mean a class of faults that are unlikely to cause failure in themselves but may nevertheless eventually cause failures indirectly. Defect – It normally refer collecting to faults and failure. However, sometimes a defect is a particular class of fault. Bugs – It refers to faults occurring in the code. Crashes – Crashes are a special type of failure where the system ceases to function.
Fig. 3: Problem to Problems C. Observation on Problems Whenever a problem is observed, we want to record its key elements, so that we can then investigate causes and cures. Here we observed W5H3 strategy. Location: Where did the problem occur? Timing: When did the problem occur? Symptom: What was observed? End result: Which consequences resulted? Cause: Why did it occur? Mechanism: How did it occur? Severity: How much was user affected? Cost: How much did it cost? A failure reflects the user’s view of the system, but a fault is seen only by the developer. Thus, a fault report is organized much like a failure report but has very different answers to the same questions [7]. In case of timing we observed following: When the fault is created? When the fault is detected? When the fault is corrected? Fault can be classified under following categories: Logic problem Computational problem Interface/timing problem Data problem Documentation problem Document quality problem Enhancement D. Failure Severity Severity describes how serious the failure’s end result was for the service required from the system. Severity can be classified under following categories: Catastrophic: failure involves the loss of one or more lives, or injuries causing serious and permanent incapacity. Critical: failure causes serious permanent injury to a single person but would not normally result in loss of life to a person of good health. This category also includes failures causing environmental damage. Significant: failures causing light injuries with no permanent or long-term effects. Minor: failure results neither in personal injury nor in a reduction to the level of safety provided by the system. E. Changes Once failure is experienced and its cause determined, the problem is fixed through one or more changes. These changes may include modification to any or all of the development products, including the specification, design, code, test plans, test data, and documentation [5]. Change reports are used to record the changes and track the
IJSWS 14-134; © 2014, IJSWS All Rights Reserved
Page 44
Ajay Kumar et al., International Journal of Software and Web Sciences, 7(1), December 2013- February 2014, pp. 42-47
product most fault prone module, as well as other development products with unusual members of defects [9] [11]. Changes are made for one of four reasons: Corrective: in that it is correcting a fault that has been discovered in one of the software products. Adaptive: the system changes in the hardware and some part of software and given product must be adapted to preserve functionality and performance. Preventive: A change also occurs for preventive maintenance, when developer discovers faults by combining the code to find faults before they become failures. Perfective: rewriting documentation or comments or renaming a variable or routine in the hope of clarity the system structure. Table 1: Failure Report Format Failure Report Location
Such as installation where failure was observed.
Timing
Clock time, CPU time, Temporal measure.
Indication of failure or type of error message. Symptom Chain of events, leading of failure. Mechanism Reference to possible fault(s) leading to failure. Cause Reference to well define scale, such as “major”, “minor” and “critical”. Severity Description of failure, such as operating system crash, service degraded loss of data. End Result Cost to fix plus cost of lost potential business. Cost Note: - All these attributes are recorded at the time the failure occurs.
Fig. 4: Fault location in different areas V. DATA COLLECTION METHODOLOGY Since the production of software is an intellectual activity, the collection of data requires human observation and reporting. Planning for data collection involves following several steps: Step1: We must decide which products to measure, based on our Goal Question Metrics (GQM) analysis. Step2: Determining the level of granularity Step3: Making sure that the product is under configuration control. Step4: Indentify each entity involves in the measurement process. Step5: Establish procedures for handling the forms, analyzing the data and reporting the results. Table 2: Data identifier notation
IJSWS 14-134; © 2014, IJSWS All Rights Reserved
Page 45
Ajay Kumar et al., International Journal of Software and Web Sciences, 7(1), December 2013- February 2014, pp. 42-47
Metrics are expensive to collect, report, and analyze so if no one is using a metric, producing it is a waste of time and money. Here, the metrics program is to select one or more measurable goals. The goals we select to use in the Goal/Question/Metric [1] will vary depending on the level we are considering for our metrics. At the organizational level, we typically examine high-level strategic goals like being the low cost provider, maintaining a high level of customer satisfaction, or meeting projected revenue or profit margin target. At the project level, we typically look at goals that emphasize project management and control issues or project level requirements and objectives. These goals typically reflect the project success factors like on time delivery, finishing the project within budget or delivering software with the required level of quality or performance. At the specific task level, we consider goals that emphasize task success factors. Many times these are expressed in terms of the entry and exit criteria for the task. Software metrics programs must be designed to provide the specific information necessary to manage software projects and improve software engineering processes and services. Organizational, project, and task goals are determined in advance and then metrics are selected based on those goals. The metrics are used to determine our effectiveness in meeting these goals. When talking to our customers, we may find many of their individual needs are related to the same goal or problem but expressed from their perspective or in the terminology of their specialty. Many times, what we hear is their frustrations. For example, the Project Manager may need to improve the way project schedules are estimated. The Functional Manager is worried about late deliveries. The practitioners complain about overtime and not having enough time to do things correctly. The Test Manager states that by the time the test group gets the software it’s too late to test it completely before shipment. When selecting metrics, we need to listen to these customers and, where possible, consolidate their various goals or problems into statements that will help define the metrics that are needed by our organization or team.
Fig. 5: GQM model It is clear that data collection planning must begin when project planning begins, and that careful forms, design and organization are needed to support good measurement. The actual data needed to support good measurement. The actual data collection takes place during many phases of development [12][13]. In general, data should be collected at the beginning of the project to establish initial values, changes to reflect activities and resources being studied [14]. It is essential that the data collection activities become part of the regular development process [15]. We have seen how o decide what to collect and how to define it, how to plan the collection, how to design the forms, and how to map the measures to the process. Once we have captured the data, we must store it in a way that supports analysis and feedback. VI. DATA STORAGE SYSTEM Raw software engineering data should be stored on a database, set up using a database management system. Here we will use an automated tool for organizing, storing and retrieving data [7], [8], [12]. Languages are available to define the data structure, insert, modify, delete and refine data. Our database will support of system reliability based on reported failure data. Each rectangular box is a table in the database, and an arrow denotes a many to one mapping from one table to another. Thus given an entity in the source table, uniquely identify one and only one, associated entity in the target table. A double arrow means that there is at least one entity in the source table that maps to every entity in the target. Mapping define the constraints the preserve the logical consistency of the data. Product is a table of the products being measured. Product version is a table of all base line product versions. Installation contains a list of all installations on which these product version are run, and product version installation records the availability of a baseline version of a product on an installation, with it times of delivery and withdrawal.
IJSWS 14-134; © 2014, IJSWS All Rights Reserved
Page 46
Ajay Kumar et al., International Journal of Software and Web Sciences, 7(1), December 2013- February 2014, pp. 42-47
Period defines the start and end of each of several successive periods of calendar time, covering the time during which a product is being measured.
Fig. 6: Complete layout of data storage system VII. CONCLUSION The actual data needed to support good measurement. The actual data collection takes place during many phases of software development. Using some automotive techniques for software metric data collection we are able to collect accurate data so that we can easily measure our project errors free and also taking very less time and efforts. Such new techniques can be used by software analyst/engineer can easily extract and evaluate data in flexible manner. VIII. REFERENCES [1] [2] [3] [4] [5] [6] [7] [8] [9] [10] [11] [12] [13] [14] [15]
Linda Westfall, "12 Steps to Useful Software Metrics", Web Ref: http://floors-outlet.com/specs/spec-t-1-20111117171200.pdf Norman E. Fenton, 1991, Software Metrics, A Rigorous Approach, Chapman & Hall,London. Roger S. Pressman, “Software Engineering, A practitioner’s approach”, Six Edition, McGraw-Hill Publication, 2005, ISBN: 007124083-7, pg.- 462. Please see http://www.cs.ucl.ac.uk/staff/A.Finkelstein/ advmsc/11.pdf. James A. Senn, “ Analysis and Design of Information Systems- Second edition”, McGraw-Hill Edition, ISBN:0-07-123300-8, 2003. Jason Gorman, “OO Design principles and Metric”,2006, please see www.perlezuml.com Dolores R. Wallace and Laura M. Ippolito, “Error, Fault, and Failure Data Collection and Analysis”, National Institute of Standard Technology, Gaithersburg, MD 20899 V. R. Basili and D. M. Weiss, "A methodology for collecting valid software engineering data," TSE 10, Number6, p. 728-738. Behroz Parhami, “Defect, Fault, Errors……..Failure”, IEEE transaction on software reliability Vol-46, No-4, Dec 1997. B.B. Agarwal; M. Gupta; S.P. Tayal, “SOFTWARE ENGINEERING & TESTING: An Introduction”, Jones & Bartlett Learning, 2009,ISBN-13: 978-1-934015-55-1. Web Ref, please see http://www.worldscibooks.com /etextbook/6362/6362_chap01.pdf. Web Ref, please see http://crystal.uta.edu/~ylei/cse4321/ data/intro.pdf. Jiantao Pan,”Software reliability”, Carnegie Mellon University, 18-849b Dependable Embedded Systems,Spring 1999. Finkelstein, "Requirements and Relationships: a foreword" in Software and Systems Traceability, J. Cleland-Huang, O. Gotel and A. Zisman, Eds. London: Springer, 2012. S. L. Lim and A. Finkelstein, "StakeRare: Using Social Networks and Collaborative Filtering for Large-Scale Requirements Elicitation," IEEE Transactions on Software Engineering, vol. 38, pp. 707-735, 2012.
Authors Details Ajay Kumar has completed “Master of Engineering in Software Engineering” program from Thapar University Patiala. Currently, he is working with Mewar University, Chittorgarh (Raj.) as Assistant Professor and Head, Computer Applications Department and pursuing Ph. D. program from Thapar University also. His areas of interests include Grid Computing, Cloud Computing, Software Engineering, Web services and Network Security. His, current research focuses on large-scale data management and integration services in Cloud Computing environments. In addition to his contribution as University ERP Developer on various domains and also published many research papers in national and international repute journals/conferences.
Dr. Seema Bawa, an alumni of IIT Kanpur, IIT Kharagpur and Thapar University has demonstrated her intellectual, interpersonal and managerial skills in various domains. Having vast industrial experience of working in IT industry with the role of Project Leader and Project Manager, currently she is a Professor of Computer Science and Engineering and Head of Centre for Information Super Highway at Thapar University, Patiala. Her areas of interests include Parallel and Distributed Computing, Grid Computing, VLSI Testing and Network Management. Her current research focus is on Cloud Computing and Cultural Computing. Along with being a committed teacher and a passionate researcher, she has been actively contributing her services for underprivileged sections of the society.
IJSWS 14-134; © 2014, IJSWS All Rights Reserved
Page 47