Software performance tuning of software product family architectures: two case studies in the real-time embedded systems domain
Christian Del Rosso Nokia Research Center P.O. Box 407 FIN-00045 NOKIA GROUP (Finland) Phone: +358718036604 Fax: +358718036856
Abstract Software performance is an important non-functional quality attribute and software performance evaluation is an essential activity in the software development process. Especially in embedded real-time systems, software design and evaluation are driven by the needs to optimize the limited resources, to respect time deadlines and, at the same time, to produce the best experience for end-users. Software product family architectures add additional requirements to the evaluation process. In this case, the evaluation includes the analysis of the optimizations and tradeoffs for the whole products in the family. Performance evaluation of software product family architectures requires knowledge and a clear understanding of different domains: software architecture assessments, software performance and software product family architecture. We have used a scenario-driven approach to evaluate performance and dynamic memory management efficiency in one Nokia software product family architecture. In this paper we present two case studies. Furthermore, we discuss the implications and tradeoffs of software performance against evolvability and maintenability in software product family architectures. Key words: Software Performance, Software Product Family, Software Architecture Assessments, Embedded Real-Time Systems, Dynamic Memory Management.
Email address:
[email protected] (Christian Del Rosso).
Preprint submitted to Elsevier Science
12 July 2007
1
Introduction
Software performance is an important non-functional quality attribute of a software system. Performance and memory efficiency influence the cost, the quality and the success of a product, Ran and Lencevicius (2003). Embedded real-time systems add more requirements to software performance with defined time deadlines and constraints in terms of CPU power, memory consumption and power management. The limited resources require a carfull design. Design choices must be targeted to limited resources and real-time deadlines. The lack of performance means time deadlines not respected and failures in achieving a successful user experience. The ideal situation for addressing software performance is during the design stage. Performance models are created to evaluate the impact of the expected workload. Consequently specific design choices are reflected in the software architecture. Unfortunately, performance is usually not considered enough at design stage and, only later, in the development stage, attempts are made to recover weaknesses and software design flaws. The reasons for not considering performance from the beginning vary from tight deadlines in the software development to a potential ”we will fix it later” attitude. However, this strategy includes potential problems in terms of cost and development time needed to re-architect the software architecture. An additional dimension is introduced when performance is to be evaluated and improved for a software product family architecture. A software product family architecture is an architecture for a set of related products. Products in a family share a common reference architecture and part of the code. Therefore, improving the performance of a software product family means enhancing the performance of all the products in the family, or a few of them, while not affecting the performance of the others negatively. In this paper we first present the method and then two case studies of performance tuning of the S40 Nokia software product family architecture. The S40 is one of the main Nokia’s software product family architectures. We have adapted the Software Performance Engineering method (SPE), Smith and Williams (1995), to the software product family domain. The method is scenario-based and it can be used to evaluate and assess the performance of a software product family architecture during the whole software life cycle. The method is not tied to a specific modeling technique, and depending on the stage in the software life cycle, simulation, prototyping and measurement techniques can be applied. The first case study focuses the analysis on the performance of the Nokia S40 core software architecture. The second case study describes the analysis of 2
dynamic memory management systems in the context of the Nokia S40. In the case studies we have reported our main findings and reasoned on how to address performance tuning of software product family architectures. We have presented our results accurately; however, for confidentiality reasons, detailed description of the software architecture assessed had to be excluded from this paper. The structure of the paper is as follows. Section 2 gives an introduction on the basic concepts of software product family architectures. The problem statement and challenges of performance tuning software product family architectures are described in section 3. Section 4 describes the method and its various steps. Section 5 presents an introduction to the case studies, the S40 software product family and on the background of our work. The first case study and its results are in sections 6 and 7. Section 8 introduces the domain of dynamic memory management in the context of embedded real-time systems, this introduction is related to the second case study. The second case study and its results are in sections 9 and 10. The metrics used in case study two are described in appendix A. The related work is in section 12, and the discussion on performance tuning of software product family architectures is on section 11. The conclusion and future work are in section 13.
2
Software Product Family Architecture (SPF)
A software product family architecture is an architecture for a set of related products. The products in the family share a common asset, part of the code and have a common reference architecture, Jazayeri et al. (2000); Bosch (2000); Clements and Northrop (2002); Gomaa (2004). The main benefits and advantages of software product family architectures are an improved software quality and the decrease of time-to-market of the products. In a competitive market with the trend of shortening the software life cycle of products, software product family architectures represent a key software asset in a company portfolio. A software product family shares common assets called commonalities, however, the differentiation of the products come from an architecture that allows the extension and the instantiation of different products from the same core asset. Different products will have a different set of features and therefore they will be able to differentiate themselves in the market. We define feature in our context as a user visible functional requirement. A feature in a mobile phone can be web browsing or FM radio. Through feature modeling, the architecture supports the variability of products. A variability represents the control point in the architecture where the change and extension can be made with the degree of variation allowed. 3
A classification of feature can be described using UML (Unified Modeling Language), Rumbaugh et al. (2005). UML has not specifically addressed feature modeling but the conceptual definition of feature can be described using UML stereotypes. The basic conceptual classification of feature using UML stereotypes is in figure 1. A feature can be core or optional. A core feature is a feature which every product in the family has. A core feature is depicted in UML with the stereotype followed by the feature name. An optional feature is a feature provided only by some of the members of the product family. An optional feature is depicted with the UML stereotype followed by the feature name. Core and optional features can be further specified as immutable and parametrized. Immutable features are instantiated in the products without further changes. An immutable feature can be a core or an optional feature and is depicted with the UML stereotype as or as followed by the feature name. A parametrized feature, instead, defines a feature which is instantiated using one or more parameters whose values are defined at system configuration time. The specifications of the parameters is done using UML tags. A parametrized feature is depicted with the UML stereotype as or as followed by the feature name and the list of tags with their assigned values. For example, mediaplayer type=high−end.
Fig. 1. Feature characterization in UML
The study of feature analysis and modeling is called domain engineering and several publications explore and present methods to model and analyze features in a software product family, Van Gurp et al. (2001); Svahnberg et al. (2005). Feature modeling has been introduced in the FODA method (FeatureOriented Domain Analysis), Kang et al. (1990), but other feature modeling methods include FORM (Feature-Oriented Reuse Method with DomainSpecific Reference Architectures), Kang et al. (1998), and the work by Griss et al. (1998). Modeling features includes the understanding of their dependencies and the creation of feature dependency graphs where links establish dependency relations at the feature level. From the feature model it is possible to link features to the architecture design and to the implementation. Figure 2 represents, 4
conceptually, the dependency relationships among the different models in a UML diagram. 1..*
Feature
1..*
Architectural component
1..*
1..* 1..*
1..*
Source code component
Fig. 2. Dependency between features, architecture design and source code level
The concept represented by figure 2 will be important in the following sections when we will refer to this mapping for the scenario selection step and for the optimizations. The traceability through the three different levels makes it possible to understand the impact of changes and improvements from the user scenarios (containing features) to the architectural components and to actual source code modules in the software products and vice versa. Links at each level of abstraction must be consistent in all the other levels. A link between features in the feature dependency model implies an existing link at architectural level between the components that implement those features. Subsequently, dependencies in the architectural level must be consistent with dependencies in the source code level. Software re-engineering, static and dynamic architecture analysis study these models for architecture consistency checks and analysis, Riva (2004); Del Rosso (2005b).
3
Problem Statement
Software evaluation for a software product family means the inclusion of the whole products of the family in the process. Performance improvements can be targeted to the whole software product family, to a specific product or to a subset of the products in the family, e.g. high-end products or low-end products. In order to accomplish this task, a clear understanding of the different characteristics of the products in the family is needed and a detailed evaluation of the tradeoffs is necessary. The quality of a software product is defined by a set of non-functional quality attributes such as security, performance, evolvability, maintenability, etc. The ability to achieve the desired targets is done by a careful design and analysis of the tradeoffs of a software product. Non-functional quality attributes do not live in isolation and may have conflicting requirements and demand 5
different design decisions. For example, security and reliability conflict with performance. An additional complexity in the evaluation process is introduced when the analysis of the tradeoffs not only includes the non-functional quality attributes of a product but of a family of products. Conflicts in quality attributes in a family appear when different products have different targets and markets, what in the marketing jargon is called segmentation. For example, multimedia devices and low-cost devices have conflicting requirements between performance and the cost of the products. Enhancements and optimizations can involve refactoring the software architecture of the product or refactoring the reference architecture of the software product family. The software architect performing the evaluation must not only have a good understanding of software performance but also have an expertise in domain analysis and software product family architectures. Currently, assessment and evaluation methods have focused on single software systems and considered and analyzed the improvements on their software architecture. On the other side, software product family research has not stressed the analysis on the tradeoffs of non-functional quality attributes, especially performance. We aim in this paper to contribute to the research literature by presenting case studies of the analysis of software performance in software product family architectures in the industrial realm.
4
Software Performance tuning for SPF
The software performance tuning method for software product family architectures presented in this paper is scenario-based. Key performance scenarios are selected and analyzed during the analysis. Scenarios contain the execution of one of more features of the products. We define feature in this paper as a user visible characteristic of the system, for example, video call. The steps of the software performance method are represented in the activity diagram in figure 3. The process is iterative and the analysis can be further refined and improved by re-running the needed steps. Our approach follows the SPE method, Smith and Williams (1995), and the activity diagram and the steps described below reflect this fact. However, we had to adapt the SPE method to the software product family domain. In this context, we had to revise and adapt the key performance selection step, step 1 in the diagram 3 and section 4.1 in the text, to take into account domain and feature analysis. Additionally, we added the analysis and tradeoffs for the software product family, step 5 in the diagram 3 and section 4.5 in the text. In 6
the software product family domain the analysis and tradeoffs have to consider a set of products rather than a single product.
Key Performance Scenarios Selection
Establish Performance Objectives/ Prepare Simulation Plans
[step 1]
[step 2]
Conduct Simulations/ Perform Performance Models
[step 3]
Evaluate Simulation Results/ Evaluate Performance Models
[step 4]
Analysis and Tradeoffs for the Software Product Family
[step 5]
[Not satisfied]
Analysize at which step the improvements must be made
[satisfied]
Fig. 3. Software Performance Method for SPF steps
4.1 Key Performance Scenarios Selection The first step in the process is the selection of key performance scenarios. Scenarios define the focus of the analysis and the features included in the scenarios are considered for improvement. Key performance scenarios include 7
features that are frequently used by the end-user, thus, optimizations will have a direct impact on the user experience. Features that are resources intensive and are particularly demanding in terms of CPU power and memory usage must be considered even if they are rarely used. Considering real-time systems, features with real-time requirements must be considered. The importance of the features also come from the customer and marketing department within a company. In a product family architecture, scenarios can cover features instantiated in all the products of the family, the so called core features, or can include optional features targeting a particular set of products in the family. By selecting core features, all products will be directly involved in the analysis. However, new features are introduced all the time during the software life cycle and we may want to focus on newer features, that are usually particularly performance and resources demanding, and explore their impact on the software architecture. In this case, the task of the assessment will be to optimize one particular product or a subset of the products in the family. In many cases, performance demanding features are included only in some products (specialized products with some particular features) and later these features are included and backported to other products in the family. For example, this is the case when new features are only instantiated in high-end phones and then introduced in low-end phones becoming commodities. Product 2
Product 1 Depends-on Scenario 1 Non-core features, not shared by other products
Fb
Scenario 3 Features, shared by a set of products in the family
Fa Product 3
Core Features
Scenario 2 Core-features, shared by all products in the family
Fig. 4. Scenario selection and features
The blocks in the figure 4 represent products and each product contains a set of features. From the basic set theory we have that all the products in the family share the core features and, in addition, products can share a subset of features. Referring to figure 4: • Product 1 ⊂ Product 2 • Product 3 ∩ Product 2 ∩ Product 1 = Core Features 8
Figure 4 gives a graphic representation of the dependencies between scenarios and software products. From figure 4 we have scenarios with: • only core features • features shared with a set of other products • features not shared with other products Features have dependencies which must be identified and understood in order to make the necessary improvements. Methods such as FODA, Kang et al. (1990), aim at feature dependency and analysis, the so-called domain analysis, see section 2. Domain analysis is not in the scope of this paper. However, subsection 4.5 and section 11 discuss the implications of feature dependencies for software performance tuning. The scenario selection process is iterative and scenarios are ranked, prioritized and selected by the stakeholders according to the technical and business importance of the features. The stakeholders are the people that have a stake and contribute to the evolution of the architecture: the software product family architect, architects, software developers, etc. At the end of the process, the scenarios selected must reflect the focus of the analysis and they must be in a manageable number, a number that depends on the time for the evaluation and on the analysis’scope.
4.2 Establish Performance Objectives and Prepare Simulations Plan In this second step we define the performance objectives and prepare the simulation plans. A set of metrics and objectives must be listed in order to compare the results obtained with the objectives established. This step includes the definition of the metrics, the variables to measure and the definition of the particular analysis technique to be used in the following step.
4.3 Conduct Simulations and Perform Performance Models The third step in the process includes performance modeling, simulations or software performance measurements. Members of the product family are used as representatives for the study and, modelling and simulations are based on their performance and workload or, expected one, if the software is on early development stage. Depending on the software stage in the life cycle, different techniques can be used. Simulations, modeling and prototyping can be used in the early stages. For studying software performance in real-time systems RMA (Rate Mono9
tonic Analysis), Liu and Layland (1973), queuing theory and Markov models can be used. A good reference on performance analysis and modeling is the book by Jain (1990). In later stages of development, measurement techniques can be applied to the software systems. Trace instrumentation, Metz and Lencevicius (2003); Metz et al. (2005); Del Rosso (2004), is a measurement technique where additional code is included in the source code and traces from the running system are extracted to trace the values of the needed variables. With data collected from the measurements, the dynamic view of the architecture can be reconstructed and the performance measured, Del Rosso (2005b).
4.4 Evaluate Simulation Results and Performance Models
The fourth step in the process is the evaluation of the simulations and the performance models. In this phase, we compare the results obtained in the previous step with the objectives established. In addition, the hotspots and the bottlenecks found in the architecture are analyzed and design decisions are taken. At architectural level we look for software anti-patterns, Smith and Williams (1995); Williams and Smith (2000). Anti-patterns document common mistakes found in software design and anti-patterns literature not only documents bad architecture design choices but provides ways to re-architect the system while preserving the semantics. Software patterns can be applied to the software design, Buschmann et al. (1996); Gamma et al. (1995), in the problematic areas. When a more extensive re-architecting activity is needed to cover the entire software architecture and not only a part of it, we apply architectural styles. Examples of architectural styles are the pipe and filter and the layered style, Shaw and Garlan (1996). Improvements can be done at different levels of abstraction. Optimizations at the design level are very important, without a proper architecture a software cannot achieve its objectives. However, while optimizations at design level are still very important, optimizations at the source code level play an important role. Refactoring can be done at the code level, Fowler (1999). In addition, algorithms and data structures must be investigated. A quick sort is faster than a bubble sort and a hash table gives a faster access then a sequential access to data structures. Evaluating software performance implies a thorough analysis of the tradeoffs. Quality attributes may have conflicting requirements and tradeoffs are necessary. For example, security and fault tolerance come at the expenses of performance. At the end, improvements must be evaluated against their impact 10
on the software architecture.
4.5 Analysis and Tradeoffs for the Software Product Family The fifth step in the process is the evaluation of the performance models and the analysis of the tradeoffs for the software product family architecture. Once the bottlenecks and hotspots are found, the proposed solution must be evaluated for its impact on the software product family. The impact analysis, Gomaa (2004), is the evaluation of the impact of the proposed solution on the products of the family following the dependencies at the feature, architectural and source code level. Even if different products do not share common features (except for the core features), features may have a dependency relation. An example is represented in figure 4 where product 3 and product 2 have a dependency between features Fa and Fb. The feature dependency relation implies a dependency at the architectural level and consequently at the source code level. Dependency relationships must be consistent along all the three layers of abstraction presented in figure 2. An example of features dependency from the mobile phones domain is represented by the Music Player and the Playing Ring Tones features. The two features are distinct. The first feature is the music player application while the second feature plays the appropriate ring tone in case of various events such as an incoming phone call or an incoming SMS. A mobile phone has the Playing Ring Tones feature since it is a core feature, but might not have the Music Player feature which allows to play music files in different formats, e.g. windows media files, MP3, AAC. However, if we want the Playing Ring Tones feature to play files with codecs supported by the music player and not only by the ring tone codecs, then a dependency relationship is created by the shared codecs modules. Once this architectural decision is made, changes in the codecs modules will affect both features. A discussion on managing features dependency, problems and solutions in mobile software is discussed by Maccari and Heie (2005). We must notice that the inclusion of the same feature by more products does not necessarily imply that the same feature is instantiated using the same implementation. Parametrized features, as described in fig 1, are features instantiated with different parameters including, eventually, different implementations. With the understanding of the impact of the improvements on the product family architecture we must include the analysis of the tradeoffs. While in a 11
single product architecture the analysis of the tradeoffs is between quality attributes in the product, by adding the product family dimension, the analysis of the tradeoffs is augmented with the analysis of the tradeoffs between quality attributes, sometimes with conflicting requirements among the products in the family. Conflicting quality attribute requirements, in a single product architecture, arise when the tradeoffs are between different non-functional quality attributes such as security and performance. In a software product family, we may additionally have conflicting requirements for the same quality attributes. For example, improving the performance in low-end products may imply a different architecture than the one needed in high-end products.
4.6 Iteration The performance assessment process is iterative and improvements to the outcome can be made in every single step of the process. The scenario selection step can be used to improve the focus of the analysis and scenarios can be redefined and refined. Additional stakeholders can be included in the process. Performance objectives and simulation plans may be revised considering the outcome of previous iterations. Furthermore, we may want to set more challenging objectives and investigate other variables in the system. Additional simulations and performance models provide a deeper investigation of the system. In addition, alternative models may provide a different perspective for the solution of the problem. The results of new simulations and performance models must be analyzed and considered. The new findings should be compared with the previous iterations. Different architecture solutions may be investigated. The impact analysis will then consider the performance, implications and tradeoffs of the alternative solutions. The decision to iterate is commonly done at the end of the process. Only at the end of the process we are able to estimate the benefits and to quantify the outcome of the analysis in terms of performance gained against the tradeoffs. However, nothing prevents reiterations in the early phases of the process. The only limitation is that the path must follow the directions of the activity diagram. The conclusion of the assessment must produce a quantifiable evidence of the benefits, a clear description of the tradeoffs and the implications of the solution.
5
Background of our work
Within Nokia we have three different mobile software platform architectures, the Series 30, Series 40 and Series 60. The case studies in this paper concerned 12
the Nokia’s Series 40 (S40) mobile terminals software architecture. Series 40 is a Nokia proprietary software platform that has been in use for over 15 years. It has been mainly deployed in low and middle-range products, as it combines ease of use with low memory consumption and lightweight processor requirements, both key factors in the cost of manufacturing a mobile terminal. The Series 40 architecture was created in the mid 1990s when mobile phones were not the same devices we see today. A mobile phone at that time had basic features such as voice and messaging. Essentially, most of today’s applications were not supported and in some cases not even conceivable at the time the architecture was designed. Examples of such requirements are: color displays, enhanced phonebook, multimedia (camera, messaging, gallery, ring tones) and third-generation (high-bandwidth) protocols. Furthermore, advances from component-based research and software engineering together with new market demands brough the need to expand the scope of our software. From a basic software architecture where mobile software was created, the organization moved to a software product family platform. The new software platform architecture had to provide consumers with more choices and serve several user segments. The architecture, and the organization, consequently, had to be expanded and adapted to a product family architecture, see section 2. From a handful mobile phone models delivered in the first few years of the early 90’, we now launch more than 50 mobile phones a year, in different geographical locations and serving several user segments. One of the biggest achievement of the Series 40 mobile phone platform is that it has been able to stretch and incorporate new requirements for over 15 years and still continues to be the Nokia’s most profitable platform. The development of the Series 40 software is geographically distributed over seven sites, located in three continents and separated by several time zones. Cultural, language, time-zone differences have contributed to the challenges of its software development. The S40 software has been development in distributed fashion simultaneously and the documentation is not an exception. The ability of the development teams and a central architecture management board ensured a sort of controlled way to manage software evolution and software architecture documentation. During the years, new requirements have been incorporated in the S40 software product family architecture and each of the requirements have had an impact on the overall architecture evolution and, in our case, in the overall software performance. One way to ensure software evolution is through software architecture evaluations and assessments, Del Rosso (2006a). As a software system evolves to support new requirements, potential new performance problems 13
may arise. The software architect must consider, in industrial domain, the feasibility of the solution and balance the performance gained against the analysis of the cost through a careful tradeoff analysis. In this context, evaluating performance for embedded real-time systems, means undertanding the ratio between functionality and the cost of the required hardware, Ran and Lencevicius (2003). As researchers in the corporate research center we had the opportunity to perform various assessments over the years and act as consultants for the Nokia Mobile Phone business unit, Del Rosso (2006a). The performance evaluations and assessments case studies presented in this paper represent part of the research we have worked on during these years. The purpose of the case studies was to determine how the current Series 40 architecture performed and what should have been changed in order to fulfill the new requirements. The outcome of the assessments had to be pragmatic, it had to consider therefore cost and time-to-market constraints, and give clear directions and solutions in a fixed period of time. On the other side, significant innovations and improvements had to be considered and experimented.
6
Case Study 1
In this case study we analyzed the performance of the S40 mobile phone platform. The project was commissioned by the Mobile Phone business unit to our team in the corporate research center. In the scenario selection phase we agreed to focus on the reference architecture of the product family. The reference architecture represented the core features and the core software from where each new product had to be derived. The specific product architecture is derived from the common reference architecture by adding features. Our work was a first attempt to understand how the current architecture performed and to reason on the current design decisions. The software product family had the ability to deliver more than 50 product variants a year and each variant had its own specific settings. It was clear that in order to be effective and have an impact we had to have a clear and well delimited focus. The reference architecture and consequently the core features represented our target. The core features were shared by all the products in the family and optimizations on the core part had the immediate advantage to impact all the member in the family. Eventually, new requirements would demand specific studies and a re-run of the process to focus on them. The reasoning to select the scenarios followed the advices given in section 4 and features frequently used by end-users were considered. Prioritization, ranking and discussions helped in 14
Scenarios
Core/Optional
defined
Products with the feature
Phone Start-Up
Core Feature
Scrolling the Phonebook
Core Feature
Incoming Call
Core Feature
Table 1 Scenarios Selected
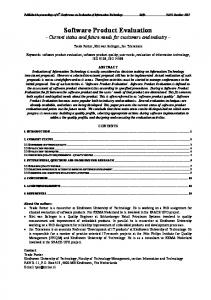
reducing the scenarios. Examples of some of the scenarios analyzed are shown in table 1. To understand the implications for the product family, we used two handsets as representatives for the analysis. The handsets were part of the same product family. One handset had a more complete and advanced set of features while the other had basic features. In addition, the handset with advanced features contained all the features included in the basic handset. Conceptually, referring to figure 4, the advanced handset corresponds to Product 2 while the basic handset corresponds to Product 1. We chose to use trace instrumentation to profile software performance. By running the scenarios in the handsets we extracted the run-time traces which were then stored in text log files. Only significant events were recorded and, it was part of the analysis to define what information and data were required for our work. Performance profiling using trace instrumentation has the advantage of extracting exactly the rum-time system properties as compared with modeling and simulation. On the other hand, traces added to the original source code affect software performance so that software system performance can be distorted and thus the measurements, Steward (2001). A compromise is the best solution and a tradeoff between added traces and the information needed must be considered, Metz and Lencevicius (2003); Metz et al. (2005). From the data gathered we proceeded to reconstruct the dynamic and static views of our software architecture. A software architecture can be documented using different views. For further information on documenting software architectures and the use of architectural views see, Clements et al. (2002a). Choosing the architectural views to reconstruct and analyze required a good knowledge of the specific system. The Series 40 platform architecture utilizes message passing as a communication paradigm. Analyzing the run-time properties of the systems meant considering the software performance of the message passing system. We created various dynamic and static analysis tools to reconstruct the dy15
Fig. 5. From the Data to the Views
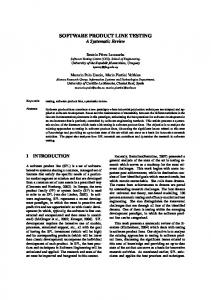
namic and static views of the software. For the dynamic views we used the traces collected as input, while for the static analysis we used the actual source code. Figure 5 shows the process and the various phases in the architectural views reconstruction. In total, we used five different architectural views to analyze the software performance: the CPU load view, the message statics view, the run-time coupling view, the message sequence chart view, and the static analysis view, see figure 6. The CPU load view showed the CPU usage of the processes in the system. The message statistics view showed the percentage of CPU time spent on handling different message types during the scenarios. The run-time coupling view represented the run-time dependencies of the processes in the scenarios analyzed and the weights in the arcs expressed, in our case, the number of messages exchanged. The message sequence charts view showed message sequence chart digrams with time stamps. The static analysis view was used to analyzed the architectural dependencies of the system extraced from the source code, Riva (2004). The static view included architecture component dependencies and function call dependencies. In the analysis, the CPU load view was the first view to be begin with. Processes to be considered were the ones who consumed most of the CPU time or demanded high processing time but for a short time. In the CPU load view diagram, the two behaviors were represented respectively by long execution 16
% CPU Load
CPU Load View
MSC View A B m1 t1 m2 t2 m1 t3
B A t1
Time
Static Analysis View Module A .... send(m1,B) .....
Message Statistics View
Run−Time Coupling View
Statistics by Message Type m1 203 msg.; 4% CPU time m2 179 msg.; 3.5% CPU time m3 60 msg.; 3.2% CPU time m4 22 msg.; 1.3% CPU time
A
320
C
120 262 B
....
Fig. 6. Architectural Views Reconstructed
time and peaks. After the CPU load view, we analyzed the message passing system performance. Sending messages itself is not a time-consuming activity but messages generate processing activities. There were different kinds of messages, and in the message statistics view we considered their type. A message could be a request for a particular resource, a service request, an acknowledgment or contain only data. By marking the begin and end of the processing time of the message in the traces we were able to identify the time spent in serving a specific message type. After the message statistics view, we considered the run-time coupling view. The run-time coupling view considered the number of messages exchanged between processes as a coupling measure. Highly coupled processes had high ranked arcs in the directed weighted graph. Figure 6 shows an example of the run-time coupling view when three processes, A, B and C are involved.We chose the number of messages exchanged to consider the overhead created by the processes’context switch activity. In a multi-tasking system, context switches, when the processor switch between various processes, happens all the time. With the context switch there is the additional overhead to save and restore the process’s context afterward. In a message passing system, when the message crosses the process’s address space boundary, a context switch happens with the consequent processing time overhead. Context switches can be limited by merging highly coupled processes. However, other considerations must be taken into account when merging run-time entities, such as architecture modularity and organizational issues. For example, the software architecture might have been arranged in that way considering the organizational structure and geographical boundaries of the develop17
ment teams and its structure may be difficult to change. The discussion of the relationships and dependencies between software architecture and organizational structure is beyond the focus of this paper. However, the topic has been investigated in the literature, Conway (1968); Cockburn (1996); Herbsleb and Grinter (1999). Additionally, by watching the run-time coupling of the architecture considerations can be made regarding its structure. The coupling view is the runtime network topology of the system and anti-patterns can be discovered, Fowler (1999), for example the god Class anti-pattern described in Smith and Williams (1995). Continuing with the analysis, we have the static analysis view. The static analysis view was the software architecture reconstructed from the software source code. The static analysis was used as a support for the dynamic analysis. Run-time dependencies were traced back to source code dependencies. In this way, the software run-time views were complemented with the static software architecture view, enhancing software comprehension. In our work, we used the tools and work done by Riva, Riva (2004). The views were used to analyze the system from a certain perspective. However, only the combined use of the views had the ability to provide detailed information from different angles. In this paper we focus on the software product family domain but a discussion on the how to create the views and their use has been described in our previous work, Del Rosso (2005b).
7
Results
We used the combination of the different views for the architecture reconstruction and understanding. The architectural views were reconstructed for both the handsets we had and we analyzed their commonalities and differences in performance and run-time dynamics. Once a bottleneck was discovered we had to consider the potential solutions and impact in the product and product family architecture. At the end of our work we had two main findings. We discovered a break of an architectural rule during the system start-up and we identified the god class antipattern, Smith and Williams (1995), in the reference product family architecture. The break in the architectural rule was found due to an anomalous activity that was consuming an unexpected high CPU time with an associated high number of messages at phone start-up. The high number of messages 18
exchanged and the peak in CPU load view were just the manifestation of the problem. After further analysis, we found that an architectural rule had been broken and it was because legacy code was left from the previous architecture design and it had not been removed. The fault did not cause any visible failure such as system crashes, however, software performance was affected. The phone start-up feature constitutes one of the basic and fundamental functionalities of a mobile phone. The affected source code was shared by all the members of the product family. Consequently, the improvement had an immediate effect on the software product family performance.
In addition, we identified a god class antipattern in the run-time reconstruction of the architecture. The god class antipattern, in a message passing system, is represented by a task which concentrates most of the intelligence and performs most of the work while other tasks in the systems are relegated to minor and supporting roles. Messages were sent to one main task which had to handle them by performing additional processing operations and eventually, send back the results of the computation. The god class affects the performance of the system since it constitutes a bottleneck. Additionally, with its low modularity the god class shows a poor architectural choice which affects the maintainability and evolution of the system. The god class antipattern was a run-time architectural pattern of the S40 software platform architecture. The pattern was in the core architecture and it was the result of a hectic architecture evolution of over 15 years.
Summarizing, we considered core features in the scenario selection phase to focus on the S40 core software platform. We analyzed the performance of the phone software by reconstructing the dynamic and static views of the S40 software architecture. In the analysis, we found bottlenecks and problems in the core architecture. Additionally, as part of the analysis, we considered the implication and impact for the software product family. Core features are shared by all the products in the family and imply a shared architecture and source code between the products. The architectural problems were in the core components, and as a consequence, performance improvements affected the entire set of products. As part of the process, we demonstrated that the improvements did not influence negatively the performance of other products. The check was done by analyzing the feature dependency diagrams, the architectural views and, by iterating the performance analysis process with the improvements in place. 19
8
Dynamic Memory Management and Embedded Real-Time Systems
A dynamic memory management system has to keep track of memory blocks in use in the system and at the same time it has to optimize the usage of memory. Knuth defined dynamic storage algorithms as the algorithms for reserving and freeing variable-size blocks of memory from a large storage area, where these blocks are to consist of consecutive memory locations, Knuth (1997). The study of dynamic memory allocation algorithms was started in the 70s, Randell and Kuehner (1968); Purdom and Stigler (1970); Knowlton (1965); Wilson et al. (1995). Optimization of memory usage and software performance have been the focus of the research community since the early days when resources were limited and processing power scarce. In embedded real-time systems the considerations above still hold. In addition, the total cost of the devices still heavily depends on the amount of memory embedded. The difference between embedded real-time systems and the PC world do not end in the constrained environment of the former. In the system considered in this paper and, in most of the existing embedded systems at the moment on the market, there is no memory compaction and no virtual memory functions. In addition, in real-time systems, performance is not the only thing that matters; strict time deadlines must be respected. The failure to respect a deadline can lead, for example, to the dropping of a phone call. Only algorithms with explicit memory management have been examined in the case study, despite the popularity of garbage collection algorithms, their performance and memory requirements are still inadequate for the use in embedded systems, Berger and Hertz (2005). A dynamic memory management system is made of algorithms and data structures. General purpose algorithms and custom algorithms have been described in the literature. Examples of general purpose algorithms are best-fit, first-fit, the Doug Lea algorithm, Lea (2006), (which is used in the GNU libc), and the Windows XP allocator, Ritcher (1997). On the other side, custom algorithms have been implemented to optimize and exploit regularities in real program behavior. Examples of custom allocators are the Apache web server allocator, Apache Foundation (2006), the C++ Standard Template library allocator, SGI (2006), and the GCC compiler allocator, Free Software Foundation (2006). The use of custom algorithms do not always bring clear benefits and their use must be careful considered and applied only when the benefits are clear and quantified, Berger and Zorn (2002). When considering dynamic memory management systems, designing the algo20
Heap sorted bins size
16B
24B
32B
......
512B
576B
640B
chunks
+
Allocated Memory Free Memory
Fig. 7. Pool System plus Heap
rithm is not enough, data structures are also important. Different heap layouts can be used and their properties must be considered. For example, Microsoft C++ uses one heap for allocations of less than 200 bytes, and a second heap for all other allocations, Microsoft Corporation (1997). Segregated free lists are preallocated lists of fixed size chunks of memory. They have been designed to handle fixed size blocks allocations and their advantage is on speed and memory fragmentation especially in system where many small blocks are allocated, Noble and Weir (2001). The Doug Lea algorithm for example, Lea (2006), uses segregated free lists, using exact size bins of a multiple of 8 bytes, each for objects smaller than 64 bytes; for larger objects it is a pure best-fit allocator and for very large requests (larger than 128K) it relies on the system memory mapping facilities (if supported). In the case study presented we have simulated two different memory layouts. The first layout was made of a contiguous memory block of memory, that we have called the heap, and the second layout was made of a heap plus a segregated free list data structure, see figure 7.
9
Case Study 2
The scope of our study was the analysis and the evaluation of dynamic memory systems for the Series 40 software product family architecture. Multimedia features have gradually been introduced in mobile phones and their requirements are demanding especially in embedded systems where memory and CPU power are limited. The S40 software product family had a dynamic memory management, based on a heap plus pool data structure, common for all the members of the product family. However, the S40 software architecture had evolved and a quantitative assessment was needed in order to assess how well the current memory management system performed. In order to evaluate the impact of the features on the memory system we chose 21
a set of key scenarios containing core features and non-core features. Some of the key performance scenarios selected were: • • • •
Sending and Receiving 5 MMS of 100 KB each Downloading and playing a Java Midlet Browsing the Web Phone Start-Up
We created a simulation environment to simulate different dynamic memory management systems and to extract the metrics described in appendix A. The simulation environment design had to be extensible and permit to easily add new heap layouts and algorithms. Its design followed the Abstract Factory pattern and the Builder pattern, Gamma et al. (1995). For a reference on how to design a simulation environment for dynamic memory management see Dan Lo et al. (2004). The workload was collected from data of allocations and deallocations in the system while running the scenarios and the traces were stored in text log files. Life-time and size distribution of the requests are very important for the study of fragmentation and using real workload was an advantage. In our study we were helped by the fact that we were analyzing a software already developed and we could extract real traces by executing the scenarios. In early design stages, mathematical functions to determine the size and the life time distribution of the requests can be used. Uniform and the (negative) exponential have been used in the literature; however, the assumption of randomness and independence of the distribution of the life time and size of the blocks tend to be false for most real programs, Wilson et al. (1995). In a product family architecture, different products have different features and therefore generate different workloads. Simulating multimedia features meant to analyze high-end products. On the other hand, simulation of core features focused on requirements and needs of low-end products. Taking into account the scope of the analysis, we selected a multimedia phone model, a phone with a superset of the features included in other products. The phone supported core features plus additional multimedia features. Conceptually, the selected phone corresponds to product 2 in figure 4 and phones without multimedia features can be compared to product 1. Table 2 presents the data characteristics of a few scenarios analyzed. To better understand the product family domain, we added an additional column to the table to list the products implementing the determined feature and to specify whether the feature was optional or part of the core. In table 2 the products listed serve as a demonstrative example; the data characteristics of the scenarios are real. The last column in table 2 is important since it connects a feature to patterns of memory usage and to the products implementing the 22
Scenarios
Number of Obj
Average Obj Size
Largest Block Size
Core/Optional
defined
Allocated
(Bytes)
(Bytes)
Products with the feature
Sending and Receiving 5 MMS of 100 KB each
781563
92.67
96793
Optional: P1, P2
Downloading and playing
119932
83.87
46363
Optional: P1, P2, P3
Browsing the Web
201744
70.90
38859
Optional: P1, P2, P3
Phone Start-Up
26811
50.02
18400
Core Feature
a Java Midlet
Table 2 Characteristics of the scenarios Sending and Receiving
Free Block Metric−
Smallest−Biggest
Internal Fragmentation
Internal Fragmentation
5 MMS of 100KB
Average Size (Bytes)
Block Metric (Bytes)
Worst-Case (Bytes)
Average Value (Bytes)
heap bf
16489.97
669876
19454
16511.55
heap pool bf
85265.69
327264
13601
11299.17
Table 3 metrics and statistics for sending and receiving 5 MMS scenario Phone Start-Up
Free Block Metric−
Smallest−Biggest
Internal Fragmentation
Internal Fragmentation
Average Size (Bytes)
Block Metric (Bytes)
Worst-Case (Bytes)
Average Value (Bytes)
heap bf
52607.85
1175668
16972
11776.28
heap pool bf
321533.67
660204
8857
6863.53
Table 4 metrics and statistics in phone start-up
feature. During the one year the case study lasted we simulated 12 algorithms with 2 different data structures. The two data structures used were the heap and heap with a pool system, see figure 7. The algorithms simulated included first-fit, best-fit and other algorithms with various heuristics, e.g. deferred coalescing of freed blocks. In total, we investigated the performance and memory efficiency of 24 dynamic memory management systems. Simulating only 4 scenarios for each of the 24 dynamic memory management systems means creating 96 different outcomes that must be analyzed. Herein the need to focus in the analysis and the importance of selecting a manegeable number of scenarios. In this paper we report a significant example from our work. The case study presents the discussion of the best-fit algorithm used with the two different heap layouts. In the simulation, we also included the original dynamic memory management used in the Nokia S40 architecture. The performance of the S40 dynamic memory management set the reference point for the study and further proposed improvements had to be compared with its performance. However, for confidentiality reasons we cannot describe its internal structure. In table 3 and table 4 we have summarized the metrics extracted for two of the scenarios that were more dissimilarly in the data workloads. In tables 5 and 6 are presented the performance metrics. 23
Performance Metric−
Performance Metric−
Performance Metric−
Performance Metric−
5 MMS of 100KB
Worst Case Allocation
Average Scans Allocation
Worst Case Deallocation
Average Scans Deallocation
heap bf
192
69.12
198
56.31
heap pool bf
30
9.89
16
6.20
Table 5 Performance, sending and receiving 5 MMS of 100KB scenario Phone Start-Up
Performance Metric−
Performance Metric−
Performance Metric−
Performance Metric−
Worst Case Allocation
Average Scans Allocation
Worst Case Deallocation
Average Scans Deallocation
heap bf
157
31.24
169
30.70
heap pool bf
5
1.00
2
1.00
Table 6 Performance, phone start-up scenario
10
Results
The result presented does not and does not want to cover and present the definitive study on the best dynamic memory management system. The scientific literature has thoroughly investigated and analyzed dynamic memory management systems given determined patterns of allocations Grunwald and Zorn (1993); Wilson et al. (1995). An entire book describes how to manage dynamic memory in systems with limited memory Noble and Weir (2001) and dynamic memory management systems have been specifically designed for multithreaded applications Berger et al. (2000). The scope of our work is to reason and present a discussion on how to address and improve memory usage in software product family architectures. Assessing the software architecture for evolution means to estimate and evaluate the capacity of the architecture to incorporate new features. Multimedia features constitute particular challenges in the embedded systems domain. Larger memory and demanding performance requirements are the characteristics of multimedia features. However, the range of products in the S40 product family includes also basic products with core features and sometimes, with no multimedia features at all. Following the rationales described in section 4, we approached the problem by simulating scenarios including multimedia features and core features. At the end, we wanted to ascertain whether the dynamic memory management system used in the S40 was adequate or if specific and targeted product optimizations were needed. The patterns of data allocation of the features varied quite much. Table 2 shows how the largest block size increased from the phone start-up scenario to the MMS sending scenario. Multimedia features need to allocate larger contiguous memory blocks than core features. And, in case a large enough memory block is not available, the allocation fails affecting consequently the stability of the system, see 8. This trend is not going to change since multimedia features, such as video streaming, will require larger and contiguous free 24
memory blocks in the heap. Comparing the value of the FBM metric for the two different data structures used, the heap and the heap with a pool system, in table 3 and table 4, we can see that a heap with a pool system achieved a better usage of the memory. The heap with a pool system presented a higher value for the FBM metric, consequently, it presented a more compacted heap in both scenarios. To evaluate and understand whether the allocators could have failed during the scenarios, the SBBM metric was considered. The SBBM metric is a watermark; if its value is lower than the largest block allocated during the simulation of the scenario, a system failure may occur. Furthermore, values too close to the potential failure point must be avoided. In both the scenarios simulated, the value of the SBBM metric was above the largest block allocation of 100KB, see table 2, for both the allocators. However, the SBBM metric value halved in the sending and receiving 5 MMS scenario. Considering the SBBM metric, the heap data structure performed better than the heap with a pool data structure since it provided a much larger SBBM value. This result showed a limitation of the heap with the pool data structure for large block allocations compared to the heap data structure. Regarding the allocators performance, tables 5 and 6 show that the heap with a pool clearly outperforms the heap data structure. The explanation comes from the fact that the majority of the allocations were still small memory blocks, as shown by the average size of the requests, see table 2. Requests in the pool are served using a FIFO (First In First Out) policy while in the heap, the free list data structure must be traversed to serve the allocations and deallocations. Considering fragmentation, a pool system does not present external fragmentation, but it can have internal fragmentation. However, in the simulation, the internal fragmentation was lower in the heap with a pool data structure. Overall, the simulation of the best-fit with the two data structures showed that the heap with a pool was the more suitable data structure for the system considered. Small block allocations were better served by a data structure with a heap and a pool, Noble and Weir (2001). Additional optimizations for the pool data structure are still possible. For example, we used genetic algorithms to define the size of the pool data structure given the allocations workload, Del Rosso (2006). On the other hand, the pool had limitations with large block allocations. Large block allocations need a system where large and contiguous free memory blocks are available. If the trend of the increase in size of memory allocations holds and from the considerations above, optimizations for small and large block allocations may require a different dynamic memory management system. In this context, dynamic memory management from the PC world, 25
memory compaction, garbage collectors or more advanced allocators could gradually be investigated and introduced in the embedded systems domain, Lea (2006); Wilson (1992); Berger et al. (2000). The results and distintions between multimedia phones and low-end phones may have been predictable but the analysis highlighted and presented quantified results. With quantified data we had the possibility to assess the risks and analyze the tradeoffs in the product family. To summarize, different phones have different features and we considered features and scenarios as a way to identify different products. The scenario selection phase and feature analysis helped in defining the focus and the context of the analysis at the beginning. In the simulation, expertise in dynamic memory management was necessary. In the analysis we considered the performance and memory efficiency of different dynamic memory management systems. Furthermore, we focused on the improvements and tradeoffs for the S40 software product family. In our case, the dynamic memory management system was based on a heap with a pool data structure, it was part of the platform and all the products used the same implementation. Given the different features’ requirements, the analysis considered the tradeoff of custom dynamic memory management systems for different mobile phones against a common dynamic memory management system that could work well enough for the situation. Analyzing the tradeoffs between memory efficiency and software product family evolution, we chose a common dynamic memory management system based on the heap with a pool data structure. The evaluation found no real need for a targeted optimization given the current workload. Therefore, an additional variation point in the software product family architecture was avoided. A common dynamic memory system simplifies the management of the product family; it works with performance compromises but it was shown to be good enough for the system studied at that point in time.
11
Software Performance Tuning for Software Product Families
Performance analysis of software product family architectures concerns the evaluation and analysis of features, see figure 2. In this context, the selected scenarios express the link between features and products to be analyzed, see figure 1. Subsequently, architectural transformations and code optimizations are performed. Figure 2 is traversed in the other directions too, from the source code and the software architecture level to the feature level. At the end, the impact of the improvements are evaluated against all the products in the family. Depending on the stage of the software in the life cycle, different techniques 26
can be used. Simulation, modeling and prototyping techniques are applied in the early software stages. Measurements and profiling can be utilized in later stages. Different architectural transformations can be applied to the architecture design and they differ to the extent in which they cover the architecture. The transformation can have an architecture wide impact by imposing an architectural style, Shaw and Garlan (1996); Buschmann et al. (1996), or cover only a part of the architecture by applying design patterns, Gamma et al. (1995); Fowler (1999). Architectural changes to the product family reference architecture have a wide and deep impact considering that all the products in the family will be affected, positively or negatively. When changes are specifically targeted to the product architecture, improvements are made to the quality of the product; however, architectural transformations may imply changes to the reference architecture or to a common architectural component, thus, affecting other products in the family. In the first case study, in section 6, we have shown how optimizations made to the reference product family architecture benefit the entire line of products. In that case, improvements were made at a system start-up component and on the core architectural design. However, in some cases, changes may negatively affect some products in the family and their impact must be evaluated and analyzed. In the second case study, in section 9, to respond to conflicting requirements for low-end and high-end phones for memory management, we made some considerations during the analysis. While a common design approach to different requirements (low-end, high-end phones patterns of memory allocations) may not be good for some products in the family, a compromise was considered good enough, for the system considered, at that point in time. Adding targeted optimizations to different products have clear advantages in terms of performance. However, the product family’s architecture maintainability decrease with the introduction of different software modules having different implementations and parameters. Increasing the variability of the product family architecture erodes its benefits. Quality and time-to market get their strengths from the commonalities in the product family architecture which also ease the software maintenance activity. The time spent on software maintenance is expensive and has been estimated to cover 80% of the activities of the software development process, Pigoski (1996); Glass (2003). The increase of commonalities follows the natural process of the product family evolution. Features descension is the process of features once instantiated only in particular products of the family and then, included in all the products of the family, as commodities, Lehman (1994); Maccari and Heie (2005). For 27
example, this is the case of multimedia features included first only in high-end phones and then incorporated as core set features of the product family. However, even though the trend is toward an increase of commonalities, the analysis and the evaluation of the product line may highlight a divergence in the product line evolution. A product line divergence happens if a special focus and different architectural choices are needed for a subset of the products of the family or if a new subset of products are created due to the integration of new features. In these situations a split in the product family can happen with the creation of a new branch. The branch can then follow its own evolutionary path (software product family cloning) or can be incorporated in a hierarchical tree in the product family architecture as described in Bosch, Bosch (2000), as specialization. The second alternative has the advantage of exploiting the commonalities of the product family while developing solutions more appropriate for its own evolution. A careful analysis of the tradeoffs is essential in software performance analysis and the advantages and disadvantages of every choice must be considered. There is not a general solution for the tradeoffs analysis. Given a set of different architectural design solutions, the chief architects, the assessment team together with the system’s stakeholders must evaluate them and set the priorities of the assessment. For example, the analysis may set to what degree a compromise is made between software performance, software modularity and organizational issues. To conclude, the process of software performance evaluation requires a clear understanding of different domains: software architecture assessments, software performance and software product family architecture.
12
Related Work
A method to evaluate the performance of a software product family architecture includes the understanding of the different domains presented in this section. The software performance scientific literature does not have explicitly targeted software product family architectures and vice versa, software product family architecture literature does not mention software performance. Our aim is to enhance the current state of the art with the discussion of the convergence of the study of software performance in software product family architectures. The evaluation and optimization of software product family architectures require the convergence of several domains and research areas. The performance analysts must understand and be familiar with the domain of software ar28
chitecture assessments, software performance and software product family architectures. In addition, depending on the evaluation, other domains can be included, for example, dynamic memory management and embedded real-time systems architectures. Software architecture assessments have been used to evaluate software quality attributes such as evolvability, maintenability and other non-functional quality attributes that affect the whole software architecture. Different assessment methods have been experimented in the scientific literature. Scenariobased assessment methods include the SAAM (Software Architecture Analysis Method), Kazman et al. (1996), and the ATAM (Architecture Tradeoffs Analysis Method), Kazman et al. (2000), developed at the Carnegie Mellon Software Engineering Institute and described in the book, Clements et al. (2002b). Bengtsson and Bosch, Bengtsson and Bosch (1998), propose a scenario-based assessment method with emphasis on architecture (re)design. A summary and an analysis of different scenario-based assessment methods is described in Dobrica and Niemel¨a (2002). To date, none of the scenario assessment methods have explicitly investigated the evaluation of product family architectures. Even though, publications are recently focusing on the subject, Olumofin and Misic (2005). Performance is a non-functional quality attribute that is estimated using different quantitative techniques. RMA (Rate Monotonic Analysis), Klein et al. (1993); Liu and Layland (1973), is used to estimate the schedulability of tasks in real-time systems. Queuing networks are used to create models and to estimate performance and resources usage. Petri nets are used to model concurrent systems and network protocols. Markov chains represent another quantitative modeling technique to study performance analysis. In the early phases of a software development project when performance measurements of the software cannot be made, modeling, simulations and prototyping techniques are fundamental and, a good reference on modeling and performance analysis is given by Jain (1990). Later, in the software development stage, measurements, instrumentation and profiling techniques can be used to tune the existing software, Metz and Lencevicius (2003); Metz et al. (2005). Dynamic memory management is a topic that has been studied for a long time but it is still an important area where improvements can be made. A good survey and one of the most cited papers on dynamic memory management is the survey by Wilson et al. (1995). Dynamic memory management for embedded real-time systems involves optimizations for limited resources and small block allocations; design patterns for systems with limited memory are described in the book by, Noble and Weir (2001). On the other hand, embedded devices are becoming more and more advanced with several functionalities. Appli29
cations that once ran only in the PC world are now found in mobile phones called smart-phones. The trend is toward larger memory allocations and memory systems with an architecture similar to desktop computers. Approaches optimized for multithreaded and distributed applications may gradually be introducted in the embedded domain on the high-end segment, Berger et al. (2000). Model predictions and analysis techniques are included in software performance evaluation methods to offer a quantitative approach to construct software systems that meet performance objectives. The most well known method is the SPE (Software Performance Engineering) method by Smith and Williams (1995). SPE uses models to evaluate the tradeoffs and design choices to improve the architecture design and the implementation of software systems. The Pasa method Williams and Smith (2002) illustrates the use of SPE when applied to software performance assessments. A software component has been defined as unit of composition with contractually specified interfaces and explicit context dependencies only. A software component can be deployed independently and is subject to composition rules, Weck et al. (1998). Research on component-based software engineering, Szyperski (1997), has also focused on performance evaluations and assessments. For example, predictable assembly focuses on assembling component-based systems that predictably meet their quality attributes, Hissam et al. (2003). Scenariobased approaches have been used to predict real-time properties and qualities of component-based systems, Bondarev et al. (2004); de Jonge et al. (2003). The SPE method has been adapted and used to analyzed the performance of component-based systems, Bertolino and Mirandola (2003b,a). Even though component-based systems share a common conceptual base with software product family architectures there are various elements and concepts which differentiate them. Components in the software product family domain tend to be relatively large and have the concepts of variability and commonality, Van Gurp et al. (2001); Svahnberg et al. (2005). A component in the software product family domain has still the property of easily incorporate new requirements but it must also cover the differences in component requirements between various products. Product family architectures may include low-end and high-end products. Additionally, different design choices may have been implemented and instantiated in different product categories. A thorough analysis of the tradeoffs and design alternatives must be investigated and this was one of the scopes of our paper. To our knowledge, none of the work on software performance have focused on software product family architectures. We have applied and extended the SPE to cover software product family architectures emphasizing the analysis of the tradeoffs, design and implementation choices, Del Rosso 30
(2005a, 2006b, 2004). Several publications in the literature cover the design and the evolution of a software product family, a list of relevant books include Jazayeri et al. (2000); Bosch (2000); Clements and Northrop (2002); Gomaa (2004). However, none of them investigate software performance and its impact on software design and evolution of a software product family.
13
Conclusion and future work
In this work we have described performance evaluations of real-time embedded systems in the context of software product family architectures. Evaluating performance on these various domains constituted the main challenge. The approach we have used is scenario-based and scenarios are used to specify the focus of the analysis. In the scenario selection phase, domain analysis is performed to delimit the part of the product family architecture we want to analyze. After the scenarios selection phase, simulations and performance models are used. In the analysis phase, the improvements are considered against the impact on the architecture. The analysis of the tradeoffs includes the investigation of the impact on the product family architecture. We have used the approach within a Nokia product family architecture and we have reported two case studies. The first case study concerned the performance tuning of the software core platform and its core features. The second case study focused on dynamic memory management efficiency and on the impact of multimedia features on the software product family architecture. In section 11, we have analyzed and discussed the impact of different optimizations on product family architectures and suggested the advantages and disadvantages of different architectural choices. In future work, we plan to continue the study of how to improve software performance in the context of software product family architectures. An additional interesting topic is to study other non-functional quality attributes and their impact on software product family architectures.
Acknowledgements This work is the result of architecture evaluations carried out by the Nokia Research Center for the Nokia Mobile Phones business unit during a three year 31
period. In this regard, I would like to thank Andy Turner and Erling Stage for the cooperation and support in our work. I would like to thank Jan Bosch, Jilles Van Gurp, Adrian Flanagan, Jianli Xu, Yaojin Yang, Claudio Riva and all the anonymous reviewers who have contributed to the improvement of the quality of the paper.
A
Fragmentation and Memory Efficiency
Memory fragmentation is the result of allocations and deallocations made by the software during its lifetime which divides the memory into used and unused areas. For every memory allocation request, the dynamic memory system must find a large enough free block in due time. As consequence of high fragmentation, a large-enough contiguous memory block may not be found, leading to errors and system failures. The failure to deallocate a block in due time may affect the normal software operation with no predictable consequences. The metrics presented in the subsections below aim to highlight potential problems in the dynamic memory management system and offer guidance in the analysis. Fragmentation and memory efficiency metrics measure the efficiency of memory usage. On the other hand, performance metrics are used to evaluate whether the system is able to satisfy time deadlines and performance. Other measures of fragmentation have been described, Johnstone and Wilson (1998); Wilson et al. (1995), however we needed to focus on the characteristics of real-time embedded systems. Strict real-time deadlines makes the use of memory compaction algorithms and garbage collectors inconvenient and, explicit memory allocators still outperform allocators with indirect memory access in terms of performance and memory usage, Berger and Hertz (2005); Prechelt (2000). Enhancing the memory usage in embedded real-time systems means limiting the fragmentation, in order to have large enough free blocks to serve future allocation requests, and to ensure real-time requirements. Metrics that measure fragmentation, memory usage efficiency and performance in the context of embedded real-time systems must be able to highlight these issues.
A.1 Smallest-Biggest Block Metric (SBBM) When serving a request, the main concern of the dynamic memory system is to find a large enough free block. Because of fragmentation, a large enough free block may not be found even though the aggregate amount of free memory is higher than the request. In the case that a free block is not found, a failure arises. 32
Allocated Memory
Free Memory
t1
10KB
14KB
6KB
Biggest allocable block= 14KB
t2
10KB
16KB
6KB
Biggest allocable block= 16KB
6KB
Biggest allocable block= 22KB
t3
22KB
12KB
Smallest block= 14KB
Fig. A.1. Smallest-Biggest Block Metric
KB
Heap-size
SBBM
100
Largest allocated block
t Fig. A.2. Smallest-Biggest Block Metric
The Smallest-Biggest Block Metric (SBBM) is extracted by analyzing the heap during the entire simulation and by recording the largest free block in the memory. At the end of the simulation, the minimum of these values is the SBBM metric, see figure A.1. If shown in a graph, the value of SBBM represented as a function of the time is a monotonically decreasing function. A request larger than the SBBM may have failed during the simulation. The graph in figure A.2 shows an hypothetical situation where this happens. In the figure, the SBBM metric value is smaller than the largest memory request during the simulation and a potential software failure might have happened. The metric is expressed in bytes. 33
A.2 Free Block Metric - Average Size (FBM-AS) The Free Block Metric − Average Size (FBM−AS) is the average size of free blocks in the heap during the simulation. The metric is expressed in Bytes. The metric highlights the fact that a heap with larger free blocks, on average, is more compact, and therefore, less fragmented. The metric is expressed in Bytes to compare the average value with the largest request during the simulation of the scenario. However, to compare this fragmentation value with other heap sizes, the metric can be normalized to the heap size and a value between 0 and 1 can be returned. In case of 1 we have a free heap with no allocations and, in case of values close to 0 we have a heap that is very fragmented.
A.3 Internal Fragmentation (IF) Internal fragmentation measures the memory wasted (in Bytes) when a request is served by a larger free block. The memory wasted is internal to the allocated block, therefore, it is called internal fragmentation. Unfortunately it is not always possible to allocate exactly the free block size, as rounding up the requests, for example, contributes to the internal fragmentation. In some allocators, the free block is split and only the necessary chunk of memory is allocated; however, leaving small blocks in the memory contributes to the increase of the external fragmentation, especially if the remaining chunk of free memory is smaller than the minimum block size allocable in the system. As an example, segregated free lists do not contribute to the external fragmentation, but they do contribute to the internal fragmentation when a request is served by a larger chunk of free memory.
A.4 Performances Metric (PM) A different approach is needed when measuring performance in a simulation environment. In this case, performance cannot be measured using the execution time. The metric described here measures the performance using the number of scans in the data structure needed to allocate and deallocate a memory block. Whenever an application requests a free block, the dynamic memory management system must find, in due time, a large enough free block. At the same 34
time, when a block is deallocated, it must be inserted at the right place in the list of free blocks. For example, a size-ordered free list will require the insertion of a freed block at the right position in the list according to its size. The allocators used in the experiment have implemented the free list using a linked list data structure. Performance is measured in this case as the number of scans in the linked list. A different data structure can be used without invalidating the metric. The performance metrics have been used for memory allocations and deallocations to measure the average and the worst case value. The worst case value is important when evaluating real-time systems. These performance metrics have the benefit of being CPU independent. Therefore, the metric values are not influenced by the trace instrumentation technique used for extracting the data. Including trace instrumentation in the source code adds performance overhead that is not easy to calculate and in some cases can harm and corrupt the performance measurements, Steward (2001), even though attempts have been made to limit the problem, Metz and Lencevicius (2003); Metz et al. (2005).
References Apache Foundation, 2006. Apache web server: http://www.apache.org. Bengtsson, P., Bosch, J., June 1998. Scenario-based software architecture reengineering. Proceedings of the Fifth International Conference on Software Reuse (ICSR), 308–317. Berger, E. D., Hertz, M., October 2005. Quantifying the performance of garbage collection vs. explicit memory management. Proceedings of the 20th annual ACM SIGPLAN conference on Object oriented programming systems languages and applications 40 (10), 313 – 326. Berger, E. D., McKinley, K. S., Blumofe, R. D., Wilson, P. R., November 2000. Hoard: a scalable memory allocator for multithreaded applications. Proceedings of the ninth international conference on Architectural support for programming languages and operating systems 28,34 (5,5), 117–128. Berger, E. D., Zorn, Benjamin G.and McKinley, K. S., November 2002. Reconsidering custom memory allocation. Proceedings of the Conference on Object-Oriented Programming: Systems, Languages, and Applications (OOPSLA). Bertolino, A., Mirandola, R., 2003a. Modeling and analysis of non-functional properties in component-based systems. Proc. International Workshop on Test and Analysis of Component Based Systems TACoS 2003 82 (6). Bertolino, A., Mirandola, R., 2003b. Towards component based software performance engineering. Proc. 6th Workshop on Component-Based Software Engineering: Automated Reasoning and Prediction, 1–6. Bondarev, E., Muskens, J., de With, P., Chaudron, M., Lukkien, J., 2004. Pre35
dicting real-time properties of component assemblies: A scenario-simulation approach. In: EUROMICRO ’04: Proceedings of the 30th EUROMICRO Conference (EUROMICRO’04). IEEE Computer Society, Washington, DC, USA, pp. 40–47. Bosch, J., 2000. Design and Use of Sofware Architectures. Addison Wesley. Buschmann, F., Meunier, R., Rohnert, H., Sommerlad, P., Stal, M., Sommerlad, P., 1996. Pattern-Oriented Software Architecture, Volume 1: A System of Patterns. John Wiley & Sons. Clements, P., Bachmann, F., Bass, L., Garlan, D., Ivers, J., Little, R., Nord, R., Stafford, J., 2002a. Documenting Software Architectures: Views and Beyond. Addison-Wesley. Clements, P., Kazman, R., Klein, M., 2002b. Evaluating Software Architecture. Addison-Wesley. Clements, P., Northrop, L., 2002. Software Product Lines. Addison Wesley. Cockburn, A., 1996. The interaction of social issues and software architecture. Commun. ACM 39 (10), 40–46. Conway, M., 1968. How do committees invent. Datamation 14 (4), 28–31. Dan Lo, C.-T., Srisa-an, W., Chang, J. M., August 2004. The design and analysis of a quantitative simulator for dynamic memory management. The Journal of Systems and Software 72 (3), 443–453. de Jonge, M., Muskens, J., Chaudron, M., 2003. Scenario-based prediction of run-time resource consumption in component-based software systems. Proceedings of the 6th ICSE Workshop on Component-based Software Engineering (CBSE6), 19–24. Del Rosso, C., March 24-26 2004. The process of and the lessons learned from performance tuning of a product family software architecture for mobile phones. Proceedings of the 8th European Conference on Software Maintenance and Reengineering Tampere, Finland. Del Rosso, C., 2005a. Dynamic memory management for software product family architectures in embedded real-time systems. Proceedings of the 5th Working IEEE/IFIP Conference on Software Architecture (WICSA’05), 211–212. Del Rosso, C., November 2005b. Performance analysis framework for large software intensive systems with a message passing paradigm. Proceedings of 20th Annual ACM Symposium on Applied Computing, track Embedded Systems: Applications, Solutions, and Techniques (EMBS), Santa Fe, New Mexico, March 13 -17, 2005. Del Rosso, C., 2006a. Continuous evolution through software architecture evaluation. Journal of Software Maintenance and Evolution: Research and Practice 18 (5), 351 – 383. Del Rosso, C., April 2006b. Experiences of performance tuning software product family architectures using a scenario-driven approach. Proceedings of the 10th International Conference on Evaluation and Assessment in Software Engineering (EASE), British Computer Society, 30–39. Del Rosso, C., 2006. Reducing internal fragmentation in segregated free lists 36
using genetic algorithms. Proceedings of the 2nd International ACM Workshop on Interdisciplinary Software Engineering Research (WISER), 143 – 150. Dobrica, L., Niemel¨a, E., July 2002. A survey on software architecture analysis methods. IEEE Transaction on Software Engineering 28 (7), 638–652. Fowler, M., 1999. Refactoring, improving the Design of the existing code. Addison Wesley. Free Software Foundation, 2006. Gcc home page: http://gcc.gnu.org/. Gamma, E., Helm, R., Johnson, R., Vlissides, J., 1995. Design Patterns. Addison Wesley. Glass, R. L., 2003. Facts and Fallacies of Software Engineering. Addison Wesley. Gomaa, H., 2004. Designing Software Product Lines with UML. Addison Wesley. Griss, M. L., Favaro, J., D’Alessandro, M., June 1998. Integrating feature modeling with rseb. Proceedings of the Fifth International Conference on Software Reuse, 76–85. Grunwald, D., Zorn, B., August 1993. Customalloc: Efficient synthesized memory allocators. Journal Software: Practice and Experience 23 (8), 851–869. Herbsleb, J. D., Grinter, R. E., 1999. Splitting the organization and integrating the code: Conway’s law revisited. In: ICSE ’99: Proceedings of the 21st international conference on Software engineering. IEEE Computer Society Press, Los Alamitos, CA, USA, pp. 85–95. Hissam, S., Moreno, G., Stafford, J., Wallnau, K., 2003. Enabling predictable assembly. J. Syst. Softw. 65 (3), 185–198. Jain, R., 1990. Art of Computer System Performance Analysis. John Wiley & Sons. Jazayeri, M., Van Der Linden, F., Ran, A., 2000. Software Architecture for Product Families. Addison Wesley. Johnstone, M. S., Wilson, P. R., October 1998. The memory fragmentation problem: Solved? Proceedings of the 1st international symposium on Memory Management 34 (3). Kang, K., Cohen, S., Hess, J., Novak, W., Peterson, A., S., 1990. Featureoriented domain analysis (foda). Software Engineering Institute, Carnegie Mellon University technical report (CMU/SEI-90-TR-021). Kang, K., Kim, S., Lee, J., Shin, E., Hu, M., January 1998. Form: A featureoriented reuse method with domain-specific reference architectures. Annals of Software Engineering 5 (0), 143–168. Kazman, R., Abowd, G., Bass, L., Clements, P., November 1996. Scenariobased analysis of software architecture. IEEE Software, 47–55. Kazman, R., Klein, M., Clements, P., 2000. Atam: A method for architecture evaluation. Technical Report CMU/SEI-2000-TR-004. Klein, M., Ralya, T., Pollak, B., Obenza, R., Gonzales Harbour, M., 1993. A Practitioners Handbook for Real-Time Analisys. Kluwer Academic. Knowlton, K. C., October 1965. A fast storage allocator. Communications of 37
the ACM 8 (10), 623 – 624. Knuth, D. E., 1997. The Art of Computer Programming, Vol 1, Third Edition. Addison Wesley. Lea, D., 2006. A memory allocator. http://gee.cs.oswego.edu/dl/html/malloc.html. Lehman, M. M., 1994. Software Evolution. John J. Marciniak (Editor), John Wiley & Sons. Liu, C. L., Layland, J. W., 1973. Scheduling algorithms for multiprogramming in a hard real-time environment. Journal of the ACM (JACM) 20 (1), 40 – 61. Maccari, A., Heie, A., February 2005. Managing infinite variability in mobile terminal software. Software: Practice and Experience 35 (6), 513 – 537. Metz, E., Lencevicius, R., May 3-11 2003. Efficient instrumentation for performance profiling. Proceedings of the ICSE Workshop on Dynamic Analysis, (WODA). Metz, E., Lencevicius, R., Gonzalez, T. F., 2005. Performance data collection using a hybrid approach. In: ESEC/FSE-13: Proceedings of the 10th European software engineering conference held jointly with 13th ACM SIGSOFT international symposium on Foundations of software engineering. ACM Press, New York, NY, USA, pp. 126–135. Microsoft Corporation, 1997. Microsoft Windows NT 4.0 Online Documentation. Microsoft Corporation, Redmon, Washington. Noble, J., Weir, C., 2001. Small Memory Software: Patterns for system with limited memory. Addison Wesley. Olumofin, F., Misic, V., 2005. Extending the atam architecture evaluation to product line architectures. Proceedings of the 5th IEEE/IFIP Working Conference on Software Architecture. (WICSA). Pigoski, T. M., 1996. Practical Software Maintenance: Best Practices for Managing Your Software Investment. John Wiley & Sons. Prechelt, L., October 2000. An empirical comparison of seven programming languages. IEEE Computer 33 (10), 23–29. Purdom, P. W. J., Stigler, S. M., October 1970. Statistical properties of the buddy system. Journal of the ACM (JACM) 17 (4), 683 – 697. Ran, A., Lencevicius, R., 2003. Making sense of runtime architecture for mobile phone software. In: ESEC/FSE-11: Proceedings of the 9th European software engineering conference held jointly with 11th ACM SIGSOFT international symposium on Foundations of software engineering. ACM Press, New York, NY, USA, pp. 367–370. Randell, B., Kuehner, C. J., May 1968. Dynamic storage allocation systems. Communications of the ACM 11 (5), 297 – 306. Ritcher, J., 1997. Advanced Windows, 3rd edition. Microsoft Press. Riva, C., October 2004. View-based software architecture reconstruction. PhD dissertation, Vienna University of Technology. Rumbaugh, J., Jacobson, I., Booch, G., 2005. The Unified Modeling Language Reference Manual, second edition. Addison-Wesley. SGI, 2006. Standard template library: http://www.sgi.com/tech/stl/allocators.html. 38
Shaw, M., Garlan, D., 1996. Software Architecture: Perspective on an Emerging Discipline. Prentice Hall. Smith, C. U., Williams, L. G., 1995. Performance Solutions. Addison Wesley. Steward, D., April 2001. Measuring execution time and real-time performance. Embedded Systems Conference (ESC). Svahnberg, M., Van Gurp, J., Bosch, J., 2005. A taxonomy of variability realization techniques. Software: Practice and Experience 35, 705–754. Szyperski, C., 1997. Component Software - Beyond Object-Oriented Programming. Addison-Wesley. Van Gurp, J., Bosch, J., Svahnberg, M., 2001. On the notion of variability in software product lines. Proceedings of the Working IEEE/IFIP Conference on Software Architecture, WICSA, 45–54. Weck, W., Bosch, J., Szyperski, C., 1998. Proceedings of the third International Workshop on Component-Oriented Programming (WCOP) (10). Williams, L. G., Smith, C. U., ISBN:1-58113-195-X 2000. Software performance antipatterns. Proceedings of the second international workshop on Software and performance, 127 – 136. Williams, L. G., Smith, C. U., 2002. pasaSM : An architectural approach to fixing software problems. Proceedings of the third international workshop on Software and Performance (ISBN:1-58113-563-7), 179 – 189. Wilson, P., November 1992. Uniprocessor garbage collection techniques. International Workshop on Memory Management, Lecture Notes in Computer Science (637), 1–42. Wilson, P. R., Johnstone, M. S., Neely, M., Boles, D., September 1995. Dynamic storage allocation: A survey and critical review. Proc. Int. Workshop on Memory Management Kinross, Scotland, UK.
39