tion software, be customized to applications like air traffic control, command and control centers, and wireless network switching systems. The multi-tasking ...
PERFORMANCE TUNING OF PARALLEL REALTIME VOICE COMMUNICATION SOFTWARE Hermann Hellwagner, Klaus Leopold1; Ralf Schlatterbeck, Carsten Weich2 1
Institute of Information Technology, University Klagenfurt, Austria, {hellwagn,klaus}@itec.uni-klu.ac.at; 2 Frequentis Nachrichtentechnik GmbH, Vienna, Austria, {rschlatt,cweich}@frequentis.com
Key words:
Parallel programming, performance analysis, communication software, real time, fault tolerance
Abstract:
This paper describes an unconventional way to apply a performance analysis tool for parallel programs (Vampir) to understand and tune the performance of the real-time voice and data communication software running on top of Frequentis’ V4 switch. The execution schedule of the strictly time-triggered V4 switching software is computed off-line; analyzing the schedule to identify e.g. performance bottlenecks used to be a complex and time-consuming process. We present our approach to transform the V4 software schedule’s information into Vampir trace files and use this tool’s facilities to provide a visualization of the schedule. A case study illustrates the benefits of this approach.
1.
INTRODUCTION
Frequentis has for many years provided switching technology for critical voice communication applications. The latest switch generation, called the V4 switch, is a parallel, fault-tolerant, real-time voice and data communication system that can, by virtue of modular hardware and appropriate application software, be customized to applications like air traffic control, command and control centers, and wireless network switching systems. The multi-tasking real-time operating system as well as protocol processing and application software of the V4 switch strictly adhere to a timetriggered execution model. Both processing and communication activities of 57
58
Hellwagner, Leopold, Schlatterbeck, Weich
the software components (threads) are statically scheduled. However, if a given V4 switch configuration is being overloaded with software modules, the scheduler may compute a sub-optimal schedule only or may even fail to generate a valid schedule. For such cases, the software engineers may provide hints to the scheduler, e.g. priorities of and dependencies among threads. To identify the causes of scheduling problems or to analyze and tune the performance of their software, the engineers until recently had to inspect the scheduler’s text output; for the case of hundreds of threads in large-scale applications, this clearly is a highly time-consuming and error-prone task. This paper describes a simple, yet effective way to visualize a V4 switch’s static software schedule: the V4 schedule is transformed into the trace file format of one of a well-known graphical performance analysis tools for parallel programs (Vampir), and the tool’s various display and trace replay facilities are used to inspect the V4 switch’s software behavior. A case study given in this paper will illustrate the benefits of this approach.
2.
FREQUENTIS V4 SWITCH TECHNOLOGY
Switch Architecture. The Frequentis V4 switch is a parallel, faulttolerant, real-time, digital switch for voice and data communication systems. A detailed description of the V4 switch is given in [3], an overview in [4]. Many of the V4 concepts stem from the MARS project at TU Vienna [5]. The core of the V4 architecture is the V4 ring which interconnects up to twelve nodes using triple-redundant internal communication lines. Each node consists of a carrier board and up to four CPU or I/O modules. CPU modules provide processing power to the V4 switch. I/O modules carry interface and driver circuitry and provide connectors for adapters to peripheral devices (e.g. microphones) and external communication lines (e.g. ATM). Software Concepts. The software basis on the V4 switch comprises the operating system, system services like signal processing tasks (e.g. filters, codecs), device drivers, user channel switching, voice and data communication protocol modules, and application software tasks. V4 software consists of processes which comprise a number of threads and exchange messages with each other. A thread is periodically executed; a single invocation is called a thread instance. Thread instances have a simple structure: they usually receive some input messages, perform some computation (without blocking), and produce some output messages. Scheduling Requirements. Threads are the principal active entities in V4 software systems and thus consume processing power. Similarly, messages arriving from communication lines or peripheral devices or being produced by threads, consume V4 ring bandwidth. Packing these computational
Performance Tuning of Parallel Voice Communication Software
59
and communication activities into a valid real-time execution plan under manifold requirements and resource constraints [4], represents a complex task that the V4 off-line scheduler has to solve.
3.
V4 SCHEDULE VISUALIZATION
The basic idea behind the V4 schedule visualization was to transform the V4 scheduler output into the trace format of a well-established graphical performance analysis tool for parallel programs and utilize the tools’ various graphs and statistics to understand the V4 schedule. Vampir [6] was selected as the tool best suited for the V4 schedule visualization, primarily due to its versatility, robustness, and good documentation. (For the eight candidate tools – Jumpshot, Medea, NTV, Pablo, Paragraph, Trace Invader, Vampir, VT [1][2] – and a description of the evaluation process, see [4].) The V4 off-line scheduler was then extended to generate Vampir trace files [6] and supplementary information. The threads running on the V4 switch represent the active entities in the Vampir trace. The threads can be in states busy and idle and exchange messages among each other. Threads are numbered contiguously in the trace file. The resulting timeline (or spacetime) diagram, which is the most useful diagram for V4 schedule visualization, is easily understood and can display up to several hundred threads. Vampir’s select, zoom, and scroll features allow to easily focus in on the threads and the time interval of interest; see Figure 2 for a small example.
4.
CASE STUDY: CALL SETUP SOFTWARE
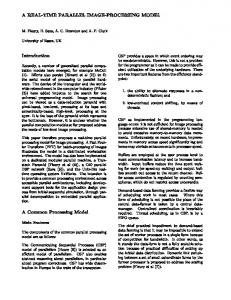
It is essential that critical voice communication software exhibits good and stable performance. Yet, in a mobile communication system currently under development, it was observed that the call setup procedure performed several times worse than expected. The reasons for this adverse behavior were not fully known to the software engineers. One of the first uses of the V4 schedule visualization was therefore to explore the behavior and tune the performance of the call setup procedure in this application. Call setup is part of the V4 call control software. Call control receives call setup messages from the V4 protocol control software of a communication link, as shown in Figure 1. Call control then performs a location lookup to locate the called partner in the mobile network, asks the so-called router software (not shown) to find a communication interface leading to the partner, and accesses the protocol control software of that interface to actually
60
Hellwagner, Leopold, Schlatterbeck, Weich
process the call setup. Programmers have identified the threads and communication links depicted in Figure 1 as potentially time critical for the whole procedure. The call control threads (those within the dotted box) run on the same CPU module, whereas the other threads may reside on different CPUs. Call Control
Thread 41
(recv)
(main)
Thread 335
Location Lookup
(send)
Thread 42
Thread 39
Thread 320
Thread 47
Protocol Control
Figure 1 Performance-critical threads in V4 voice call control software
Figure 2 illustrates the scheduled behavior of these threads in a timeline diagram. Notice that the threads execute periodically every 8 ms. The call control threads can communicate via shared memory; hence, no message exchange among them is visible in the diagram. Furthermore, threads 41 and 42 which appear to run “simultaneously” on the same CPU, in fact obey mutual exclusion constraints imposed on them by the scheduler. Finally, notice that the lines depicting the messages in the diagram denote the time intervals when the messages are effectively being transferred on the V4 ring, not when they are being produced or consumed by thread instances; the latter occurs at the end or beginning, respectively, of thread instances only. A study of the timeline in Figure 2 reveals four sources of inefficiencies in the given call setup procedure: 1. Thread 42 which receives call setup requests from protocol control (thread 320), thread 41 which handles the requests, and thread 39 which finally sends messages back to protocol control, are scheduled just in the wrong order. As a consequence, a request consumed by thread 42 (e.g. at time 5 ms) is processed by the subsequent instance of the main thread 41 (e.g. at time 13 ms) and replied to not earlier than one instance of the sending thread 39 later (e.g. not earlier than at time 19 ms). 2. The messages received by thread 320 from thread 39 (e.g. at time 8.5 ms), apparently arrive too late to be consumed by the current thread instance; their receipt is postponed by 8 ms (e.g. to time 16 ms). 3. The messages sent by thread 320 to thread 42 are scheduled very late (e.g., the message sent at time 11 ms must have been produced by the previous thread instance starting at time 0).
Performance Tuning of Parallel Voice Communication Software
61
4. Inspecting the message details (which pop up by clicking on a message instance) discloses that one of the messages is slightly too large to fit into a given data channel, requiring a second one which is apparently scheduled subsequent to the first one.
Figure 2 Visualization of V4 voice call control software activities
The study of this visualization enabled the programmers to locate the performance bottlenecks and identify opportunities for software optimizations and devising hints to the scheduler, e.g., by specifying time intervals for the critical threads’ invocations (to enforce their execution in the correct order).
REFERENCES [1] EU Working Group APART (Automatic Performance Analysis: Resources and Tools). http://www.fz-juelich.de/apart. [2] S. Browne, J. Dongarra, K. London: Review of Performance Analysis Tools for MPI Parallel Programs. 1996. http://www.cs.utk.edu/~browne/perftools-review. [3] Frequentis Nachrichtentechnik GmbH: V4 System Description. 1999. [4] H. Hellwagner, K. Leopold: Performance Tuning of Parallel Real-Time Voice Communication Software. Technical Report TR/ITEC/00/1.02, Institute of Information Technology, University Klagenfurt, May 2000. http://www.itec.uni-klu.ac.at. [5] H. Kopetz, A. Damm, C. Koza, M. Mulazzani, W. Schwabl, C. Senft, R. Zainlinger: “Distributed Fault-Tolerant Real-Time Systems: The Mars Approach”. IEEE Micro, Feb. 1989. [6] Pallas GmbH: VAMPIR 2.0 User’s Manual. 1999. http://www.pallas.de.