Journal of Electrical Engineering www.jee.ro
Solving Dynamic Economic Dispatch With Modified PSO Algorithm Considering Valve Point Effects And Ramp Rate Limits M. Hamed, B. Mahdad, K. Srairi and N. Mancer Department of Electrical Engineering, Biskra University, Biskra, 07000 Algeria email:
[email protected]
Abstract: The practical dynamic economic dispatch (DED),
methods enable to obtain the optimal solution and these
with consideration of valve-point effects, and ramp up, ramp
method leads to suboptimal solution [6].
down generators constraints considered as a complicated non-linear constrained optimization problem. In this paper,
New techniques are being used in the last years to tackle
a new variant swarm optimization based time varying
the (DED) problem in a more efficient and quality
acceleration (PSO-TVAC) proposed to solve this problem.
convergence. A lot of works are studied and reported in
This algorithm has been compared and found to be superior
literature, recently evolutionary algorithm is applied by G.
compared to the results of classical (PSO) and (GA) method
Ching et al. to solve dynamic economic dispatch with
in term of solution quality and convergence characteristic.
energy saving and emission reduction [7]. Ivatloo et al. proposed time varying acceleration coefficients IPSO for
Key words: Dynamic economic dispatch, Non-smooth cost function, PSO-TVAC, GA, Valve point effect, Ramp rate limits.
solving dynamic economic dispatch with non-smooth cost function [6.] A group search optimizer with multiple producers
1. INTRODUCTION
algorithm is treated by C.X. Guo et al. to solve the
Dynamic economic dispatch (DED) is one of the
dynamic economic emission dispatch problem [8].The
important power system optimization problems which is a
artificial immune system algorithm is proposed by S.
non-linear
optimization
Hemamalini et al. to solve the dynamic economic
problem. (DED) is a method to dispatch the generating
dispatch for units with valve point effect [2]. A hybrid
units to the predicted load demands over a certain period
algorithm approach based on sequential combination of
of time at minimum operating cost while satisfying
(GA) and active power optimization using Newton’s
equality and inequality constraints[1-2]. There were many
second order approach is presented by T. Nadeem Malik
methods applied to solve the dynamic economic dispatch,
et al to solve economic dispatch problem with valve point
such as dynamic programming [3], linear programming
effect [9]. The Hopfield neural network method is applied
[4], Lagrange relaxation method [5], but the nonlinearity
too by A.Y. Abdelaziz et al to solve this problem [10].
and discontinuity of the search space makes all these
Mahdad and Srairi [18] proposed a combined method
and
complicated
dynamic
1
Journal of Electrical Engineering www.jee.ro
based GA-DE-PS to solve practical economic dispatch
electrical network test system using 5 and 10 unit test
considering power losses and valve point effects.
system.
It can be seen that recently the meta-heuristic optimization methods have been significantly used in (ED) and considered as an alternative to the classical methods, primarily due to theirs nice feature of population-based search. Particle swarm optimization is
2. Problem Formulations 2.1 Objective Function The objective function of (DED) problem is to minimize the total production cost over the operation period, which can be written as :
such a technique. We adopt PSO to handle the complexity and nonlinearity of the problem [11-12]. PSO has several key
advantages
over
other
existing
robustness [11-13]. PSO is easy to implement in computer using
basic
mathematical
and
ng
(1)
t =1 i =1
optimization
techniques in terms of simplicity, convergence speed, and
simulations
T
minTC = ∑∑ Cit ( Pit ) Where Cit is the unit i production cost at time t; number of generation units and
logic
operations, since its working mechanism only involves two fundamental updating rules. PSO also has fewer operators to adjust in the implementation, and it can be flexibly combined with other optimization techniques to
ng is the
Pit is the power output of
it unit at time t. T is the total number of hours in the operation period. The cost function is nonlinear characteristic
which represented by the following
formula: ng
F ( pit ) = ∑ ai + bi pit + ci pit 2
build hybrid algorithms [11-14-15].
i =1
The mechanism of PSO facilitates a better convergence
+ ei + sin( fi ( pit
performance than some other optimization procedures like
min
(2)
− pit ))
computationally
ai ,bi ,ci ,ei , and f Cost generators coefficients. The
expensive evolutionary operations such as crossover and
objective function of the (DED) problem should be
mutation [11]. Unlike the traditional optimization
minimized subject to following equality and inequality
algorithms, PSO is a derivative-free algorithm and thus it
constraints:
is especially effective in dealing with complex and
A.
genetic
algorithms,
which
have
The equality constraints are
nonlinear problems. PSO is more robust to deal with such ng
problems, since it is less sensitive to the nature of the
∑p i =1
objective function in terms of convexity and continuity [16], and the inner working of PSO helps to escape local minima. The robustness of PSO can also be reflected by its less sensitivity to the optimizer parameters as well as
it
= pd ( t )
t = 1.2.3.......T
(3)
,
B.
Inequality constraints:
p mini ,t ≤ pi ,t ≤ p maxi ,t
Which: i=1:ng ,
(4)
the initial solutions to start its iteration process [11]. In this paper, a novel Time Varying Acceleration particle
pi min , pi max are the maximum and the minimum of unit’s production.
swarm optimization (PSO-TVAC) algorithm is proposed to deal with the dynamic economic dispatch problem without considering losses. The effectiveness of the
3. Particle swarm optimization with time varying acceleration coefficients PSO-TVAC
proposed approach is demonstrated on a practical
In this new algorithm based (PSO) the cognitive and social factors are not constant but they are function of
2
Journal of Electrical Engineering www.jee.ro
generation (time) to explore most all the positions space
Step 1: Initialized of the Population.
research due eliminate the local minima , overcome the
Step 2: Evaluation of the mechanism search of PSO-
non linearity of the equation (2), so it represent then an
TVAC:
challenge advantage. The position and velocity of the ith
1-Velocity equation
particle are modeled by the following equations
2-Position equation
v (t + 1) = w * v (t ) + α1 * rand1 * ( Pi − x (t )) + α 2 * rand 2 * ( Pb − X (t )) x (t + 1) = x (t ) + v (t + 1)
Step 3: if iter< itermax return to the Step 2. (5)
α1 =((c1f −c1i ).iter / itermax ) +c1i α2 =((c2 f −c2i ).iter / itermax ) +c2i
(6)
Step 4: stock the best cost and their optimal unit generation.
5. Simulation results: Test system 1
Where: x (t ) is the Particle initial position, v (t ) is
First we are applied the proposed approach at 5 unit
Particle initial velocity, v (t + 1) is new particle
test system, the cost coefficients, generators limits and
velocity, x (t + 1) : A new particle position, Pi : Best
load demand in each hour are taken from [6] and
w : Inertia
power generation obtained without considering ramp
iter Iteration number, itermax : Maximum
rate limits. Table. 3 shows the optimal power
0.4 ≤ w ≤ 0.9 , α 1 , α 2 , w are
generation obtained considering ramp rate limits.
local solution, Pb : Best global solution, factor,
depicted in appendix. Table. 1 shows the optimal
iteration number, and
respectively cognitive, Social, and inertia factors.
C1i , C1 f , C2i , C2 f initial and final values of cognitive
Table. 2, table.4 represent a comparison between GA, PSO and the proposed algorithm in each case respectively. 4
and social factors [17].
5.66
x 10
5.65
5.1 Algorithms parameters
GA PSO PSO-TVAC
5.64
5.63
selection and the maximum of iteration are set respectively 16; 50%, 100.The crossover and the mutation set respectively 0.5; 0.15.
C Ost($/h)
1. GA: binary genetic algorithm, the population size;
5.62
5.61
5.6
2. PSO: standard (PSO), the population size; and the
5.59
maximum of iteration are set respectively 16; 100. 5.58
The
coefficients
of
the
equation
(5)
are
constants α1 = α 2 = w = 1 3. PSO-TVAC: the population size; and the maximum of iteration are set respectively 16; 100.
5.57
10
20
30
40
50
60
70
80
90
100
generatipon
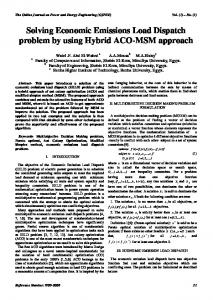
Fig.1 Convergence characteristic of GA; PSO and PSOTVAC for 5 unit test system without considering ramp rate limits.
The algorithm of optimization is based on the following steps:
3
Journal of Electrical Engineering www.jee.ro
Test system 2 To verify the robustness of the proposed approach the
Table. 5 shows the optimal power generation obtained
algorithm has been applied on a large scale network 10
in ten execution solution of dynamic economic
unit test system. All generators data are taken from [6].
dispatch without considering ramp rate limits. Table.7 shows
2400
the
optimal
power
generation
obtained
considering ramp rate limits. Table. 6 and Table. 8 2350
illustrate a comparison between GA, PSO and the
PSO PSO-TVAC GA
proposed algorithm in each case respectively.
C Ost($/h)
2300
Fig. 1 show the characteristic convergence of the three algorithms for solving the dynamic economic dispatch
2250
of 5 units test system without considering ramp rate 2200
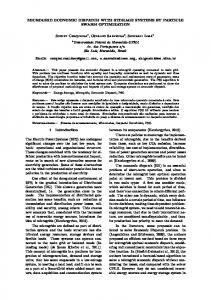
limits for active power demand equal 710 MW. Fig 2 shows the optimal solution calculated by the three
2150
algorithms for 10 unit test system considering ramp 2100
10
20
30
40
50
60
70
80
90
100
Generation
Fig.2 Convergence characteristic of GA, PSO and PSOTVAC for 10 units test system considering ramp rate limits
rate limits when the active power demand set 2131MW. The best cost found by the proposed new variant (PSO-TVAC) is better in
Table 1. Optimal solution of 5 unit considering valve point effect without Ramp rate limits based PSO-TVAC
two cases (5 and 10 units) than the optimum value found using PSO and GA in term of solution quality and execution time. Time 1 2 3 4 5 6 7 8 9 10 11 12 13 14 15 16 17 18 19 20 21 22 23 24
Pg1 10 30.571 10 40.665 10 35.991 60.359 10 39.451 53.452 10 75 53.45 12.991 10 10 10 35.991 10 53.452 29.45 44.211 37.665 58.572
Pg2 20 20.002 87.66 20 81.118 20 98.54 91.993 98.54 98.539 95.794 112.99 98.54 125 91.992 20 85.752 20 91.993 98.54 98.541 98.54 20 20
Pg3 30 30 112.67 30 112.68 112.67 112.67 112.67 112.67 112.67 174.87 112.67 112.67 112.67 112.67 110.66 112.67 112.67 112.67 112.67 112.67 112.67 30 30
Pg4 120.48 124.91 124.91 209.82 124.79 209.82 124.91 209.82 209.82 209.82 209.82 209.82 209.82 209.82 209.82 209.82 209.81 209.82 209.82 209.82 209.81 209.82 209.82 124.91
Pg5 229.52 229.52 139.76 229.52 229.41 229.52 229.52 229.52 229.52 229.52 229.52 229.52 229.52 229.52 229.52 229.52 139.76 229.52 229.52 229.52 229.52 139.76 229.52 229.52
Cost($) 1244.1 1348.5 1403.8 1592.7 1632 1760.9 1796.3 1800.7 1945 1985.7 2053.2 2105.8 1985.7 1986.4 1800.7 1618.1 1607.1 1760.9 1800.7 1985.7 1897.9 1751 1580.5 1437.6
4
Journal of Electrical Engineering www.jee.ro
Table 2. Comparison of optimization results: 5 units with valve point effect. Total cost
GA
PSO
PSOTVAC
Min
42905
43640
41881
Mean
43027
43962
42054
Max
43256
44478
42190
Time (s)
2.494
2.191
2.120
Table 3. Optimal solution of 5 unit considering valve point effect with Ramp rate limits based PSO-TVAC Time
Pg1
Pg2
Pg3
Pg4
Pg5
Cost($)
1
10
20
30
120.48
229.52
1244.1
2
30.573
20
30
124.91
229.52
1348.5
3
20.573
20
30
174.91
229.52
1579.4
4
10.665
50
30
209.82
229.52
1617.9
5
10
78.665
30
209.82
229.52
1645.8
6
40
98.665
30
209.82
229.52
1760.4
7
18.125
98.54
70
209.82
229.52
1892.3
8
10
94.665
110
209.82
229.52
1802.3
9
39.451
98.54
112.67
209.82
229.52
1945
10
53.451
98.54
112.67
209.82
229.52
1985.7
11
69.452
98.54
112.67
209.82
229.52
1996.7
12
75
112.99
112.67
209.82
229.52
2105.8
13
53.451
98.54
112.67
209.82
229.52
1985.7
14
39.451
98.54
112.67
209.82
229.52
1945
15
10
91.991
112.67
209.82
229.52
1800.7
16
10
61.991
72.673
205.82
229.52
1919.5
17
10
75.991
32.673
209.82
229.52
1671.7
18
10
98.54
60.125
209.82
229.52
1804.4
19
16
98.54
100.12
209.82
229.52
1862
20
46
105.99
112.67
209.82
229.52
2027
21
29.45
98.541
112.67
209.82
229.52
1897.9
22
10
82.991
72.674
209.82
229.52
1892
23
10
52.991
32.674
201.82
229.52
1680.4
24
10
22.991
30
170.49
229.52
1530.6
Table 4. Comparison of optimization results: 5 units with valve point effect and ramp rate limits Total cost
GA
PSO
PSOTVAC
Min
43708
44525
42941
Mean
44207
44960
44260
Max
44693
45296
44821
Time (s)
24.555
21.467
19.725
5
Journal of Electrical Engineering www.jee.ro
Table 5. Optimal solution of 10 units considering valve point effect without ramp rate limits based PSO-TVAC time 1 2 3 4 5 6 7 8 9 10 11 12 13 14 15 16 17 18 19 20 21 22 23 24
Pg1 150 150 150 216.99 150 150.39 266.12 315.95 420.73 464.94 469.7 465.26 466 454.34 436.98 150 150 158.91 430.94 469.07 432.35 150 150 165.83
Pg2 135 135 135 135 285.4 433.41 456.07 460 460 460 460 460 460 460 460 352.32 411.34 460 460 460 460 423.95 298.09 135
Pg3 206 280.15 337.91 340 340 340 340 340 340 340 340 340 340 340 333.83 340 340 338.11 340 340 340 339.72 340 340
Pg4 60 60 60 60 60 60 60 60 60 152.68 151.23 300 137.6 60 60 60 60 60 60 147.09 60 60 60 60
Pg5 73 73 163.48 243 232.6 232.59 167.81 188.05 231.28 242.52 240.07 243 243 197.66 73.185 240.14 109 198.98 73.063 243 219.65 242.33 73 73
Pg6 160 160 159.61 160 160 159.6 160 160 160 159.86 160 160 160 160 160 159.54 157.66 160 160 159.92 160 160 158.91 158.54
Pg7 130 129.85 130 129.01 130 130 130 130 130 130 130 129.74 130 130 130 130 130 130 130 129.96 130 130 130 129.64
Pg8 47 47 47 47 47 47 47 47 47 47 120 47 60.399 47 47 47 47 47 47 47.962 47 47 47 47
Pg9 20 20 20 20 20 20 20 20 20 20 20 20 20 20 20 20 20 20 20 20 20 20 20 20
Pg10 55 55 55 55 55 55 55 55 55 55 55 55 55 55 55 55 55 55 55 55 55 55 55 55
Cost($) 28120 29602 32794 36100 37621 40767 42406 44025 47257 50695 52512 54358 50742 47271 44026 39181 37537 40788 44036 50712 47270 40780 34339 31165
Table 6. Comparison of optimization results: 10 units with valve point effect Total cost Min Mean Max Time (s)
GA 1006400 1006600 1006800 2.6622
PSO 1005500 1006000 1006300 1.9937
PSOTVAC 1004100 1004400 1004900 2.0423
Table 7. Optimal solution of 10 units considering valve point effect with ramp rate limits based PSO-TVAC time 1 2 3 4 5 6 7 8 9 10 11 12 13 14 15 16 17 18 19 20 21 22 23 24
Pg1 150 150 226.63 303.25 379.87 456.5 456.49 456.5 456.49 456.5 456.5 470 456.5 456.5 379.87 303.25 226.62 303.25 379.88 459.88 456.5 379.87 303.25 226.62
Pg2 135 135 215 295 375 396.8 396.8 396.8 460 460 460 460 396.8 396.8 396.8 316.8 309.53 389.53 396.81 460 396.81 316.81 236.82 222.27
Pg3 205.24 229.37 190.77 185.2 179.78 179.01 200.64 186.83 251.58 331.58 340 340 329.28 303.18 300.9 297.4 317.15 288.52 302.11 340 337.82 257.82 196.29 182.21
Pg4 60 60 60 110 60 60 110 120.52 120.29 121.01 171.01 221.01 180.83 130.83 80.83 60 60 60 60 110 60 60 60 60
Pg5 73 122.87 122.87 73 73 122.93 122.87 172.87 222.87 222.6 233.9 243 222.6 222.6 172.73 172.73 122.94 172.94 222.94 243 222.56 172.73 122.88 73
Pg6 122.45 122.45 122.45 149.65 122.45 122.45 125 122.46 122.45 160 160 160 160 122.79 123.57 142.52 122.45 122.45 123.95 160 160 150.46 122.45 160
Pg7 130 130 129.96 129.59 129.59 130 129.88 130 130 130 129.59 130 130 130 130 130 130 130 130 130 130 130 130 129.59
Pg8 85.312 85.312 115.31 85.312 85.312 85.313 85.313 85.311 85.312 115.31 120 120 90 85.314 85.312 55.312 85.312 85.312 85.316 85.312 85.312 85.312 85.312 55.312
Pg9 20 20 20 20 20 20 20 49.706 20 20 20 20.992 50.992 20.992 50.992 20.992 50.992 20.992 20 28.812 20.002 20 20 20
Pg10 55 55 55 55 55 55 55 55 55 55 55 55 55 55 55 55 55 55 55 55 55 55 55 55
Cost($) 28410 30134 33535 36977 38307 41132 43076 44673 48370 51939 53890 56084 51666 47814 44713 39888 38113 41238 44266 52352 47863 41664 35043 31766
6
Journal of Electrical Engineering www.jee.ro
Table 8. Comparison of optimization results: 10 units with valve point effect and ramp rate limits Total cost Min Mean Max Time (s)
GA 1029100 1030100 1031600 4.0966
PSO 1027900 1030700 1032800 2.691
6. Conclusion
Data of generators coefficients for 10 unit test system
In this paper, the non-convex dynamic ED problem with valve-point effects and ramp rate limits was solved using new variant based PSO called (PSO-TVAC). To validate the proposed new variant, 5 units and 10 units with practical generator units were considered. Compared with the standard previous approaches such as: GA and PSO, the results showed the effectiveness of the PSOTVAC algorithm in terms of high-quality solution
ng
a
b
c
e
1 2 3 4 5 6 7 8 9 10
0.00043 0.00063 0.00039 0.0007 0.00079 0.00056 0.00211 0.0048 0.10908 0.00951
21.6 21.05 20.81 23.9 21.62 17.87 16.51 23.23 19.58 22.54
958.2 1313.6 604.97 471.6 480.29 601.75 502.7 639.4 455.6 692.4
450 600 320 260 280 310 300 340 270 380
ng
f
p min
p max
UR
DR
1 2 3 4 5 6 7 8 9 10
0.041 0.036 0.028 0.052 0.063 0.048 0.086 0.082 0.098 0.094
150 135 73 60 73 57 20 47 20 55
470 460 340 300 243 160 130 120 80 55
80 80 80 50 50 50 30 30 30 30
80 80 80 50 50 50 30 30 30 30
convergence and good computation efficiency.
. Appendix Data of generators coefficients for 5 units test system
ng
a
b
c
e
1 2 3 4 5
0.0080 0.0030 0.0012 0.0010 0.0015
2.0000 1.8000 2.1000 2.0000 1.8000
25.0000 60.0000 100.0000 120.0000 40.0000
100.0000 140.0000 160.0000 180.0000 200.0000
ng 1 2 3 4 5
f 0.0420 0.0400 0.0380 0.0370 0.0350
p min 10 20 30 40 50
p max 75 125 175 250 300
UR
DR
30 30 40 50 50
30 30 40 50 50
Hourly demand for 10 unit test system hour 1 2 3 4 5 6 7 8 9 10 11 12
Hourly demand for 5 unit test system hour 1 2 3 4 5 6 7 8 9 10 11 12
PSOTVAC 1022900 1025400 1027600 2.632
load 410 435 475 530 558 608 626 654 690 704 720 740
Hour 13 14 15 16 17 18 19 20 21 22 23 24
load 704 690 654 580 558 608 654 704 680 605 527 463
load 1036 1110 1258 1406 1480 1628 1702 1776 1924 2072 2146 2220
hour 13 14 15 16 17 18 19 20 21 22 23 24
load 2072 1924 1776 1554 1480 1628 1776 2072 1924 1628 1332 1184
References [1]
M.A Abido, ”Multiobjective Evolutionary Algorithms for Electric Power Dispatch Problem,” IEEE transactions on Evolutionary computation ,vol 10 ,NO.3,june 2006.
7
Journal of Electrical Engineering www.jee.ro
[2]
S. Hemmalini, Sishaj P.Simon, “Dynamic dispatch using
algorithm,”. Electric power system research 77(2007)
artificial immune system for units with valve-point effect,”
1654-1664.
Electrical Power and Energy Systems 33(2011) 868-874. [3]
Travers D, Kaye RJ,” Dynamic dispatch by constructive
swarm optimization for various types of economic
dynamic
dispatch problems ‘’ Electrical Power and Energy Systems
programming”.
IEEE
Trans
Power
Syst
1998;13:72–8. [4]
[5]
28 (2006) 36–42.
Somuah CB, Khunaizi N., “Application of linear
[13] K. T. Chaturvedi , M. Pandit , L. Srivastava, “Particle
programming re-dispatch technique to dynamic generation
swarm optimization with time varying acceleration
allocation,“ IEEE Trans Power Syst 1990;5:20–6.
coefficients for non-convex economic power dispatch”
Hemamalini S, Simon SP. “Dynamic economic dispatch
Electrical Power and Energy Systems 31 (2009) 249–257
using Maclaurin series based lagrangian method”. Energy
[6]
[7]
[9]
[14] D.W. Gong, ,Y. hang,C.L Qi, ”Environmental/economic
Convers Manage 2010; 51(11):2212–9.
power dispatch using a hybrid multiobjective optimization
B. Mohammadi–ivatloo, A. Rabiee, M. Mehdi Ehsan
algorithm”Electrical and power energy systems.32 (2010)
“Time varying acceleration coefficients IPSO for solving
607-614.
dynamic economic dispatch with noncom-smooth cost
[15] D.Gong,Y.Zhang,C.Liang. ui, ”Environmental/economic
function,” Energy conversion and management 56(2012)
power dispatch using a hybrid multiobjective optimization
175-183.
algorithm” Electrical power and Energy systems 32(2010)
G. Ching,.Liao, ”A novel evolutionary algorithm for
607-614.
dynamic economic dispatch with energy saving and
[16] A. Abido, ”multi-objective particle swarm optimization
emission reduction in power system integrated wind
for environmental economic power dispatch,” Electric
power,“ Energy 36(2011) 1018-1029. [8]
[12] D.N. Jeyakumar T. Jayabarathi , T. aghunathan“Particle
power systems reaserch, Vol. 79 (2009) 1105-1113.
C. X. Guo, J. P. Zhan; Q. H. Wu, ” Dynamic economic
[17] K. T. Chaturvedi , M. Pandit , L. Srivastava “Particle
emission dispatch based on group search optimizer with
swarm optimization with time varying acceleration
multiple producers,” Electric Power Systems Research
coefficients for non-convex economic power dispatch”
(2011)
Electrical Power and Energy Systems, Vol. 31 (2009)
T. Nadeem Malik ,A ul Asar ,M.F.Wyne,S.Akhtar, ”A
249–257
new hybrid approach for the solution of non-convex
[18] B. Mahdad, and K. Srairi, “Solving Practical Economic
economic dispatch problem with valve-point effects,”
Dispatch Using Hybrid GA-DE-PS Method,” Journal of
Electric Power Systems Research 80 (2010) 1128-1136.
assurance Engineering, vol.4, N°1, 2013.
[10] A.Y.Abdelaziz, Z.Kamh,S.F.Mekhamer,MAL.Badr, ”A hybrid HNN-QP approach for dynamic economic dispatch problem,” Electric Power Systems Research 78 (2008) 1784-1788. [11] L.Wang C.Singh “Enverimental Economic Dispatch using fuzzied
multiobjective
particle
swarm
optimization
8