such algorithms, each based on a di erent set of assump- tions. Two algorithms from this class were considered, and will be referred to as AC1 4] and AC2 5].
SOME EXPERIMENTS WITH ARRAY DATA COLLECTED IN ACTUAL URBAN AND SUBURBAN ENVIRONMENTS
A. Lee Swindlehurst1 Malcolm J. Goris2 Bjorn Ottersten3 1 Dept. of Signals, Sensors, & Systems, Royal Institute of Technology, Stockholm, Sweden (On leave from Dept. of Electrical Engineering, Brigham Young University, Provo, UT, USA). 2 Netherlands Foundation for Research in Astronomy, Dwingeloo, the Netherlands. 3 ArrayComm, Inc., San Jose, CA, USA (On leave from Dept. of Signals, Sensors, & Systems, Royal Institute of Technology, Stockholm, Sweden.) ABSTRACT of the experimental setups is given in the next section. The were stored and processed o�-line using a number of We compare the performance of several algorithms for sig- data di�erent techniques, which are brie y outlined in Section 3. nal separation based on actual mobile cellular radio data. To conclude the paper, some selected results from this proThe data were collected by basestations in two di�erent en- cessing are presented in Section 4. vironments: using an eight element linear array on a hillcontinuing, we note that it would be di�cult, not side overlooking a suburban area, and using a four element to Before mention unwise, to draw too many general conclusions square array at the top of a ten story building in a dense about the algorithms studied from the results presented beurban area. Calibration data were available for one of the low. Though scenarios considered are representative of arrays used for the suburban data, allowing for performance typical mobilethe cellular networks, the relative performance of comparisons between DOA-based and blind signal separa- the algorithms may be quite di�erent under other circumtors. Experiments were conducted with three di�erent types stances. Indeed, the results presented may tell more about of signal waveforms: sinewaves, simple FM waveforms, and the validity of the modeling assumptions behind the algo�=4-DQPSK signals, each of which necessitated the use of a di�erent performance metric. We focus here on the re- rithms than the performance of the algorithms themselves. sults obtained for cases where the data were approximately 2. EXPERIMENT DESCRIPTIONS low rank, with little delay spread (although not all data sets Results will be reported for data collected in three separate from the urban environment were of this type). experiments, two conducted at the suburban site, and one in the urban environment. The test parameters for each case 1. INTRODUCTION are described below. Multiple-antenna arrays have been considered as a means of accommodating increasing numbers of users in mobile cellu- 2.1. Suburban Collect 1 (SUB1) lar radio systems. An array can be used to service multiple, For this set of experiments, a 12-element dual-polarized linspatially-separated users in a common cell and on a common ear array constructed by Allgon System AB of Sweden was frequency by adaptively amplifying the signal from each user mounted at the top of a 15 meter tower on a hillside overwhile rejecting interference from the other users. An array looking a relatively at residential area. The combined can reject interference from adjacent cells and increase the height of the antenna (hill + tower) was several hundred signal-to-noise ratio of the received and transmitted signals. feet. The array elements were uniformly spaced 17.7 cm These properties can lead to more users per cell, re-use of apart, and each consisted of cross-polarized antennas orifrequencies in adjacent cells, smaller re-use distances, and ented at �45 degrees. Only a single polarization output for lower mobile-handset power requirements. In order to real- each of the inner eight elements of the array (elements 3ize these bene ts, algorithms that estimate the spatial sig- 10) were used in the experiments reported here. Gain and nature of each of the received signals must be used. phase patterns for both the azimuth and elevation dimenMany di�erent techniques have been developed for sepa- sions were measured at Allgon's test facility in Sweden prior rating co-channel communications signals. These techniques to the array's shipment to the US for use in the experiments. can be grouped into two categories: those that use spatial In addition to this antenna calibration data, a receiver calicalibration information, and those that do not. Algorithms bration was performed by measuring the on-site response of in the latter category are often referred to as \blind" beam- the array/receiver combination to a strong far- eld broadformers, and usually rely on some type of temporal infor- side source with (nominally) no other sources present. Data mation about the transmitted signals. The term \blind" is from the array's RF front end were sampled at 71.4 kHz, also used to refer to techniques that do not use sequences and stored in blocks of 512 samples. for training either spatial or temporal lters. In either case, The results presented below for this collect were obtained little work has been published on the performance of these using two mobile transmitters in vehicles moving through algorithms with real mobile cellular data, in real communi- residential tra�c at speeds ranging from 0-50 km/h. Both cation environments. This is the principal goal of the paper. sources transmitted data centered at fc = 825:27 MHz, and Data were collected by ArrayComm, Inc. and Allgon Sys- both were located at a range of roughly 2-3 km from the tem AB, with help from the authors, in two realistic settings. array. At this frequency, the array elements were just under In the rst set of experiments, an eight element linear array one half wavelength apart. The rst source transmitted a was mounted on a tower on a hillside overlooking a suburban simple sinewave at a frequency of fc ? 850�Hz. Its azimuth area, and was used to collect a variety of di�erent signals at position varied between approximately ?8 and ?12� rela825.27 MHz from vehicles in normal tra�c (0-50 km/h). In tive to broadside throughout the collect, and its mean (sinthe second, a four element square array was mounted on gle sensor) SNR was estimated to be 8.0dB with a standard the top of a building in an urban environment, and received deviation of 8.2dB due to fading. The second source broadDQPSK data centered at approximately 1.9 GHz from a cast a standard IS-54 �=4-DQPSK signal (35% square-root hand-held mobile phone below. A more detailed description raised cosine pulse) with a pseudo-random symbol stream
and a baud rate of 24.3 kHz; its azimuth angle varied between roughly ?25� and ?38� , and its mean SNR estimate was 20.3dB with a standard deviation of 8.3dB. While the array overlooked the area where the mobiles were located, there was seldom a line-of-sight (LOS) path between them due to trees and small buildings. Any multipath present in the data appears to be con ned to a small angular sector surrounding each mobile, and is coherent (essentially zero delay spread). Because the sampling rate of the array was not an integer multiple of the baud rate of the DQPSK signal, it was di�cult to accurately measure the quality of the digital source after separation. For this reason, the performance metric used with this collect was based on how closely the signal copied from the sinewave transmitter approximated a sinewave. In particular, letting 6 s^(t) denote the phase of the estimated sinewave, the standard deviation of the signal's (unwrapped) phase di�erence 6 s^(t + 1) ? 6 s^(t) was computed in each trial.
2.2. Suburban Collect 2 (SUB2)
The location and parameters of this collect were essentially identical to the rst, with the following exceptions: a 12element array of dipoles spaced 18 cm apart was mounted on the tower (only the inner eight were used, as before), and both mobiles transmitted analog FM modulated 1 kHz sinewaves. In addition, no element gain nor phase calibration was available for this array, although an on-site receiver calibration was performed, as above. The average single sensor SNR for both sources was estimated to be in excess of 27dB, with a standard deviation of 6dB, and the� azimuth angles� of the� two sources varied in the intervals [?5 ; 5� ] and [?35 ; ?25 ]. The center frequencies of the signals were at fc � 7:5 kHz, and since their bandwidths were only a few kilohertz, they were essentially spectrally disjoint. Since the SNR is quite high, one can easily measure the amount of interference rejection by simply taking the highest peaks in the frequency bands above and below the carrier, and comparing their levels before (single sensor) and after separation. This was the performance metric used in this case.
2.3. Urban Collect (URB)
The urban data sets were collected by a four-element square array mounted on the top edge of a ten story building in a metropolitan area. The mobiles were hand-held phones transmitting PHS (for Personal Handyphone System) data with a carrier frequency near 1.9 Ghz. At this frequency, the elements of the array were separated by over ve wavelengths. The PHS standard is similar to IS-54, except the symbol rate is 192 kbaud and the �=4-DQPSK modulation is shaped by a 50% square-root raised cosine pulse. The data were collected by sampling the array eight times per symbol in bursts of 962 samples each, although the results presented in this paper were obtained using only symbolrate data taken from the samples nearest the symbol center. Symbol timing was easily estimated since each burst contained data from only one mobile; multiple user co-channel data sets were created by adding together di�erent bursts. Furthermore, only a subset of the data in each burst was used for processing, to avoid the power ramp-up and rampdown periods at the beginning and end of each burst. The range to the mobiles was either 100m, 300m, or 500m, depending on the experiment. While the longer range data sets with no LOS component had signi cant delay spread, the results obtained for this paper were based on two lowrank LOS scenarios. In the rst, two stationary handsets at 300m and 500m were present, and the power of the more distant source was on average -13.2 � 3.2 dB below the other. The noise was measured at -32.6 � 0.6 dB below the power of the nearer transmitter. The second scenario involved three
handsets, two of which were mobile at a range of 100m, while the third was stationary at 300m. The two weaker signals had mean power levels of ?3:4 � 3:0 dB and -9.4 � 1.5 dB with respect to the stronger source, and the noise power was -34.1 � 0.5 dB down. For all cases, the measured correlation between the sources was below 20%, with a mean and standard deviation of about 10% � 5%. The performance metric used for these experiments was the standard deviation of the DQPSK constellation clouds averaged over 100 symbols in each burst. From this, a rough estimate of the corresponding symbol error rate could be obtained.
3. ALGORITHMS STUDIED
As mentioned above, we focus on low-rank data sets for which an appropriate model is the following:
x(t) =
Xa d
k=1
k sk (t) + n(t) :
(1)
Here, x(t) is the vector output of the array at time t, sk (t) is the kth signal waveform, ak is the spatial signature or array response vector associated with signal k, and n(t) represents additive noise. Given N samples from the array, we may write (1) in matrix form: X � [x(1) � � � x(N )] = [a1 � � � ad ]S + N = AS + N ; (2) where S = [s(1) � � � s(N )], s(t) = [s1 (t) � � � sd (t)]T , and the noise term N is de ned similarly to X and S. By the term \low-rank" we mean that each source makes only a rank one contribution to X, and that the total number of sources d is less than the number of antennas. We also de ne the covariance of the data as Rxx = N!1 lim N1 XX� = ARss A� + Rnn ; where Rss and Rnn represent the covariance of the signals and noise, respectively. The algorithms studied below attempt to use certain assumptions about the array and received signals to factor the low-rank portion of the data into terms involving A and S (or A and Rss when Rxx is used instead of X) that are consistent with these assumptions. The algorithms may be grouped into the categories listed below based on their de ning features. Direction of arrival (DOA) estimation { These techniques assume the availability of calibration data for the array and use it to estimate the DOAs � = [�1 � � � �d ] of all signals. Once the estimate �^ is found, the columns of A^ are set equal to the corresponding vectors from the so-called array manifold: A^ = A(�^). (In the case of multipath, it may be necessary to t a linear combination of several calibration vectors to each source). The calibration data may be obtained empirically, or by assuming identical antennas in known locations (sometimes referred to as an \analytical" calibration). The DOA-based methods studied in this paper were MUSIC [1], ESPRIT [2], Weighted Subspace Fitting (WSF) [3], and the classical delay-and-sum beamformer (DSB). On-line auto-calibration (AC) { There are a number of such algorithms, each based on a di�erent set of assumptions. Two algorithms from this class were considered, and will be referred to as AC1 [4] and AC2 [5]. Both assume that the signals are uncorrelated (Rss is diagonal), and that their spatial signatures have angle independent gain responses. These methods operate by trying to iteratively decompose the signal subspace part of R into a product ?CR^ ss C� ?T , where ? is real and diagonal (the angle independent antenna gains), the elements of C have unit amplitude and arbitrary phase (the antenna element phases), and R^ ss is real and diagonal (the signal powers).
0.65
LS−CMA
40
CMF
Mean Distortion for Single Sensor Data: 0.73
0.6
Mean Interference Rejection (dB)
35
Mean SAT Tone Distortion
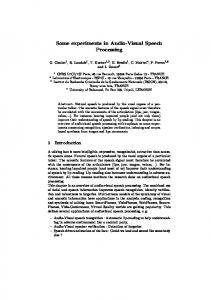
0.55 Collect SUB1 0.5 x o
0.45
WSF CMF LS−CMA AC2 JADE
0.4
0.35
AC2 30
AC1
WSF ESPRIT
25 NCMA 20
DSB
15 10 Collect SUB2
0.3
5
0.25
0 0
10
20
30 40 50 Number of Data Samples
60
70
Figure 1. Results from Collect SUB1.
4. SOME RESULTS
Figures 1-6 display some results obtained by processing data from each of the three collects. Most of the gures show performance as a function of N , the number of data samples used by each algorithm to determine W. Once computed, the weights were applied to the entire burst, which typically contains many more than N samples. Note that Figures 3-4 show the performance of each method sorted from worst to best to give an indication of algorithm robustness. Some comments about the results for each algorithm class are given below.
50
100
150
200 250 300 350 Number of Data Samples
400
450
500
Figure 2. Results from Collect SUB2. 50 45
Collect SUB2 N=8
40 Mean Interference Rejection (dB)
Constant modulus (CM) signals { CM approaches attempt to factor X into the product of an arbitrary matrix A and a matrix S whose entries have constant amplitude. They attempt to exploit the CM property shared (or nearly shared) by typical communications signals employing, for example, FM or PSK modulation. The algorithms tested in this category were the normalized LMS adaptive CM algorithm (NCMA) [6], the iterative LS-CMA method [7], and the CM factorization (CMF) approach [8]. Finite alphabet (FA) signals { Algorithms from this class assume that the sources transmit digital communications signals with known modulation. Of the available FA techniques, only the decision-directed (DD) beamformer presented in [9] was implemented. Higher order statistics (HOS) { A number of algorithms for blind source separation based on HOS have also been developed, but only the JADE algorithm of [10] was considered here. JADE assumes only that the signals are uncorrelated and non-Gaussian, and uses the structure of the resulting second- and fourth-order cumulants to factor out A. Each of the algorithms above produce (either directly or indirectly) an estimate A^ of the spatial signature matrix A, from which a set of beamformer or \signal copy" weights W = [w1 � � � wd ] may be determined to estimate each of the signals: S^ = W� X. Two types of beamformer weights were used to process the data, the \zero-forcing" solution W = A^ (A^ �A^ )?1 , and the minimum variance distortionless response (MVDR) beamformer wk = R^ ?1 a^k [11]. To minimize signal cancellation e�ects, the MVDR beamformer was implemented using a subspace projection constraint (the use of a derivative constraint did not improve performance). This amounts to replacing the inverse of the sample covariance matrix by its pseudo-inverse, obtained by taking the eigendecomposition of R, inverting only the d largest eigenvalues, and setting the remainder to zero.
JADE
35
LS−CMA, CMF
30 WSF 25
ESPRIT AC2
20 AC1 15
DSB
NCMA
10 5 JADE 0 0
100
200
300 400 Number of Trials (Sorted)
500
600
Figure 3. Results from Collect SUB2 sorted from worst to best, N = 8. DOA methods { Due to the fact that the sources had high SNR, low correlation, and were su�ciently well separated, there was little di�erence in performance between the various DOA-based methods (except the DSB). For this reason, only the results of one or two algorithms are shown in the gures. An advantage of the DOA methods is that in high SNR situations, very little data and relatively little computation are required for them to \converge" to a reasonable solution. Figure 2 shows that although they worked well with only rudimentary calibration data, the CM algorithms o�er nearly 10 dB more interference rejection. When accurate calibration data were available, the performance di�erence was much smaller, as evidenced by the results using the Allgon array. Note that no attempt was made to use the DOA-based algorithms with the urban data sets. AC methods { The performance of the AC1 and AC2 algorithms was very similar, which is not surprising since both attempt to factor the covariance matrix in the same way. In some of the gures then, only the performance of AC2 is shown since it was slightly better. It was also noted that the AC2 iterations tended to converge somewhat more quickly than AC1. The angle-independent gain assumption used by the AC methods is least likely to hold in a multipath environment with large angular spread, which is probably the explanation behind the algorithms' poor performance with
50 −1
45
10
40
10
JADE
LS−CMA
35 30
WSF
AC2
CMF
Estimated Symbol Error Rate
Mean Interference Rejection (dB)
AC2 −2
AC1
ESPRIT
25 NCMA
20
DSB
15
Collect SUB2 N=500
10
−3
JADE
10
Collect URB 3 sources Mobile at 100m 0 dB moving
−4
10
−5
10
−6
10
−7
LS−CMA
10
−8
10
5 0 0
100
200
300 400 Number of Trials (Sorted)
500
10
600
Figure 4. Results from Collect SUB2 sorted from worst to best, N = 500. −1
10
20
30
40 50 60 Number of Symbols
70
80
90
100
Figure 6. Results from Collect URB, 3 sources present, results for stronger 100m source shown. this data set were the least correlated of those processed.
Acknowledgment
10
Estimated Symbol Error Rate
DD
−9
The authors wish to thank Richard Roy and Marc Goldburg of ArrayComm, Inc. and Claes Beckman of Allgon System AB for generously providing the data used in the experiments.
AC2
−2
10
REFERENCES
−3
10
JADE −4
10
LS−CMA Collect URB 2 sources Mobile at 500m −13.2 dB stationary
−5
10
DD
−6
10
10
20
30
40 50 60 Number of Symbols
70
80
90
100
Figure 5. Results from Collect URB, 2 sources present, results for source at 500m shown. the urban data. CM methods { The LS-CMA algorithm was initialized by WSF in Collects SUB1 and SUB2, and by AC1 in Collect URB. Both LS-CMA and CMF performed very well, yielding accurate source separation with very little data. The only exception was perhaps the SUB1 data set, where the more severe IS-54 pulse shaping lter reduces the CM property of the DQPSK signal. The results shown for the adaptive CMA algorithm in Figures 2-4 were obtained by initializing it with the nominal array response vector corresponding to a point roughly between the two sources. DD method { As observed with other DD techniques, a certain data length threshold must be passed before an improvement in performance is achieved. In the urban data sets processed, this threshold was on the order of 40-50 symbols, beyond which the SER was reduced by 1-2 orders of magnitude over the CM methods. JADE { In most cases, JADE was the slowest algorithm to converge, due to its reliance on higher order statistics of the data. However, it is interesting to note the algorithm's excellent performance and fast convergence with the SUB1 data. A possible explanation is the fact that the signals in
[1] R. Schmidt, A Signal Subspace Approach to Multiple Emitter Location and Spectral Estimation, PhD thesis, Stanford University, 1981. [2] R. Roy and T. Kailath, \ESPRIT { Estimation of Signal Parameters via Rotational Invariance Techniques", IEEE Trans. on ASSP, 37(7):984{995, July 1989. [3] M. Viberg and B. Ottersten, \Sensor Array Processing Based on Subspace Fitting", IEEE Trans. on Sig. Proc., 39(5):1110{1121, May 1991. [4] A. Weiss and B. Friedlander, \Almost Blind Steering Vector Estimation Using Second Order Moments", IEEE Trans. on Sig. Proc., 44(4):1024{1027, April 1996. [5] C.-Y. Tseng, D. Feldman, and L. Gri�ths, \Estimation of Signal Steering Vectors in Uncalibrated Arrays", In Proc. 27th Asilomar Conference on Signals, Systems, and Computers, pages 1062{1066, Asilomar, CA., 1993. [6] K. Hilal and P. Duhamel, \A Convergence Study of the Constant Modulus Algorithm Leading to a Normalized-CMA and a Block-Normalized CMA", In Proc. EUSPICO, 1992. [7] B. Agee, \The Least-Squares CMA: A New Technique for Rapid Correction of Constant Modulus Signals", In Proc. IEEE ICASSP, pages 953{956, Tokyo, Japan, 1986. [8] A. van der Veen and A. Paulraj, \An Analytical Constant Modulus Algorithm", IEEE Trans. Sig. Proc., 44(5):1136{ 1157, May 1996. [9] A. Swindlehurst, S. Daas, and J. Yang, \Analysis of a Decision Directed Beamformer", IEEE Trans. on Sig. Proc., 43(12):2920{2927, December 1995. [10] J. F. Cardoso and A. Souloumiac, \Blind Beamforming for Non-Gaussian Signals", IEE Proceedings-F, 140(6):362{370, Dec. 1993. [11] B. Van Veen and K. Buckley, \Beamforming: A Versatile Approach to Spatial Filtering", IEEE ASSP Magazine, 5(2):4{ 24, April 1988.