doi:10.1016/j.envpol.2005.07.012. Environmental Pollution 140 ...... Schaub, M., Jakob, P., Bernhard, L., Innes, J.L., Skelly, J.M.,. Kra¨ uchi, N., 2002. Ozone ...
Environmental Pollution 140 (2006) 257e268 www.elsevier.com/locate/envpol
Sources of errors in assessing ozone visible symptoms on native vegetation Filippo Bussotti a,*, Marcus Schaub b, Alberto Cozzi c, Giacomo Gerosa d, Kristopher Novak b, Christian Hug b a
Department of Plant Biology, University of Florence, Piazzale delle Cascine 28, 50144 Florence, Italy Swiss Federal Institute for Forest, Snow and Landscape Research WSL, 8903 Birmensdorf, Switzerland c LinnÆambiente srl, Via G. Sirtori 37, 50137 Florence, Italy d Dipartimento di Matematica e Fisica, Universita` Cattolica del Sacro Cuore, Via Musei 41, 25121 Brescia, Italy b
Received 22 September 2004; accepted 2 July 2005
The quality of foliar ozone-symptom assessment depends on the experience of the surveyor, the symptom specificity, and the symptom variability within the same species. Abstract This paper aims to identify the problems regarding the evaluation of ozone (and ozone-like) symptoms, by examining the results of the 4th UN/ECE ICP-Forests Intercalibration Course for the assessment of ozone-induced visible symptoms. Trees, shrubs and herbaceous species were evaluated in a tree nursery, at Lattecaldo (Switzerland) and under open field conditions at Moggio (Italy). The main findings were: (i) the most expert surveyors tended to be grouped in the same cluster and, during the field exercises, they tended to assess in a more conservative manner compared to the less trained participants; (ii) the agreement was greater in assessing the absence rather than the presence of symptoms; (iii) typical interveinal stippling on the upper leaf surface was more accurately evaluated than discoloration; (iv) uncertainties resulted mainly for species which showed greater variability in their symptom manifestation, and for certain herbaceous species. Ó 2005 Elsevier Ltd. All rights reserved. Keywords: Field survey; Ozone-induced visible symptoms; Training course; Quality assurance; Validation of symptoms
1. Introduction The assessment of ozone visible symptoms on native vegetation as a routine activity in monitoring programmes is currently performed in both the United States (Smith et al., 2001, 2003; Coulston et al., 2003) and Europe (FIMCI, 2003; Working Group on Air
* Corresponding author. Tel.: C39 055 328 8369; fax: C39 055 360137. E-mail address: filippo.bussotti@unifi.it (F. Bussotti). 0269-7491/$ - see front matter Ó 2005 Elsevier Ltd. All rights reserved. doi:10.1016/j.envpol.2005.07.012
Quality, 2004). In comparison to the U.S. programme, the European assessment is conducted within the ICPForests Intensive Monitoring Level II plots, and includes both main tree species (MTS) rooting within the plot itself and native vegetation (lateral branches, small trees and shrubs, herbaceous species) at the light-exposed forest edge (Light-Exposed Sampling Sites, LESS). The LESS are randomly distributed along the forest edge closest to the Level II plot. For the European programme, there are no pre-determined bio-indicator species as in the U.S. The European field teams are required to assess all plant species rooting
258
F. Bussotti et al. / Environmental Pollution 140 (2006) 257e268
within the designated plots. However, the influence of the possibly large variability within the floristic composition across the plots and of the species-specific plant response to ozone has not been adequately tested as yet (cf. Pan European List of Sensitive Species, in Working Group on Air Quality, 2004). Under the given circumstances, the field evaluation is done according to likelihood criteria, i.e. using photo-guides and flowcharts (Flagler, 1998; Innes et al., 2001; Sanz et al., 2001; Schaub et al., 2002). There is also significant variability in the symptom expression not only across different species but also within the same species due to genotypic differences and varying plant responses to environmental conditions. The possibility of confounding, biotic and abiotic factors could also mask the symptoms or reproduce visible manifestations similar to the ozonesymptoms themselves. Therefore, it is important to be aware of the difficulties of the assessment methods (i.e. evaluating symptoms under varying field conditions and the degree of comparability among the different national assessment teams) in order to identify and to eliminate the sources of variation and errors towards more statistically solid evaluations of the assessment outputs. Starting in 2000, the annual UN/ECE ICP-Forests Intercalibration Courses on the Assessment of Ozone Injury on European Tree Species were held among experts from the participating European countries. Bussotti et al. (2003a) presented the results for the 2nd UN/ECE ICP-Forests Intercalibration Course, held in 2001. At the beginning of the pan-European programme, it was the aim to test for the degree of agreement in evaluating ozone-like symptoms between the different participating national teams. Two years later, in the summer of 2003, after having gained more experience in assessing ozonelike symptoms in their respective countries, the same international groups of surveyors were asked to participate in the 4th UN/ECE ICP-Forests Intercalibration Course. On that occasion, the aim was to examine the assessment performance of the various surveyors under specific assessment conditions in order to identify the most critical points and sources of errors for both the symptom identification and the application of the assessment guide lines. A direct comparison between the results of the two training courses (2001 and 2003) is not possible due to the use of different criteria applied for the data collection and processing. The following most relevant questions were discussed during the 2003 exercises of the 4th UN/ECE ICPForests Intercalibration Course: (i) Does training and increased experience in symptom assessment improve the accuracy of the symptom assessment? (ii) Does the accuracy of the assessment depend on the particular symptom expression? (iii) How does the phenotypic plasticity of symptoms affect the assessment accuracy? (iv) How strong is the influence of possible site effects and confounding factors on the assessment quality? (v)
Does the quality of the assessment depend on the seasonal time of the assessment?
2. Materials and methods 2.1. Organization and field teams The 4th UN/ECE ICP-Forests Intercalibration Course containing two exercise blocks was held and organized by the Swiss Federal Research Institute for Forest, Snow and Landscape WSL, Birmensdorf, Switzerland in collaboration with The Pennsylvania State University (USA), the Ministry for Agricultural and Forest Policies (Italy) and the ERSAF (Ente Regionale Sviluppo Agricolo e Forestale, Lombardy, Italy) from 25 to 27 August 2003. The first set of field exercises was conducted at the Vivaio Forestale Cantonale di Lattecaldo (Canton Ticino, Switzerland, 9 � 03# E, 45 � 51# N, 600 m asl) where the WSL has been operating an open-top chamber research facility since 1995 (Skelly et al., 1999; VanderHeyden et al., 2001; Novak et al., 2003, 2005). The second set of field exercises was conducted at the Level II plot of Moggio (9 � 30# E, 45 � 54# N, 1250 m asl) located in northern Italy. The timing of the Intercalibration Course (the end of the summer) corresponded with the time period when the national field surveys are conducted on an annual basis. The very high ozone concentrations within these regions of southern Switzerland and northern Lombardy are well documented by Sandroni et al. (1994), Staffelbach et al. (1997), Gerosa et al. (1999) and Gerosa and Ballarin-Denti (2003). Ozone-induced foliar symptoms were recorded for many plant species and documented by Cozzi et al. (2000), Innes et al. (2001), VanderHeyden et al. (2001), Schaub et al. (2002), Bussotti et al. (2003b, c) and Novak et al. (2003). Based on passive ozone monitoring data, the average AOT40 exceeded 30,000 ppb hÿ1 at Lattecaldo as well as at Moggio in 2001 and 2002 (Aprile September) (see Gerosa et al., 2004). Twenty-five individual surveyors representing 13 countries (Austria, Czech Republic, France, Germany, Holland, Hungary, Japan, Italy, Lithuania, Slovenia, Spain, Switzerland and the USA) were involved in the exercises. The participants are conducting their respective national survey for ozone visible injury and attend the annual UN/ECE ICP-Forests Intercalibration Courses on a regular basis. Each surveyor was considered as a single team, indicated by a progressive numeration (T1, T2 . T25) throughout all exercises. Surveyors remained anonymous throughout the present paper. The following surveyors (i.e. members of the European Validation Centres and/or Calibration Course organizers) showed greater expertise than others: T2, T14, T19, T21, T24 and T25. Not all participants completed all exercises. Prior to the field exercises,
F. Bussotti et al. / Environmental Pollution 140 (2006) 257e268
a training day for scoring modalities and the identification of typical ozone-induced symptoms was organized under field- and OTC conditions within the Lattecaldo research facility. After each exercise, the output was discussed in plenum. 2.2. Exercise at the Lattecaldo nursery Within a given time frame of 3 h, the 25 participants from 13 nations were asked to complete the assessment of ozone visible injury on 149 samples of 45 different, native plant species (Table 1). The samples were labelled along a field trail throughout the tree nursery (Vivaio Forestale Cantonale di Lattecaldo) and within the open-top chamber (OTC) research facility of the Swiss Federal Research Institute WSL, located within the nursery area. The labelled plants/leaves showed varying symptom expressions of typical ozone-induced injury or symptoms caused by other stressors. Each person was asked to score each sample with 0 (no ozone symptoms) or 1 (presence of ozone symptoms). After the completion of this exercise, the output was summarized and validated by discussing each sample among all participants in situ in order to optimize the training effect. 2.3. Field exercises at Moggio The Moggio exercise set consisted of three exercises applying specific methodologies to test the performance of the different teams in assessing samples from the canopy of MTS and from the LESS. Plants were not pre-evaluated and no reference assessments were made. The first exercise for MTS consisted of the diagnosis and quantification of typical ozone-induced visible injury on leaves of Fagus sylvatica L. canopy trees and the recognition of mimicking symptoms caused by biotic (insects and pathogens) and abiotic (drought and frost) agents. Each team evaluated a total of six branchlets, sampled from the upper, fully sun-exposed part from the crown of selected canopy beech trees (two trees, three branchlets per tree) according to the guidelines of the ICP-Forests manual. From each branchlet, five sunexposed leaves (starting from the tip of the branchlet) were considered for the assessment. The percentage of affected leaf area of the symptomatic leaves was assessed in 5% increments on a scale from 0% to 100%. The second exercise at the LESS was performed within a 25 ! 2 m marked rectangle (according the guide lines of the ICP-Forests manual) at the edge of a natural beech stand. Within this area, 30 individual woody plants (1e2 m tall) were selected and labelled. Each surveyor was asked to decide whether the labelled sample showed ozone symptoms (score: 1) or not (score: 0). For the third exercise, 16 1 ! 1-m squares (MiniLESS) were established along the edge of a beech stand.
259
A complete floristic list of herbaceous and woody plant species, rooting within each square, including the branches above the square, was provided. Each surveyor was asked to decide whether the present plants or plant parts showed ozone symptoms (score: 1) or not (score: 0).
2.4. Statistics Descriptive statistics (mean, standard deviation and the coefficient of variation, CV Z St.dev. * Meanÿ1) were calculated for the evaluators’ scores. For the Lattecaldo exercise where reference values for each plant were provided, the level of agreement between the evaluation and the reference was tested according to the Cohen’s kappa statistics, per evaluator and per species (Bakeman and Gottman, 1986). Cohen’s kappa statistics assessed the agreement between the evaluations of two observers for the same sample. A value of 1 (the sign plus or minus does not influence the result) indicates a perfect agreement. A value of 0 indicates that the agreement is no better than by chance. The kappa statistic is only applicable if both variables use the same categorical values and both variables have the same number of categories. The percentage of agreement among the surveyors’ evaluations for the Moggio exercises was assessed by means of simple frequency counts of the coincident percentage evaluation of leaf area affected. Cluster analysis was used to select and characterize homogeneous groups of surveyors with similar evaluations. The k-means algorithm was employed to individuate the composition of the different clusters to be as distinct as possible. The cases for the analysis were sorted by surveyors and the variables consisted of the plant evaluation score from each surveyor. The statistical routines were performed with the 11.0 version of SPSS (SPSS Inc., Chicago, IL, USA).
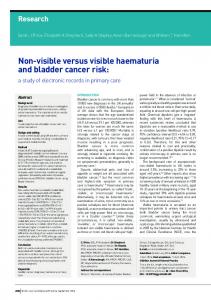
3. Results 3.1. Exercise at the Lattecaldo nursery Fig. 1A reports the frequency of agreement with the survey output of the reference team (RT) for each assessed plant from a total of 149 samples. Seventy-four percent of the samples fell in an agreement class higher than 60% (i.e. were assessed in agreement with the reference team (RT) by more than the 60% of the surveyors). With 15 different samples, the surveyors assessed the symptoms in 100% agreement with the RT. Ten of these plants were classified as non-symptomatic and five as symptomatic. For 23 samples, the agreement between surveyors and the RT was lower than 50%. Most surveyors’ assessments showed the opposite
260
F. Bussotti et al. / Environmental Pollution 140 (2006) 257e268
Table 1 List of the species assessed at the Lattecaldo OTC research facility Species
No. No. % Tot. Sympt. Agr.
Acer campestre Acer pseudoplatanus Acer saccharinum
4 7 1
3 3 1
Alnus viridis
2
1
Betula pubescens Calystegia sepium
2 1
0 1
Carpinus betulus Chenopodium spp. Cornus sanguinea
3 1 1
3 1 1
1 3 14
0 3 7
Fraxinus excelsior Impatiens parviflora Juglans nigra
5 2 1
0 2 1
Laburnum alpinum
4
1
Liriodendron tulipifera Lonicera xylosteum Morus alba
3 3 3
3 3 3
Pinus halepensis Plantago lanceolata Populus nigra Populus tremula Populus ! euramericana Prunus avium
6 3 3 1 5 6
6 0 3 1 4 3
Prunus spinosa Quercus petraea Quercus rubra Ranunculus spp. Rhamnus catharticus
2 2 2 3 4
1 1 0 1 3
Rumex obtusifolius Salix caprea Salix daphnoides
3 2 1
2 2 1
Salix triandra Salix viminalis
2 5
1 4
Sambucus nigra
4
4
Sambucus racemosa Sorbus aria Taraxacum officinale
2 1 3
2 1 1
Epilobium spp. Erigeron annuus Fagus sylvatica
Symptoms
83.1 Very fine, upper surface, light brown stippling, bronzing may be apparent 80.0 Very fine, upper surface, light brown stippling, bronzing may be apparent 63.2 Very fine, upper surface, light brown, stippling on oldest leaves. Some yellowing and premature defoliation 65.7 Upper surface stippling with red to purple coloration of older leaves. Strongly interveinal, along leaf margins 100.0 None 83.3 Very prominent upper surface, dark purple coloration and pronounced stippling of older leaves along the veins. Older leaves show advanced purpling and chlorosis leading to premature defoliation 61.2 Brown, upper surface stippling on older leaves, yellowing and premature defoliation 73.7 Interveinal, upper surface yellowing leading to white necrotic spots 73.7 Upper surface, red stippling and general leaf reddening, eventuall turning into intensife dark red even discoloration 100.0 None 78.2 Slight, upper surface reddening excluding leaf veins 76.9 Very fine, upper surface, brown stippling. The upper surface of the leaf may develop a light bronzing. Often shading effect occuring 91.8 None 81.6 Very fine, upper surface stippling and reddening, general leaf chlorosis on older leaves 64.7 Very fine, light brown to black upper surface stippling along the veins of the main leaf. Yellowing and premature defoliation of older leaves 76.0 Very faint, upper surface yellowing, strictly reduced to interveinal leaf areas. Leaf veins stay dark green 78.9 Upper surface medium brown stippling on older leaves, yellowing and defoliation of older leaves 54.4 General reddening of upper surface of older leaves 100.0 Dark brown to black, prominent, upper leaf surface stippling. Yellowing and defoliation of older leaves 52.8 Chlorotic mottling 87.7 None 60.7 Dark brown/black distinct upper surface stippling and yellowing and defoliation of older leaves 22.2 Chlorotic flecks and necrotic mottling 31.2 Slight, interveinal, upper surface yellowing with very fine dark stippling 63.2 Chlorosis on lower, older leaves, consisting of a general chlorosis and not an interveinal chlorosis. More advanced symptoms include marginal leaf reddening and necrosis, increasing chlorosis and progressing defoliation, especially of the leaves at the lower parts of young stems 66.7 Very fine, upper surface, brown stippling and yellowing and defoliation of older leaves 71.1 Very fine, upper surface and interveinal black stippling 97.4 None 78.9 Dark, upper surface patches between the veins. Rather difficult to assess 87.8 Dark, upper surface, pigmented stippling on older foliage. The older leaves are affected first, with the top leaves remaining green. The symptoms consist of a very fine, upper surface, black stippling. The stippling is more prominent towards the base of the leaf, eventually turning into dark, brownpurple with interveinal areas developing chlorosis and necrotic, light brown areas. Severely affected leaves may appear black. Premature foliage loss may follow 80.7 Even reddening, strictly between the veins 81.6 Very strong, upper surface, brown, interveinal stippling 73.7 Very fine, dark colored, upper surface stippling on older leaves starting towards the leaf tip and progressing inwards 84.2 Very fine, dark, upper surface stippling on older leaves 78.7 Very fine, upper surface, brown colored stippling on older leaves. Yellowing and premature defoliation of older leaves 76.7 Very distinctive, dark pigmented, upper surface stippling on older leaves. Injury begins as chlorotic spots which are very faint and restricted to older leaves. Injury occurs across the whole leaf. Stippling begins around the leaf margins, advancing to form more complete brown areas. Brownblack patches develop and leaves begin to crinkle and desiccate. In some very sensitive plants, a bifacial necrotic white flecking has been noted on the very oldest leaves. Leaf veins remain unaffected until the later stages of symptom expression, with entire leaf crinkling, browning and dying. Necrotic spots extend through to lower leaf surface 71.1 Very similar as Sambucus nigra 77.8 Upper surface stippling with even discoloration between the veins starting at the leave edge 28.1 Faint stippling and slight, upper surface reddening starting in the centre of interveinal leaf areas
F. Bussotti et al. / Environmental Pollution 140 (2006) 257e268
261
Table 1 (continued) Species
No. Tot.
No. Sympt.
% Agr.
Symptoms
Tilia cordata
3
2
80.4
Trifolium pratense Trifolium repens Ulmus glabra
3 3 3
3 0 1
47.8 86.0 77.2
Viburnum lantana
9
6
63.6
Viburnum opulus
7
3
73.3
Very fine, upper surface, dark-pigmented stippling of older leaves followed by premature defoliation Fine stippling and chlorosis on the upper leaf surface None Prominent, dark brown to purple, upper surface stippling, especially around leaf margins and mainly affecting older leaves Red stippling occurs uniformly across the upper leaf surface with increased intensity towards the base of the leaf. The intensity of the reddening increases through time e the leaf may be entirely red apart from the veins. The coloration involves older leaves with the youngest leaves remaining full green. No premature foliage loss has been recorded Upper leaf surface, red stippling and general leaf reddening, involving older leaves
No. Tot., total number of plants for each species; No. Sympt., number of symptomatic plants for each species according to the Reference Team; Symptom, description of the symptom expression; % Agr., percentage of the observations in agreement with the Reference Team in respect to the total number of observations.
Frequency (%)
50
frequency % Cum. Freq.%
40 30
A
20 10 0
[0-20]
[21-40]
[41-60]
[61-80]
[>80]
100 90 80 70 60 50 40 30 20 10 0
Cumulated frequency (%)
evaluation as compared to the RT where 10 of these plants were classified as symptomatic by the RT. Table 1 shows the structure of the samples subdivided into species and the percentage of agreement, i.e. the percentage of surveyors that rated in agreement with the RT. Note that the agreement was generally higher for the species with mostly non-symptomatic samples. Regarding the different forms of symptom expression, stippling was usually evaluated with a higher accuracy than symptom expressions consisting of discoloration,
Classes of agreement
necrosis or premature senescence. However, for certain species that developed typical reddening in response to ozone, the surveyors performed with a high agreement with the RT as well. In general, samples from herbaceous species were evaluated with a lower agreement than woody species, indicating possible difficulties or a lack of experience in recognizing ozone-induced symptoms on herbaceous plant species. The k-mean analysis (Table 2) identified groups of teams with homogeneous evaluation criteria. Group 1 included the teams that showed the highest agreement with the RT. Most of the more experienced participants belonged to this group. At Lattecaldo, group 1 showed the greatest assessment score of 0.57 in comparison to the other groups (group 2 Z 0.38; group 3 Z 0.54). Fig. 1B reports the level of agreement (per team and per species) with respect to the RT (Cohen’s k test); Table 3 shows the interaction for species ! team. The general the level of agreement (Fig. 1B) and the number of species with a significant agreement (Table 3) were higher for the most experienced teams.
3.2. Moggio field exercise I (MTS)
0.7
Cohen's kappa
0.6 0.5
B
0.4 0.3 0.2
0
T10 T3 T5 T22 T11 T17 T20 T23 T25 T6 T16 T24 T4 T1 T14 T19 T15 T18 T21
0.1
Fig. 1. Results of the Lattecaldo exercise. (A) Frequency (%) and classes of agreement with the reference team (RT) for 149 samples to be evaluated. (B) Agreement of the surveyors with the RT calculated by Cohen’s kappa coefficient.
The assessment of foliar symptoms on beech leaves (5% classes) showed a very high variability among the surveyors (Table 4). Teams 2 and 4 had the highest assessment scores whereas teams 12, 13, 14 and 19 did not recognize any of the visible symptoms in beech leaves. Considering the assessment of single branchlets (Table 4), we observed a very high variability among the assessments except for branchlets 4 and 6 which did not show any symptoms. T2 and T4, which assessed the branchlets in a different manner as compared to the other teams, were excluded from the grouping (cluster and k-mean analysis). The analysis allowed us to differentiate between three groups (Table 2). Most of the
262
X X
X X
X X X
X X X
X X X X
X
X
X
X
X
X
X
X X
X
X
X
X
X
X X
X
X
X
X
X
X
X
X
X
X
X
X X X
16 15
X
14 13 12 11 10 9 8 7 6 5
X
4
X
3
X
X
2 1
X
Moggio IIeIII LESSC MiniLESS
Moggio I MTS
G1 G2 G3 G1 G2 G3 G1 G2 G3 Lattecaldo
Team No. Group Exercise
Table 2 Results of the cluster analysis (k-means method) for each exercise
The Moggio I and Moggio II (LESS and Mini-LESS) are considered both combined. Three homogeneous groups of surveyors (G1, G2 and G3) were individualized for each exercise. The most experienced teams are marked in bold. Mean indicates the mean assessment value of each team.
X X
19
X
18 17
X
X
23
X X
20
21
22
X
24
25
0.57 0.38 0.54 2.96 1.15 9.15 0.25 0.31 0.16
Mean
F. Bussotti et al. / Environmental Pollution 140 (2006) 257e268
more experienced participants were included in group 2, which assessed in a more ‘conservative’ manner than the other groups (1.15 compared to group 1 Z 2.96 and group 3 Z 9.15). A specific problem seemed to exist with branchlet number 5 for which the ratings among the surveyors differed the most. The stippling was not distributed randomly within the interveinal leaf areas as usual but was more frequently closer to the secondary veins instead, which raised questions concerning the symptominducing stress factor. Due to lack of evidence and contradicting symptom expressions, this branchlet was conserved for further analysis, i.e. microscopical validation which confirmed the stippling as being ozoneinduced symptoms (see Vollenweider et al., 2004).
3.3. Moggio field exercise at LESS and III Min-LESS For the majority of the labelled species within the LESS, more than 80% of the surveyors agreed on ozone as the being the main cause for the observed visible symptoms on the respective species with the exception of the genus Rosa (Table 5). For beech, the high agreement may be due to the high number of non-symptomatic leaves. Obviously, it was easier to evaluate a nonsymptomatic leaf rather than a symptomatic one. Table 6 demonstrates a certain degree of uncertainty in recognizing and evaluating symptom expressions on herbaceous species grown within the Mini-LESS. For the tree species, the level of agreement ranged from 70% (Betula pendula) to 100% (Acer pseudoplatanus). The cluster analysis, which considered the results of the two exercises combined, differentiated between three groups (Table 2). Group 3 included the most experienced surveyors. As with the previous exercises, the experienced participants were more conservative in their assessment compared to the other, less experienced participants (group 3 Z 0.16 in respect to group 1 Z 0.23 and group 2 Z 0.30).
4. Discussion Overall, not all the assessed species were already characterized as ‘sensitive’ (Table 7, see Working Group, 2004) and only a smaller number was tested under controlled and/or semi-controlled conditions (Table 7). In many cases, the surveyors were asked to assess visible symptoms according to a likelihood criterion, which is an important source of differences between the teams. However, the gained experience of each surveyor had a strong positive effect on the assessment of symptoms on those species that were not confirmed
Table 3 Interactions between surveyors and plant species for the Lattecaldo exercise
Acer campestre Acer pseudoplatanus Alnus viridis Fagus sylvatica Laburnum alpinum Populus x euramericana Prunus avium Prunus spinosa Quercus petraea Ranunculus spp. Rhamnus catharticus Rumex obtusifolius Salix triandra Salix viminalis Taraxacum officinale Tilia cordata Ulmus glabra Viburnum lantana Viburnum opulus No. of cases with significant agreement, per surveyor
1
0.9 1
1 1 1 1 1 ÿ1
T3
T4
0.5 0.6
1
0.5
0.86 1
0.3 1 1 1 0.2 1 0.6 ÿ1 1
1 1 0.5 1
T5 1 0.5 ÿ1 0.9 ÿ1 0.3 0.3 1 1 0.4
T6 0.5 0.7 1 0.6
1 1 1 0.5
1 ÿ1
1 ÿ0.8
0.4 0.3 0.4
0.4 0.25 0.4
1
0 0.4
5
1
4
1 0.6 ÿ1
T10
T11
0.5 0.2
0.5 0.7
0
0.6 0.2
0.1 0.7 1 ÿ1 1 0.5 1 1 0.1 0.4 1
ÿ1 1 1 1 0.6
0
1 0.5 0.7
0.4
0.4 0.3 1
1
2
0
2
T14 1 1 1 0.6
0.3 1 1 1 1 1 0.6 ÿ1 1 0.4 0.1 0.7 4
T15 0.7 0.4 1 0.7
1 1 1 1 ÿ1
T16 0.5 0.4 0.7 1 0.7 1 1 1 1 0 1
0.8 1
0
4
2
T17 0.2 0.4 1 0.1 0
T18 0.7 0.6 1 0.7
T19 1 1 1 0.5 1 0.1 0
T20 0.5 0.7 0.1 0
1
T21 1 1 1 0.7 1 0.4 1
ÿ1 1 0.4 1 0.3 ÿ1 1 0.4 0.3 0.4 1
1 1 1 1 ÿ1 1 0.8 0.7 3
1 1 ÿ1 1 1 0.7 0.7 5
1 1 1 0.1 ÿ1 0.4 0.8 0.4 1
T22 0.5 0.7 0.7 0.1 0 1 1
1 1 1 1 ÿ1 1 0.4 1 0.4
0.5 1 1 0.1 ÿ1 1
7
1
0.3 0
T23
T24
T25
0.5 1 1 0.4 0
1
0.2 0.7
0.4 0.5
0.7 1
0.3 1 1
0.3
1 1 ÿ1 1 0.4 0.3 0 2
1 1 1 1 1 1 1 ÿ1 1 0.3 0.4 4
1 1 1 ÿ1 1 1 0.7 5
F. Bussotti et al. / Environmental Pollution 140 (2006) 257e268
T1
The level of agreement with the reference team was estimated by Cohen’s kappa coefficient. 1 Z maximum agreement; 0 Z maximum disagreement. The values in bold indicate statistically significant agreements. Blank cells were used when the Cohen’s kappa test was not applicable. The level of agreement depends on the number of cases, therefore a high kappa value may not be significant.
263
264
F. Bussotti et al. / Environmental Pollution 140 (2006) 257e268
Table 4 Results of the Moggio I exercise for the Main Tree Species
Table 5 Results of the Moggio II exercise at the light-exposed sampling site
Surveyor
Mean
St. dev.
T1 T2 T3 T4 T5 T6 T7 T8 T9 T10 T11 T12 T13 T14 T15 T16 T17 T18 T19 T20 T21 Branch Branch Branch Branch Branch Branch Branch
0.37 27.22 3.33 10.37 0.74 0.56 0.19 1.11 1.48 1.3 0.19 0 0 0 1.67 0.56 0.37 0.37 0 0.37 0.19
1.33 35.06 3.92 16.29 1.81 1.6 0.96 2.12 2.33 4.72 0.96 0 0 0 2.4 2.12 1.33 1.33 0 1.33 0.96
360.29 128.81 117.67 157.05 244.36 288.23 519.62 190.65 157.05 364.24 519.62 e e e 144.12 381.29 360.29 360.29
3.9 4.24 4.43 0 0.38 0
9.51 13.64 11.72 0 16.07 0
243.56 321.91 264.68 e 4217.41
a
1 2b 3b 4c 5a 6c
CV
360.29 519.62
Mean and standard deviation of the evaluation score for each surveyor and each branch. CV (Coefficient of Variation) Z St.dev. * Meanÿ1. a Stippling, not randomly distributed within the interveinal leaf areas, more frequent close to the secondary veins (light effect on branch 1, more abundant on branch 5). b Light bronzing affecting large parts of the upper leaf surface. c No symptoms.
within OTCs and on the interpretation of the influence of possible modifying factors. The interpretation of symptoms may be doubtful for less common species, in particular under the influence of modifying factors such as extreme drought, heat or light radiation. Nevertheless, the highest agreement among the surveyors was reached in cases where the assessed plants were non-symptomatic. Interveinal stippling on the upper leaf surface was among the most accurately evaluated symptoms, whereas reddening, yellowing and/or discoloration seemed to be more easily confused with symptoms such as senescence, which may be triggered by high light radiation or other stressors. The difficulties in interpreting of these kinds of symptom expressions still persist in the field even when previously confirmed under experimental conditions. The variability of ozone-induced symptoms within the same species is another important source of error to consider. On beech leaves for example, two different kinds of symptoms, i.e. bronzing and stippling, are both considered as expressions of ozone-induced injury (Sanz
Species
Indiv. No.
1 No.
0 No.
Agreem. %
Symptoms
Betula pendula Fagus sylvatica
2 16
1 48
40 280
98 86
Fraxinus excelsior
1
16
4
80
Laburnum alpinum
3
36
25
87
Rosa spp.
1
13
8
62
Salix spp.
7
13
132
91
None Very fine upper surface brown stipple. In addition, the upper surface of the leaf may have a bronzed appearance Very fine upper surface brown stipple Very fine upper surface brown stipple Very fine upper surface brown stipple None
Indiv. No., number of individuals per species; 1 No., number of cases, classified as symptomatic; 0 No., number of cases, classified as nonsymptomatic; Agreem %, percentage of observations with the same score.
et al., 2001; Innes et al., 2001; Schaub et al., 2002). The very high CV among surveyors for the exercise conducted at Moggio indicates a substantial disagreement in the interpretation of the two kinds of symptoms. A similar result was obtained in the 2001 training course (Bussotti et al., 2003). In order to improve the effectiveness of the symptom assessment we should aim for a clear definition of the two different forms of foliar symptoms for beech. For all the exercises, however, the k-mean analysis showed a remarkable homogeneity for the symptom evaluation among the more experienced surveyors. For the field exercises at Moggio, the more experienced surveyors evaluated the foliar symptoms in a more conservative manner than the less experienced surveyors. For the nursery trail exercise at Lattecaldo, the trend was the opposite. Possible reasons for this phenomenon may be the uncertainty about the influence of possible, additional modifying factors in the field such as insects, pathogens (biotic), shade, light, heat and drought (abiotic). Under controlled conditions such as OTCs or within the tree nursery where the first exercise took place, the influence of modifying factors may be known or at least lower. Specific problems seemed to occur more frequently in recognizing and evaluating symptoms on herbaceous species. To some extent, this may have been due to the fact that most participants were not familiar enough with the species present. The most relevant problem, however, seems to be the lack of experience in
265
F. Bussotti et al. / Environmental Pollution 140 (2006) 257e268 Table 6 Results of the Moggio III exercise at the Miniplot Species
1 No.
0 No.
Agreem. %
Symptoms
2
17
17
0
100
32
1
85
9 5
21 7
0 15
70 72
1 5
4 27
12 39
1 15
71 47
Fagus sylvatica
10
48
119
0
80
Fraxinus excelsior
14
141
102
1
78
Gentiana asclepiadea*
2
0
22
9
74
Helleborus niger* Laburnum alpinum
4 3
17 1
49 50
1 0
81 98
Rubus spp.
6
34
57
0
72
Salix spp. Sorbus aria Stachys spp.*
2 1 6
7 5 26
22 12 66
0 0 3
77 71 72
Upper surface brown stippling Dark upper surface patches between the veins None Upper surface red stippling None Slight upper surface reddening excluding leaf veins Upper surface brown stippling Very fine upper surface brown stippling Even reddening between the veins Bronzing between veins Very fine upper surface brown stippling Even reddening between the veins None None Upper surface yellowing between veins
13
181
Betula pendula Cardamine heptaphylla*
2 2
Carpinus betulus Euphorbia dulcis*
Acer pseudoplatanus Astrantia major*
Indiv. No
Not rec. No
Indiv. No., number of individuals per species; 1 No., number of cases classified as symptomatic; 0 No., number of cases classified as non-symptomatic; Not Rec., not recognized; Agreem. %, percentage of observations with the same score. Asterisks indicate the herbaceous species.
reproducing ozone-induced symptoms on herbaceous species (Bergmann et al., 1999; Bungener et al., 1999; Manning et al., 2002; Manning and Godzik, 2004). Also, the timing of the assessment plays a very important role due to the fact that the phenology of the symptoms is more closely connected to the phenology of the vegetative apparatus of herbaceous species than for woody tree and shrub species. After the seeds ripen, the leaves dry out very quickly which may lead to a loss of information about the seasonal history of the plant. This suggests that herbaceous species may be more suitable for the detection of ozone-induced symptoms typically developing during the early summer season.
5. Conclusions The 2003 exercise showed a higher degree of agreement among the more experienced teams compared to the less experienced teams, clearly demonstrating the potential for an improvement of the survey accuracy with the further development of appropriate training programmes and a refining of the assessment methods. Furthermore, the results of the exercises highlighted several problems to be addressed for the improvement of the European monitoring programme.
The most relevant source of errors for field surveys was due to the fact that all species within a plot must be considered and assessed. As a consequence, each surveyor may be requested to evaluate a greater number of species with variable and/or unknown symptoms. The U.S. monitoring programme solves this problem by restricting the survey to a few bioindicator species that span a wide geographical range and show well-defined and easily recognizable ozone-induced symptoms. Within the European programme, this is much more difficult as the study sites are fixed within the ICPForests Intensive Monitoring Level II network, which includes a large floristic and climatic variability. The difficulties of the European programme underlined in this study can be addressed by taking advantage of experimental studies conducted under open-top chamber or controlled environmental conditions (see Skelly et al., 1999; VanderHeyden et al., 2001; Novak et al., 2003, 2005; Orendovici et al., 2003). These experimental set-ups allow the investigation of a larger number of species under differing environmental conditions as they occur across Europe. Special emphasis should be put on those species that develop very similar symptoms under the influence of biotic or abiotic stress factors other than ozone. In this case, easily detectable and specific markers should be individualized by mean of experimental activities.
Working Group on Air Quality, 2004
Bergmann et al., 1999
Bungener et al., 1999
x x x x x x
VanderHeyden et al., 2001
Innes et al., 2001
(x)
x x
Sanz et al., 2001
Manning et al., 2002
Novak et al., 2003
Orendovici et al., 2003
Manning and Godzik, 2004
(x) x (x)
(x) x (x)
x
x
x
x
x x x x x
(x)
x (x)
(x)
x x
x
(x) (x)
x x
x x
x
(x) (x)
(x)
(x) (x)
x x x x x x x x x x x
x x x (x) (x)
x
(x)
x (x) x
(x)
x x x
(x)
(x)
(x)
(x) (x)
(x)
x x
(x)
x
x x
x x x
x
(x)
(x)
x x x x x x x
(x)
x
(x)
(x) x x x
(x)
(x)
F. Bussotti et al. / Environmental Pollution 140 (2006) 257e268
Acer campestre Acer pseudoplatanus Acer saccharinum Alnus viridis Astrantia major Betula pendula Betula pubescens Calystegia sepium Cardamine heptaphylla Carpinus betulus Chenopodium spp. Cornus sanguinea Epilobium spp. Erigeron annuus Euphorbia dulcis Fagus sylvatica Fraxinus excelsior Gentiana asclepiadea Helleborus niger Impatiens parviflora Juglans nigra Laburnum alpinum Liriodendron tulipifera Lonicera xylosteum Morus alba Pinus halepensis Plantago lanceolata Populus nigra Populus tremula Populus x euramericana Prunus avium Prunus spinosa Quercus petraea Quercus rubra Ranunculus spp. Rhamnus catharticus Rosa spp. Rubus spp. Rumex obtusifolius Salix caprea Salix daphnoides Salix spp. Salix triandra Salix viminalis Sambucus nigra
Gimeno et al., 1992
266
Table 7 Bibliographic references of the symptomatic species considered in this paper
x x x (x) (x) (x)
x x x
x x
(x)
(x)
(x) x x x
Sambucus racemosa Sorbus aria Stachys spp. Taraxacum officinalis Tilia cordata Trifolium pratense Trifolium repens Ulmus glabra Viburnum lantana Viburnum opulus
Working Group on Air Quality (2004) provides only a list of sensitive species without any specifications about the kind of symptoms and about the kind of experimental confirmation. For the other references, the parentheses indicate that the symptom was confirmed under experimental conditions.
(x) (x) x x x
x
(x) x x
x
x x
(x)
(x)
F. Bussotti et al. / Environmental Pollution 140 (2006) 257e268
267
Acknowledgements The 4th UN/ECE ICP-Forests Intercalibration Course on the Assessment of Ozone Injury on European Tree Species was supported by the funding from the ECeUN/ ECE and made possible by the co-operation between the Swiss and Italian National Focal Centres (NFC), i.e. the Swiss Federal Institute for Forest, Snow and Landscape Research WSL in Birmensdorf and the Italian Ministry of Agricultural and Forestry Policiese National Forest Service. The authors are grateful to the Swiss Agency for the Environment, Forests and Landscapes (SAEFL) and to the Canton Ticino for the financial support of the Intercalibration Course and the Lattecaldo OTC research facility as well as to the ERSAF (Ente Regionale per lo Sviluppo Agricolo e Forestale) of the Lombardy (Italy) for the logistic and financial support of the Moggio exercises. We would like to thank Dr. Werner Landolt and Mr. Peter Bleuler for their continuing assistance in the ozone monitoring at the Lattecaldo research facility. Special thanks go to Mr. Giuseppe Tettamanti and his staff at the Vivaio Cantonale Forestale di Lattecaldo.
References Bakeman, R., Gottman, J.M., 1986. Observing Interaction: An Introduction to Sequential Analysis. Cambridge University Press, UK. Bergmann, E., Bender, J., Weigel, H.J., 1999. Ozone threshold doses and exposure-response relationships for the development on ozone injury symptoms in wild plant species. New Phytologist 144, 423e435. Bungener, P., Balls, G.R., Nussbaum, S., Geissmann, M., Grub, A., Fuhrer, J., 1999. Leaf injury characteristics of grassland species exposed to ozone related to soil moisture condition and vapour pressure deficit. New Phytologist 142, 271e282. Bussotti, F., Schaub, M., Cozzi, A., Kra¨uchi, N., Ferretti, M., Novak, K., Skelly, J., 2003a. Assessment of ozone visible symptoms in the field: perspectives of quality control. Environmental Pollution 125, 81e89. Bussotti, F., Cozzi, A., Bettini, D., 2003b. Ozone-like visible foliar symptoms at the Permanent Monitoring Plots of the CONECOFOR programme in Italy. In: Ferretti, M., Bussotti, F., Fabbio, G., Petriccione, B. (Eds.), Ozone and Forest Ecosystems in Italy. Ann. Ist. Sperim. Selvic., vol. 30, Suppl. 1, pp. 99e106. Bussotti, F., Mazzali, C., Cozzi, A., Ferretti, M., Gravano, E., Gerosa, G., Ballarin-Denti, A., 2003c. Ozone expositions and injury symptoms on vegetation in an Alpine valley (North Italy). In: Karnosky, D.F., Percy, K.E., Chappelka, A.H., Simpson, C.J. (Eds.), Air Pollution, Global Change and Forests in the New Millennium. Elsevier Science Ltd., Oxford, UK, pp. 269e276. Coulston, J.W., Smith, G.C., Smith, W.D., 2003. Regional Assessment of ozone sensitive tree species using bioindicator plants. Environmental Monitoring and Assessment 83, 113e127. Cozzi, A., Ferretti, M., Innes, J.L., 2000. Sintomi fogliari attribuibili ad ozono sulla vegetazione spontanea in Valtellina. Monti e Boschi 3e4, 42e49. FIMCI, 2003. Intensive Monitoring of Forest Ecosystems in Europe. Technical Report 2003. CECeUN/ECE, Brussels and Geneva.
268
F. Bussotti et al. / Environmental Pollution 140 (2006) 257e268
Recognition of Air Pollution Injury to Vegetation: A Pictorial Atlas. In: Flagler, R.B. (Ed.). Air and Waste Management Association, Pittsburgh, PA. Gerosa, G., Balarin-Denti, A., 2003. Regional scale risk assessment of ozone and forests. In: Karnosky, D.F., Percy, K.E., Chappelka, A.H., Simpson, C.J. (Eds.), Air Pollution, Global Change and Forests in the New Millennium. Elsevier Science Ltd, Oxford, pp. 119e139. Gerosa, G., Spinazzi, F., Ballarin-Denti, A., 1999. Tropospheric ozone in Alpine Forest sites: air quality monitoring and statistical data analysis. Water, Air and Soil Pollution 116, 345e350. Gerosa, G., Ferretti, M., Bussott, F., 2004. AOT40 for the EU/UNECE intensive monitoring forests plots in South-Western Europe: estimates from passive samplers. In: Ferretti, M., Sanz, M.J., Schaub, M. (Eds.), O3 SWEdOzone and the Forests of SouthWestern Europe. Final Report. Jointly prepared by Corpo Forestale dello Stato, Italia; Ministerio de Medio Ambiente, Direccio´n General para la Biodiversidad, Espan˜a; Eidgeno¨ssische Forschungsanstalt fu¨r Wald, Schnee und LandschaftdWSL, Schweiz; Office National des Foreˆts, France, pp. 75e94. Gimeno, B.S., Velissariou, D., Barnes, J.D., Incla´n, R., Pen˜a, J.M., Davison, A., 1992. Dan˜os visibles por ozono en aciculas de Pinus halepensis Mill. en Grecia y Espan˜a. Ecologia 6, 131e134. Innes, J.L., Skelly, J.M., Schaub, M., 2001. Ozone and broadleaved species. A guide to the identification of ozone-induced foliar injury. Ozon, Laubholz- und Krautpflanzen. In: Fu¨hrer zum Bestimmen von Ozonsymptomen. Birmensdorf, Eidgeno¨ssische Forschungsanstalt WSL, Bern, Stuttgart, Wien; Haupt. Manning, W.J., Godzik, B., 2004. Bioindicator plants for ambient ozone in Central and Eastern Europe. Environmental Pollution 139, 33e39. Manning, W.J., Godzik, B., Musselman, R., 2002. Potential bioindicator plant species for ambient ozone in forested mountain areas of central Europe. Environmental Pollution 119, 283e290. Novak, K., Skelly, J.M., Schaub, M., Kraeuchi, N., Hug, C., Landolt, W., Bleuler, P., 2003. Ozone air pollution and foliar injury development. Environmental Pollution 125, 41e52. Novak, K., Schaub, M., Fuhrer, J., Skelly, J.M., Hug, C., Landolt, W., Bleuler, P., Kra¨uchi, N., 2005. Seasonal trends in reduced leaf gas exchange and ozone-induced foliar injury in three ozone sensitive woody plant species. Environmental Pollution 136, 33e45. Orendovici, T., Skelly, J.M., Ferdinand, J.A., Savage, J.E., Sanz, M.J., Smith, G.C., 2003. Response of native plants of northeastern United States and southern Spain to ozone exposure; determining
exposure/response relationships. Environmental Pollution 125, 31e40. Sandroni, S., Bacci, P., Boffa, G., Pellegrini, U., Ventura, A., 1994. Tropospheric ozone in the pre-alpine and Alpine Regions. Science of The Total Environment 156, 169e182. Sanz. M.J., Sa´nchez Pen˜a, G., Calatayud, V., Minaya Gallego, M.T., Cervero´, J., 2001. La contaminacio´n atmosfe´rica en los bosques: Guı´ a para la identificacio´n de dan˜os visibles causados para ozono. Ministerio del Medio Ambiente. Direccio´n General de Conservacio´n de la Naturaleza. Madrid, Spain. Schaub, M., Jakob, P., Bernhard, L., Innes, J.L., Skelly, J.M., Kra¨uchi, N., 2002. Ozone injury database. !http://www.ozone. wsl.chO. Swiss Federal Research Institute WSL, Birmensdorf, CH. Skelly, J.M., Innes, J.L., Savage, J.E., Snyder, K.R., VanderHeyden, D., Zhang, J., Sanz, M.J., 1999. Observation and confirmation of foliar ozone symptoms of native plant species of Switzerland and Southern Spain. Water, Air and Soil Pollution 116, 227e234. Smith, B., Coulston, J., Smith, G., 2001. Development of the Ozone Indicator Sampling Grid. Background. Available at: !http://fia. fs.fed.us/manuals/ozone_documentation.docO. Smith, G., Coulston, J., Jepsen, E., Prichard, T., 2003. A national biomonitoring programmedresults from field surveys of ozone sensitive plants in Northeastern forests (1994e2000). Environmental Monitoring and Assessment 87, 271e291. Staffelbach, T., Neftel, A., Blattner, A., Gut, A., Fahrni, M., Sta¨helin, J., Pre´voˆt, A., Hering, A., Lehning, M., Neininger, B., Ba¨umle, M., Kok, G.L., Dommen, J., Hutterli, M., Anklin, M., 1997. Photochemical oxidant formation over Southern Switzerland. I. Results from summer 1994. Journal of Geophysical Research 102, 23345e23362. VanderHeyden, D., Skelly, J., Innes, J., Hug, C., Zhang, J., Landolt, W., Bleuler, P., 2001. Ozone exposure thresholds and foliar injury on forest plants in Switzerland. Environmental Pollution 111, 321e331. Vollenweider, P., Bussotti, F., Manninen, S., 2004. Microscopical validation of ozone symptoms during the 4th International Training Course on Assessment of ozone visible injury. Available at !http://www.wsl.ch/forest/wus/bioindic/Valicewww-de/Synthesis. pdfO. Working Group on Air Quality, 2004. Ozone Injury on European Forest Ecosystems: sub-manual for the assessment of ozone injury on European Forest Ecosystems. Available at !http://www.gva. es/ceam/ICP.forestsO.