Spark-based Anomaly Detection Over Multi-source VMware Performance Data In Real-time Mohiuddin Solaimani, Mohammed Iftekhar, Latifur Khan, Bhavani Thuraisingham
Joey Burton Ingram
Department of Computer Science The University of Texas at Dallas, Richardson, TX, USA {mxs121731, mxi110930, lkhan, bhavani.thuraisingham}@utdallas.edu
Sandia National Laboratories Livermore, CA, USA
[email protected]
Abstract—Anomaly detection refers to identifying the patterns in data that deviate from expected behavior. These nonconforming patterns are often termed as outliers, malwares, anomalies or exceptions in different application domains. This paper presents a novel, generic real-time distributed anomaly detection framework for multi-source stream data. As a case study, we have decided to detect anomaly for multi-source VMware-based cloud data center. The framework monitors VMware performance stream data (e.g., CPU load, memory usage, etc.) continuously. It collects these data simultaneously from all the VMwares connected to the network. It notifies the resource manager to reschedule its resources dynamically when it identifies any abnormal behavior of its collected data. We have used Apache Spark, a distributed framework for processing performance stream data and making prediction without any delay. Spark is chosen over a traditional distributed framework (e.g., Hadoop and MapReduce, Mahout, etc.) that is not ideal for stream data processing. We have implemented a flat incremental clustering algorithm to model the benign characteristics in our distributed Spark based framework. We have compared the average processing latency of a tuple during clustering and prediction in Spark with Storm, another distributed framework for stream data processing. We experimentally find that Spark processes a tuple much quicker than Storm on average. Index Terms—Anomaly detection; Real-time anomaly detection; Incremental clustering; Resource scheduling; Data center
I. I NTRODUCTION Real-time anomaly detection aims to capture abnormalities in system behavior in real time. The abnormalities/anomalies appear in the form of malicious network intrusion, malware infection, over-utilization of system resources due to design defects, etc. Anomaly detection in this regard involves absorbing continuous streams of data, performing analysis on them and initiating corrective measures if necessary. Therefore, it is a challenging task given the volume, velocity and possibly complex nature of the input data. Failure to accomplish this task in a timely manner may lead to catastrophic consequences with a severe impact on business continuity. The most rigorous form of real-time anomaly detection is observed in enterprise data centers which host tens of thousands of virtual machines. Dynamic resource scheduling is a crucial differentiator for the operational efficiency of these data centers. In response to varying demands for various resources, e.g. CPU and memory, the scheduler must allocate or re-allocate resources dynamically. This necessitates real-
978-1-4799-4521-4/14/$31.00 ©2014 IEEE
time monitoring of resource utilization and performance data for the purpose of detecting abnormal behavior. Real-time anomaly detectors for data centers must be found upon scalable frameworks capable of handling Big Data with low latency. Popular Big Data frameworks, e.g., Hadoop [1], MapReduce [2], HBase [3], Mahout [4], Google Bigtable [5], etc. are highly scalable, but more geared towards batch processing. Examples of frameworks with built-in stream processing capabilities are Apache Storm [6], Apache S4 [7] and Apache Spark [8], [9]. Spark performs in-memory analytics on stream data. Spark runs a streaming computation as a series of micro batch jobs. It makes the batch size as low as possible to achieve the lower end latency. It keeps the states between batches in memory so that it can recovery quickly. Spark has an advanced DAG (Direct Acyclic Graph) execution engine that supports cyclic data flow and in-memory computing. It makes Spark faster than other distributed frameworks. Spark is 100x faster than Hadoop MapReduce in memory, or 10x faster on disk [8]. It is also faster than Storm and S4 [10]. Overall, it generates low latency, real-time results. It has instant productivity and no hidden obstacles. It also has an easy cluster setup procedure. In this paper, we have the following contributions: • We have developed a novel generic real-time framework for multi-source stream data using Apache Spark [8], [9] and Kafka [11] (a message broker). Kafka provides guaranteed message delivery with proper ordering. This means messages sent by a producer to a particular topic partition will be delivered in the order they are sent and a consumer also sees messages in the order they are stored. Moreover, we can also form a Kafka cluster to handle high volume of data with low processing latency and also server failures without losing any messages. As a case study, we prefer to detect anomaly for a VMware-based data center. Our real-time framework is generic so that it can handle continuous performance data (CPU load, memory usage, disk storage information, etc.) from multiple VMwares at a time. This means that all VMwares can send their performance data to our framework and it collects them as a data chunk. Kafka ships the continuous multi-source stream data from all VMwares to a Spark cluster. Inside Spark, we apply a machine learning technique to analyze the data.
A flat incremental clustering technique [12] has been used to model online benign data. We cluster on benign training data only and we do not fix the number of clusters before building the model, rather they are generated dynamically. • We have also experimentally established the accuracy and low latency of our real-time framework in anomaly detection. The overall processing time has been reduced due to the reduction in prediction time. • We have also implemented our framework using Apache Storm [6]. We have compared the average processing latency of a tuple during training and testing for both Spark and Storm-based implementation. We found that Spark outperforms Storm substantially. The rest of the paper is organized as follows: Section II describes key concepts like data center, Dynamic Resource Scheduling, VMware performance stream data, and Spark architecture. Section III shows the our anomaly detection framework in details. Section IV shows more technical details of our novel Spark-based anomaly detection framework. Section V shows the experimental result. Section VI covers the related works. Finally, Section VII states the conclusion and future works followed by acknowledgement and bibliography. •
detection model from the data. Moreover, machine learning provides several techniques to build model from data. In unsupervised learning, we collect data instances associated with “normal” load. After that, we apply clustering algorithm (e.g., K-means [15], incremental clustering, etc.) on these data instances to build the model. Finally, we predict testing instances (in our case normal VMs or resource hungry VMs) using our model. For example, if the testing instances does not belong into any cluster of the traning model, then it is classified as “resource hungry” VM, but if it is inside a cluster, it is treated as “normal” loaded VM. We can use several distance metrics (e.g, Euclidean distance, Cosine distance, etc.) to find a testing instance falls inside a clusere. For supervised learning, we collect training data mainly labeled as “normal” and “resource hungry”. After that, we build the classification model (or rules) from these training data using classification technique (like, Support vector machine/Decision tree/K-nearest neighbor, etc.) Finally, we predict testing instances using the classification model or rules. C. VMware Performance Stream Data
A data center centralizes an organizations IT operations and equipments. It is a store house of data. It houses computer systems and associated components, such as telecommunications and storage systems. Although data center designs are unique, it has a cloud storage appliance for storage infrastructure with VMware, OpenStack and Microsoft, etc. In order to manage its storage and infrastructure, it uses resource management softwares. Some advanced data centers manage their resources dynamically to mitigate their customers extra demands. In this paper, we propose a real-time framework to identify anomaly on VMware based data center.
The performance metrics of VMware reflect its resources usage. If a user runs a resource hungry application (e.g., CPU or memory hungry), the associate counters in the performance metrics go beyond their threshold. As a result, the application requires more resources to complete its task smoothly. Our real-time distributed framework should diagnose this and reschedule the appropriate resources dynamically. VMware ESXi server [16] has an administrative command [ESXTOP] which gives us its performance data. Periodically, we capture the data. The data come as a raw format. So, we have to process them to generate the feature vector that acts as a data point for our framework. [ESXTOP] gives several performances statistics of CPU, Memory, and Disk storage. We have considered the CPU data for our framework. Our performance metrics contain average CPU load, percentage CPU usage of the physical cores (%Processor Time), percentage utilization of the logical cores (%Util Time), and percentage utilization of the physical cores (%Core Util Time).
B. Dynamic Resource Scheduling
D. Apache Spark and Real-time Issues
VMware Distributed Resource Scheduler (DRS) [13] balances the computing workloads with available resources in a virtualized environment. It allows users to define the rules for allocating physical resources among virtual machines. DRS uses resource pools [13] which can be easily added, removed or reorganized. If the workload among virtual machines, changes drastically, DRS reschedules and redistributes the virtual machines among the physical servers. It uses affinity and anti-affinity rules [14] to improve the scheduling. In order to do real-time dynamic scheduling, we can apply several machine learning techniques (unsupervised, and supervised learning, etc.) in the scheduler to analyze stream data. We are using machine learning because we do not know the behavior/nature of data in prior. We have to build our anomaly
In data center automation [17], we require two key things. First, we have to monitor the continuous performance data. Second, we need a real-time anomaly detection technique that analyzes these performance data and identifies the “abnormal” or “resource hungry” VMs. However, because of continuous large volume of stream data, we also need a scalable distributed framework. Distributed solution like Hadoop, MapReduce, etc can be used here. Hadoop runs on batch mode and cannot handle real-time data. As we are looking for real-time data analysis in a distributed framework, we have decided to use Apache Spark [8], which is a fault-tolerant, and supports distributed real-time computation system for processing fast, large streams of data.
II. BACKGROUND The following topics are the basic building blocks of our real-time anomaly detection framework. A. Data Center
Apache Spark [8] is an open-source distributed framework for data analytics. It has simple architecture. It uses Hadoop [1] for the distributed file system. It can work on the top of next generation Hadoop cluster called YARN [18]. Spark avoids the I/O bottleneck of the conventional two-stage MapReduce programs. It provides the in-memory cluster computing that allows a user to load data into a cluster’s memory and query it efficiently. This increases the performance up to 100 times faster than Hadoop MapReduce [8]. Spark has two key concepts: Resilient Distributed Dataset (RDD) and directed acyclic graph (DAG) execution engine. •
•
Resilient Distributed Dataset (RDD) RDD [19] is a distributed memory abstraction. It allows in-memory computation on large distributed clusters with high fault-tolerant. Spark has two types of RDDs: parallelized collections that are based on existing programming collections (like list, map, etc.) and files stored on HDFS. RDD performs two kinds of operations: transformations and actions. Transformations create new datasets from the input or existing RDD (e.g. map or filter), and actions return a value after executing calculations on the dataset (e.g. reduce, collect, count, saveAsTextFile, etc.). Transformations are the lazy operation that define only the new RDD while actions perform the actual computation and calculate the result or write to the external storage. Directed acyclic graph (DAG) execution engine Whenever the user runs an action on RDD, a directed acyclic graph is generated considering all the transformation dependencies. This eliminates the traditional MapReduce multi-stage execution model and also improves the performance.
Spark has also streaming [20] implementation. It is highly scalable, and fault-tolerant. It uses a micro-batch technique which splits the input stream as a sequence of small batched chunks of data. It then processes this small chunks of data as a batch and sends its result to next batch process. Spark Streaming has two types of operators: •
•
Transformation operator It maps a new DStream [10] from one or more parent streams. It has both stateless (independent on each interval) and stateful (share data across intervals) property. Output operator It is an action operator and allows the program to write data to external systems (e.g., save or print DStream).
Like MapReduce, map is a transform operation that takes each dataset element and returns a new RDD/DStream. On the other hand, reduce is an action operation that aggregates all the elements of the RDD/DStream and returns the final result (reduceByKey is an exception that returns a RDD) as RDD/DStream. Spark Streaming inherits all the transformations and actions operations like map, reduce, groupBy, and join, etc.
III. R EAL - TIME A NOMALY D ETECTION FRAMEWORK A real-time anomaly detection framework [21] has some key components like, Data Preprocessing, Training, Prediction, Model Update, and Resource Schedule. VMware performance data has several features and it comes continuously as a stream. Sometimes we need data normalization and noise elimination prior data analysis. The real-time framework applies machine learning algorithms to analyze stream data. It uses unsupervised clustering algorithms (e.g., K-means, incremental clustering) to build clusters on training data. Furthermore, We apply clustering only on normal or benign data. Later, it predicts data using its cluster information. If new testing instance belongs to any cluster, it is considered a benign and otherwise it is called anomaly. As we know that stream data may change in nature, we should update the training model periodically. Finally, the framework notifies the resource scheduler to update its resources if it detects any abnormal behavior.
Fig. 1. Real-time framework
Fig 1 describes the basic flow of the real-time framework. Initially we build the training model from the incoming stream data. After building the model, it predicts data using that model. Here, it is important to periodically update the training model because the dynamic nature of data. For example, After building the training model, some new applications may be run in VMwares which are not CPU hungry, but they change the CPU metrics. These changed CPU metrics may not be fit to any clusters in the existing model and they might be treated as anomaly during prediction. So, we need to update the model periodically to accommodate these changes. Finally, after prediction, if the framework finds any deviation from the usual behavior, it notifies the resource scheduler for rescheduling. A. Incremental Clustering Clustering problem could be defined as the technique of grouping objects so that objects in each group has similar characteristic. For example, we have n data points and each point has some attributes. We have to group these n points into k clusters so that points of similar attributes group together. Clustering uses several proximities (like Cosine similarity, Euclidean Distance, etc.) assign object to a cluster. Each cluster has also centroid or center and radius.
Incremental clustering [12] works on continuous stream data. It processes all the data points at the same time and incrementally assigns them to their respective clusters. The following algorithm, described in [12] shows incremental clustering where we have to update a sequence of n data points and maintain a collection of k clusters. For each data point, either it is assigned to one of the current k clusters or it starts off a new cluster. If the number of clusters exceeds k, then two existing clusters are merged into one to fix the number of clusters to k. In this paper, we have also implemented a flat incremental clustering algorithm where the cluster size may vary according to the input data. Incremental clustering [12] is an unsupervised technique that suits well for grouping continuous stream data. It takes the data points and incrementally assigns them to their respective clusters. The following algorithm, described in [12], [21] shows incremental clustering where we have to group a sequence of n data points to k clusters. For each data point, either it is assigned to one of the current k clusters or it starts off a new cluster. If the number of clusters exceeds k, then we merged two existing clusters into one to fix the number of clusters to k. In this paper, we have implemented an adaptive incremental clustering algorithm where we vary the number of clusters according to the data. Algorithm 1 Incremental clustering 1: procedure C LUSTERING k ← numOf cluster 2: 3: totalCluster ← 0 4: for each data point n do 5: if F itsInAnyCluster(n) then 6: U pdateCluster() 7: else 8: CreateCluster() 9: totalCluster ← totalCluster + 1. 10: if totalCluster > k then 11: M ergeT woN earestCluster() Our Spark-based framework can be a key part of the virtual [17] data center automation. As we know that the data center must have virtual resource management module. It controls and makes dynamic load balancing decision. We envision a strong connection between our framework and this virtual module. Our framework monitors the real-time VMware performance data. It collects the data and splits it to DStream [20], [10]. It builds the model by applying transformation and action operations to the input DStream. After building the training model, it passes the model for prediction. In the prediction unit, again transformation and action operations have been performed to identify the anomaly from the input stream data. We will implement machine learning algorithms (described in algorithms 2, 3) here to analyze data. After analyzing, the framework will report the result to Virtual center resource manager. Finally, the resource manager will allocate the resources to the overused VMware machines dynamically.
Fig. 2. Dynamic resource management using Apache Spark
Fig 2 shows the basic data flow for VMware dynamic resource management. The resource manager collects the VMware performance data periodically and sends it to the Spark cluster model. A cluster model is built in the training phase. After that it predicts the incoming data. If it finds any testing instance deviates from its built-in model, then it identifies the testing instance as anomaly. It informs the resource manager when anomaly is detected. Finally, the resource manager sends the data analysis information to the resource pool [13] to dynamically allocate resources if necessary. IV. SPARK-BASED ANOMALY DETECTION FRAMEWORK Our anomaly detection framework uses VMware cluster setup. The cluster consists of 5 VMware ESXi [16] (VMware hypervisor server) 5.x systems. Each of them has Intel(R) Xeon(R) CPU E5-2695 v2 2.40GHz processor, 64 GB DDR3 RAM, 4 TB hard disk and dual NIC card. Each processor has 2 sockets and every socket has 12 cores. So there are 24 logical processors in total. All of the ESXi systems contain 3 virtual machines. Each of the virtual machines is configured with 8 vCPU, 16 GB DDR3 RAM and 1 TB Hard disk. As all the VM’s are sharing the resources, performance may vary in runtime. We have installed Linux Centos v6.5 64 bit OS in each of the VM along with the JDK/JRE v1.7. We have designed a real-time outlier detection system on this distributed system using Apache Spark. We have installed Apache Spark version 1.0.0. We have also installed Apache Hadoop NextGen MapReduce (YARN) [18] with version Hadoop v2.2.0 and formed a cluster. Apache Spark uses this YARN cluster for distributed file system. Our framework has two components. The first one is Message Broker and the second one is Stream Data Mining module. A. Message Broker Our framework continuously monitors each VMware ESXi server [16] performance data. VMware ESXi has utility tool [EXSTOP]. [ESXTOP] continuously writes the performance data of its ESXi server in a CSV (Comma Separated File) file. We read those CSV files and transport the data through
message broker. Several message brokers (e.g., Apache Kafka [11], RabbitMQ [22], etc.) are available to integrate with Spark. We have chosen Kafka 3.3.4 because it is stable and also compatible with Apache Spark. Kafka creates a dedicated queue for message transportation. It supports multiple source and sink on the same channel. It ships (in Fig 3) those performance data to Spark’s streaming framework. It provides guaranteed message delivery with proper ordering and we can form a Kafka cluster to handle large volume of data.
Fig. 3. Technical Approach
B. Stream Data Mining Module As in the Fig 3, we have implemented a clustered network using Apache Spark. The VMware performance data is transported through Kafka queue continuously as Stream. It is split into small micro batches called DStream. Several transformation and action operations are performed on these DStreams to build training model and also predict anomaly. At each micro batch processing, it stores the immutable dataset in memory and propagates the result to next micro batch processing. The framework builds the model from the benign stream. After that, it predicts the incoming stream data to identify anomalies. i Training The Spark framework builds the initial training model. Algorithm 2 shows that it has two components: map and reducedByKey. The map function (lines 3-8) takes each instance of the DStream called tuple and extracts data point from this tuple. Later, it finds the nearest cluster for that data point. If there is no nearest cluster, then it uses the data point as a new cluster’s centroid. It uses this nearest cluster’s centroid (line 8) or new centroid (line 6) as a key and the data point as a value. The reducedByKey acts as a reducer. It receives the centroid as a key and a list of data points as a value. If the centroid does not belong to any cluster, then it creates a new cluster with that centroid. Otherwise, it updates the cluster. Lines 9-15 describes it. All the data points with same centroid will go to a reducer. Data points with different centroids will go to different reducers. In the U PDATE function (line 16-19), we fetch the cluster from its index. After that, we update
Algorithm 2 Training 1: procedure T RAINING (InputDStream) 2: trainingModel ← InputDStream.map(T uple t){ 3: n ← t.getDataP oint() 4: closestCluster ← FIND N EAREST C LUSTER(n) 5: if closestCluster == Empty then 6: return M ap(n, n) 7: else 8: return M ap(closestCluster.Centroid, n) 9: }.reducedByKey(centroid, [dP oint1, dP oint2..]){ 10: index ← F ITS I NA NY C LUSTER(centroid) 11: if index == −1 then 12: C REATE C LUSTER (centroid) 13: else 14: U PDATE(index, [dP oint1, dP oint2..]) 15: } 16: procedure U PDATE (index, [dP oint1, dP oint2..]) 17: cluster ← F IND C LUSTER(index) 18: C ALW GTAVG C ENTER(cluster, [dP oint1, dP oint2..]) 19: C AL N EW R ADIUS(cluster) Algorithm 3 Testing 1: procedure T ESTING (InputDStream) 2: testingModel ← InputDStream.map(T uple t){ 3: n ← t.getDataP oint() 4: for each cluster k do 5: distance ← EuclideanDistance(n, centroid(k) 6: if distance ≥ Radius(k) then 7: n is anomaly 8: else 9: n is benign 10: } 11: testingM odel.print()
the cluster’s centroid by taking weighted average using the list of data instances. As Spark has stateful property, all the clusters generated in training should be kept in memory. Furthermore, it does not store any data point. Here, we have used the flat incremental clustering algorithm for training model. We have not fixed the number of clusters. For each data point, if it fits to any cluster, then we update the cluster. Otherwise, we have created a new cluster with that point. So, the number of clusters is not fixed and it may vary according to the training data. Moreover, we have used Euclidean Distance to measure the distance of two data points and our similarity function is following: 1 (1) 1 + Distance The above similarity function has the minimum value 0 (when Distance = ∞) and maximum value 1 (when Distance = 0). The closest points have higher similarity because they have higher distance. Here, we have considSimilarity =
ered a threshold of 70% when we assign points to a cluster. We have also taken a weighted average to calculate the centroid of the cluster. ii Testing During testing, it takes each instance of the DStream called tuple and extracts data point from this tuple. if any data point does not fit to any cluster, it is considered an anomaly, otherwise it is benign. If the distance between the data point and the centroid of the clusters is less than the cluster’s radius, then we consider it falling inside the cluster. A detailed algorithm is given from line 1-11 in the algorithm 3. C. Update Training Model The stream data may evolve in time. So, we have to update our training model over time periodically. We can update the training model at a fixed time interval. The interval might be set experimentally. While updating, we can use the previous clustered model and modify the cluster’s centroids for existing cluster and add new cluster for new instances. We can also save the whole cluster model information to HDFS for backup. In our experiment, we have not update the training model periodically, but it can be implemented by setting a fixed interval. D. Generating Anomaly VMwares become CPU hungry when their CPU metrics increase. We have pragmatically increased CPU load to simulate anomalous behavior of data. For example, a program with infinite loop may increase CPU load to 100%. Again, we have also done some expensive database read/write operations which also increases the value of several counters in CPU metrics (e.g., CPU usage, processor time, core utility time, etc.).
For the second dataset D2, we have installed the Yahoo Cloud Serving Benchmark (YCSB) [23] framework to generate extensible workload. We run the cloud service benchmark with different workloads and runtime properties continuously to capture stream data and build our benign model. The database system is a simple MySQL database with billions of rows inserted. Data is loaded in the load phase of the YCSB run. Later, transactions such as read and update are run on the database system to increase the workload. The client data is the performance data that captures the network, I/O, CPU and memory usages during the workload run. We have used millions of read/write operations on the database to generate anomalous stream data. B. Result We have presented the accuracy of our real-time framework in this section. Table I shows the Apache Spark cluster setup. TABLE I S PARK C LUSTER Component Worker for emitting tuples Worker for clustering Worker for prediction
As data come continuously, we have taken a time window to collect the training instances for building the model. We run the flat incremental clustering algorithm on 10,000 data instances. At the end, we get 63 clusters for dataset 1 (D1) and 134 for dataset 2 (D2). These clusters are generated dynamically. Table II shows the training data model. TABLE II T RAINING
E. Design Challenge Several key challenges like, integrating a stable message broker into the framework, handling message synchronization and message ordering, etc. came into the picture while we designed and developed our framework.
Number of parallelism 05 08 08
Number of data points Number of clusters
D1 10,000 63
D2 10,000 134
TABLE III T ESTING
F. Scalability We have designed a generic framework. We can build a message broker cluster using Kafka [11]. It is highly available and scalable. It helps us to add more VMware sources to collect their performance data. Moreover, we can add more threads to Spark executors/workers to increase parallelism. Thus, we can accommodate these large volumes of data. V. E XPERIMENTAL R ESULT A. Dataset We have used two different datasets for our experiment. For the first dataset D1, we run several jobs on Spark cluster in VMwares. We then monitor the real-time CPU performance metrics from all the VMwares. We capture the stream and build the benign model. We then programmatically increase the CPU metrics for generating anomalous stream data.
Dataset D1 D2
TPR 98.0% 99.20%
FNR 2.00% 0.80%
TNR 99.83% 99.06%
FPR 0.17% 0.94%
Table III shows the accuracy of the framework. We have taken a time window for data prediction. Total 3,500 testing instances have been taken for both datasets. 3,000 of them are benign and 500 are anomaly. Our framework correctly predicts 2,995 benign data out of 3,000 and also identifies 490 anomaly data out of 500 for dataset 1 (D1). It also correctly predicts 2,972 benign data out of 3,000 and also identifies 496 anomaly data out of 500 for dataset 2 (D2). Table III reflects the overall accuracy statistics. So our framework has higher accuracy to identify anomaly. In this table, TPR is the proportion of actual anomaly which are correctly identified
C. Comparison with Storm
Processing latency (millisecond)
We have also implemented this framework using Storm with the same environment and also the same data. D1 D2 D1 D2
(Strom) (Strom) (Spark) (Spark)
6 4 2 0
Clustering time Prediction time 0.6 0.4 0.2 0 1VM
0
2000
4000
6000
8000
10000
2VMs
3VMs
Fig. 6. Average tuple processing latency for different input VMs
Number of training instances
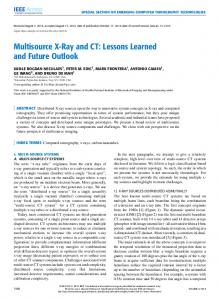
Fig. 4. Comparing average tuple processing latency during clustering
D1 D2 D1 D2 Processing latency (millisecond)
a tuple after a certain number of training instances have been processed and plotted them. The graph shows that the prediction takes almost 0.78 ms (first dataset D1) and 0.55 ms (second dataset D2) on average for Storm (when the graph reaches saturation) and almost 0.038 ms (D1) and 0.03 ms (D2) on average for Spark. From the result we see that for dataset 1 Spark is almost 20 times faster than Storm and for dataset 2, Spark is almost 18 times faster than Storm.
Time (millisecond)
and TNR is the proportion of actual benign which are correctly identified. Moreover, FNR is the proportion of actual anomaly which are misclassified as benign and FPR is the proportion of actual benign which are misclassified as anomaly.
(Strom) (Strom) (Spark) (Spark)
0.8 0.6 0.4 0.2 0 0
1000
2000
3000
3500
Number of testing instances Fig. 5. Comparing average tuple processing latency during prediction
Fig 4 shows the average process latency of a tuple for clustering during training for both Spark and Storm implementations. We have taken the average process latency of a tuple after a certain number of training instances have been processed and plot them. The graph shows that the clustering takes almost 5.85 ms (first dataset D1) and 5.30 ms (second dataset D2) on average for Storm and almost 0.6 ms (D1) and 0.4 ms (D2) on average for Spark. From the result we see that for dataset 1 Spark is almost 10 times faster than Storm and for dataset 2, Spark is almost 13 times faster than Storm. Fig 5 shows the average process latency of a tuple for predicting anomaly during testing for both Spark and Storm implementations. We take the average process latency of
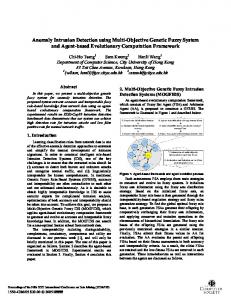
D. Experiment of Parallelism We vary the number of input VMwares when we collect data. From Fig 6, we see that the average process latency of a tuple during clustering does not increase although we increase the number of input VMwares. For single VM, the latency is almost 0.61 ms and then it decreases to almost 0.52 ms for double and triple VMs. The average process latency during prediction is almost 0.04 ms for all three cases. The limitation of this framework is using the appropriate threshold. We have experimentally selected the similarity threshold at 70% during clustering. Finally, as we do not fix the number of clusters, there might be possibility to generate many clusters with single point. But they are not influential during testing because they have only centroid without radius. Unless exact matching to these data points occurs, no testing data points will fall in these clusters. We can do the post pruning of these single point clusters. VI. R ELATED W ORK Anomaly detection naturally lends itself to clustering and therefore has been explored as a K-means clustering problem in the literature. However, for large datasets, the time complexity of K-means is prohibitive. Additionally, K-means’ initial centroid problem is a disadvantage. The initial centroid problem is circumvented by K-medoids [24] which starts with k centers, modifying the centers repeatedly and at random thereby improving the sum of squared error. Detection of outlier on stream data has been addressed by Assent et al. [25]. Their algorithm, known as AnyOut, utilizes hierarchical clustering. The deviation between an object and a cluster is determined by an outlier score. However, Structural complexity of hierarchical clustering translates to high processing time and poses a scalability challenge in case of distributed systems.
In distributed systems, anomaly detection entails processing of large-scale datasets with the aid of distributed frameworks. Among them, Hadoop[1] and MapReduce perform extremely well on offline data but lack the capabilities for handling realtime stream data. Similar technologies e.g. HBase [3], BashReduce [26], etc., are not designed for stream data processing. Apache Mahout [4], a MapReduce-based machine learning framework, provides implementations for K-means and StreamingKMeans which only run in batch mode. Anomaly detection framework based on Hadoop and MapReduce have been proposed by Yu et al. [27] and Gupta et al. [28]. Due to the inherent restrictions of the underlying frameworks, their approaches are not readily extensible to real-time processing. The state-of-the-art in real-time data processing includes Apache Storm [6] and Apache S4 [7]. Spark being faster than Storm [20], has been used as the underlying framework of our approach. A real-time anomaly detection framework for VMware performance data has been proposed in [21] which is based on Apache Storm. In contrast, we presented the first spark-based anomaly detection technique in this paper. Our detailed comparative analysis of storm-based and spark-based anomaly detection frameworks confirms that Spark incurs lower average tuple execution time. Traditional approaches to anomaly detection usually focus on accuracy and pay less attention to performance. However, performance is a key contributing factor to the efficacy of a real-time anomaly detector and our approach aims to find a framework that excels both in accuracy and performance. Although Spark provides a StreamingKMeans implementation, it assumes pre-domain knowledge of data. In contrast, our approach is agnostic about the VMware performance data while building the model. Therefore, we elected to use our flat incremental clustering instead of Spark’s StreamingKMeans. VII. C ONCLUSION AND F UTURE WORK In this paper, we presented a real-time anomaly detection framework based on Apache Spark. Powered by Spark’s inmemory computing, parallel processing and fault tolerance, our framework can process large amounts of stream data in real time. Our real-time system can be integrated with VMware’s dynamic resource management system as well as various other monitoring systems to measure operational performance. Another important use case would be analysis of sensor data from embedded devices. In the future, we aspire to implement other machine learning algorithms in our framework and compare them. We will explore the feasibility of incorporating other performance metrics, namely, memory usage, storage statistics, etc. and performing a correlational analysis to detect anomalies without any degradation of accuracy or performance. Moreover, the training data may contain noise. We will build an ensemblebased model to minimize the noise effect during training. VIII. ACKNOWLEDGMENT Funding for this work was partially supported by the Laboratory Directed Research and Development program at
Sandia National Laboratories. Sandia National Laboratories is a multi-program laboratory managed and operated by Sandia Corporation, a wholly owned subsidiary of Lockheed Martin Corporation, for the U.S. Department of Energys National Nuclear Security Administration under contract DE-AC0494AL85000. R EFERENCES [1] Apache hadoop. [Online]. Available: http://hadoop.apache.org/ [2] J. Dean and S. Ghemawat, “Mapreduce: simplified data processing on large clusters,” Communications of the ACM, vol. 51, no. 1, pp. 107–113, 2008. [3] Apache hbase. [Online]. Available: https://hbase.apache.org/ [4] Apache mahout. [Online]. Available: https://mahout.apache.org/ [5] F. Chang, J. Dean, S. Ghemawat, W. C. Hsieh, D. A. Wallach, M. Burrows, T. Chandra, A. Fikes, and R. E. Gruber, “Bigtable: A distributed storage system for structured data,” ACM Transactions on Computer Systems (TOCS), vol. 26, no. 2, p. 4, 2008. [6] Storm - distributed and fault-tolerant realtime computation. [Online]. Available: http://storm.incubator.apache.org/ [7] S4. [Online]. Available: http://incubator.apache.org/s4 [8] Apache spark. [Online]. Available: http://spark.apache.org/, [9] Apache spark. [Online]. Available: http://spark.apache.org/streaming/ [10] M. Zaharia, T. Das, H. Li, T. Hunter, S. Shenker, and I. Stoica, “Discretized streams: A fault-tolerant model for scalable stream processing,” Tech. Rep., 2012. [11] Apache kafka. [Online]. Available: http://kafka.apache.org/ [12] M. Charikar, C. Chekuri, T. Feder, and R. Motwani, “Incremental clustering and dynamic information retrieval,” SIAM Journal on Computing, vol. 33, no. 6, pp. 1417–1440, 2004. [13] Why use resource pools? [Online]. Available: http://pubs.vmware.com/vsphere-4-esx-vcenter/index.jsp?topic=/com. vmware.vsphere.resourcemanagement.doc 40/managing resource pools/c why use resource pools.html [14] VMware. Using drs affinity rules. [Online]. Available: http://pubs. vmware.com/vsphere-51/index.jsp [15] K. Tan, Steinbach, Introduction to Data Mining, 2005, no. 3. [16] VMware. vsphere esx and esxi info center. [Online]. Available: http://www.vmware.com/products/esxi-and-esx/overview [17] ——. Automating the virtual datacenter. [Online]. Available: https: //www.vmware.com/files/pdf/avd wp.pdf [18] Apache hadoop nextgen mapreduce (yarn). [Online]. Available: http://hadoop.apache.org/docs/current/hadoop-yarn/ hadoop-yarn-site/YARN.html [19] M. Zaharia, M. Chowdhury, T. Das, A. Dave, J. Ma, M. McCauley, M. J. Franklin, S. Shenker, and I. Stoica, “Resilient distributed datasets: A fault-tolerant abstraction for in-memory cluster computing.” [20] M. Zaharia, M. Chowdhury, T. Das, A. Dave, J. Ma, M. Mccauley, M. Franklin, S. Shenker, and I. Stoica, “Fast and interactive analytics over hadoop data with spark.” [21] M. Solaimani, L. Khan, and B. Thuraisingham, “Real-time anomaly detection over vmware performance data using storm,” The 15th IEEE International Conference on Information Reuse and Integration, San Francisco, USA, 2014. [22] Rabbitmq tm. [Online]. Available: https://www.rabbitmq.com/ [23] B. F. Cooper, A. Silberstein, E. Tam, R. Ramakrishnan, and R. Sears, “Benchmarking cloud serving systems with ycsb,” in Proceedings of the 1st ACM symposium on Cloud computing. ACM, 2010, pp. 143–154. [24] L. Kaufman and P. Rousseeuw, Finding groups in data: an introduction to cluster analysis, ser. Wiley series in probability and mathematical statistics. Applied probability and statistics. Wiley, 2005. [Online]. Available: http://books.google.com/books?id=yS0nAQAAIAAJ [25] I. Assent, P. Kranen, C. Baldauf, and T. Seidl, “Anyout: Anytime outlier detection on streaming data,” in Database Systems for Advanced Applications. Springer, 2012, pp. 228–242. [26] E. Frey. (2009) Bashreduce. [Online]. Available: http://rcrowley.org/ 2009/06/27/bashreduce [27] L. Yu and Z. Lan, “A scalable, non-parametric anomaly detection framework for hadoop,” in Proceedings of the 2013 ACM Cloud and Autonomic Computing Conference. ACM, 2013, p. 22. [28] M. Gupta, A. B. Sharma, H. Chen, and G. Jiang, “Context-aware time series anomaly detection for complex systems.”