American Journal of Remote Sensing 2017; 5(1): 1-9 http://www.sciencepublishinggroup.com/j/ajrs doi: 10.11648/j.ajrs.20170501.11 ISSN: 2328-5788 (Print); ISSN: 2328-580X (Online)
Spatial Data Modeling Based MCE Fuzzy Logic for Petroleum Exploration in Part of Say'un-Masilah Basin of Yemen Arafat Mohammed Bin Mohammed1, *, Akram Javed2, Mohammed Sultan Alshayef2 1
Department of Oil & Gas, Faculty of Oil and Minerals, Aden University, Shabwa, Yemen
2
Department of Geology, Faculty of Science, Aligarh Muslim University, Aligarh, India
Email address:
[email protected] (A. M. B. Mohammed),
[email protected] (A. Javed),
[email protected] (M. S. Alshayef) *
Corresponding author
To cite this article: Arafat Mohammed Bin Mohammed, Akram Javed, Mohammed Sultan Alshayef. Spatial Data Modeling Based MCE Fuzzy Logic for Petroleum Exploration in Part of Say'un-Masilah Basin of Yemen. American Journal of Remote Sensing. Vol. 5, No. 1, 2017, pp. 1-9. doi: 10.11648/j.ajrs.20170501.11 Received: February 12, 2017; Accepted: March 6, 2017; Published: March 21, 2017
Abstract: GIS Provides spatial and analytical support to assess multicriteria (MCE) methods, which are used to combine data to show areas best fulfilling specific criteria. Petroleum explorations would benefit from an MCE method that is spatial, is flexible for combining heterogeneous data, considers the interpretive nature of the data, is geologically applicable, and is applicable for frontier areas or where little information exists regarding probabilities of the presence of petroleum. This study proposes a GIS-based MCE method for petroleum exploration based on fuzzy logic, which fulfills the previously stated requirements using 9 subcriteria combined to produce a favorability map of potential exploration areas. A case study applied to Sayun Almasilah Basin East Yemen. We conclude that the method can be applied in an exploration setting and, as such, is applicable for other regions of the world. Keywords: Petroleum Exploration, Spatial Modeling, MCE, Fuzzy Logic, Favorability Zones
1. Introduction Multicriteria evaluation (MCE) is a subset of multidimensional decision and evaluation models. Multicriteria evaluations are essentially used to evaluate the outcome of combining different criteria to fulfill one or more objectives that may possibly be conflicting [1] and [2]. Different methods of conducting an MCE use different criterion evaluation and score assignments, and all of them are subjective and yield different results, (1995) [3]. Multicriteria evaluation is not strictly a spatial analytical model [4] and [5]; however, the present study makes an attempt MCE for spatial analysis, particularly with application to economic geology settings, such as mineral or petroleum exploration. Comprehensive and in-depth studies of MCE have been conducted by [6], [7] and [8]. Fuzzy logic, as presented by Bonham-Carter and supported by publications from [9], [10] and [11]. has been selected as the MCE method for investigating petroleum favorability in this
study since it is applicable for frontier areas and does not rely on prior probabilities. It has been successfully employed in mineral exploration, and economic geology; besides it is acceptable for petroleum exploration in non spatial environment, [12]. Fuzzy logic, as described by (1994) [8], uses five operators to combine a series of data sets for a final output map. Each data set is composed of data points that are somewhere on the spectrum from not favorable to most favorable. To each of these data points, fuzzy membership values are assigned, where 0 ≤ x ≤ 1 and x is the fuzzy membership value, such that a value of 0 is unacceptable whereas a value of 1 is the most favorable ideal. Gradations between the two extremes reflect the expert view. This study aims to create a method for MCE in a spatial environment that can be used for decision making support in petroleum exploration by integrating data that are spatial or tabular and can be used for analysis of data. The study proposes a data evaluation process based on a series of user- defined inputs and criteria used to show geographic areas that may be of
2
Arafat Mohammed Bin Mohammed et al.: Spatial Data Modeling Based MCE Fuzzy Logic for Petroleum Exploration in Part of Say'un-Masilah Basin of Yemen
interest for further investigation for petroleum exploration. A case study applied to Sayun- Al Masilah Basin in the central east of Yemen which is known as a mature Basin; however, the methodology applied and the resultant map of favorability area was verified by using ground truth data such as oil field and producing well selected for the evaluation, the favorable map was in agreement with the ground truth data. The method can be successfully applied to the frontier Basins where not much data are available.
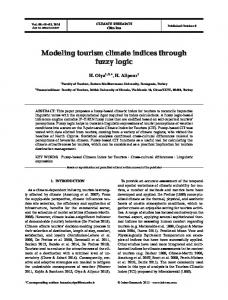
2. Study Area The Sayun-Al Masilah Basin is located in the Central East part of Yemen, "Fig. 1", it is the second richest petroliferous basin of Yemen. The Sayun–Masila Basin is bounded from the west and southwest by the Jahi–Mukalla High, to the east by the Fartaq High, and to the north by Hadramawt Arch. This basin was formed as a rift during the Late Jurassic (Kimmeridgian) due to the Gondwana breakup [13], [14], [15], [16], [17] and [18], when the African–Arabian plate was separated from the Indian–Madagascar plate [19]. The faults have a dominant WNW-ESE trend, and approximately half of the basin is underlain by deposits more than 3000 msec (T. W. T) thick. The sediments were deposited at the end of the Late Jurassic and continued till Tertiary age, (1998) [20] and (2001) [18]. The Basin has many oil fields
that were discovered by different companies. The proven source rock in this basin is organic-rich shale of the Late Jurassic, Madbi Formation, (2001) [18]. The primary reservoir in this basin is the Lower Cretaceous Qishn Clastics, [21]. Secondary reservoir objectives are Kohlan Formation sandstone, Saar Formation clastics and fractured basement. The Qishn Formation covers the tilted or horst blocks which were also formed during the rift stage. The above process caused the drape structure on the basement high. Some faults which were caused by reactivation after the rifting stage tend to cut the Qishn Formation. When the throw of those faults are larger than the thickness of the seal interval, it is difficult to trap the hydrocarbon in the fault related structure. Therefore, the potential of the hydrocarbon traps are controlled by the presence of matured source rock around the trap, and the distribution of the reservoirs and seals of each play types, such as Qishn, Saar and basement play. The Qishn reservoir interval ranges in thickness from 70 to 400 meters, thickness trends to thinner around the western area of the basin and thicker at deeper parts of the subbasins. Proven seal for the Qishn Formation is Harshyat shale, total thickness ranges from 40 to 200 meters, it is approximately 150 meter thick around the central and southern part of the basin, such thickness is adequate to provide an effective seal.
Figure 1. A representative map of the study area.
3. Materials and Methods 3.1. Data Source and Preparation In order to demarcate the favorable zones of petroleum exploration in the study area different thematic maps were
prepared from remote sensing data (surface drainage anomalies, surface lineaments), Geophysical data (isopach maps, subsurface faults, top basement) and wellbores data (geothermal gradient, source rock and TOC). The following paragraphs explained the analysis applied to the data to be prepared for the main process.
American Journal of Remote Sensing 2017; 5(1): 1-9
3.1.1. Remote Sensing Data Multidate Landsat images of ETM7 (path 162,163 and row 49) covering the study area with pixel resolution 30m, were enhanced using image processing technique(filtering, band combination, etc) for detecting best view of lineaments interpretations. ASTER GDEM data is useful for surface lineaments detection by using the shaded relief image technique. The study of lineaments has been applied successfully to structural geology studies and their applications such as ore-forming systems, mineral exploration, petroleum, nuclear energy facility sittings [22], [23], [24], [25], [26], [27], [28] and [29. Numbers of process
3
steps applied to interpret the lineaments map, which were finally prepared, "Fig. 2" in addition to the surface drainage system map, "Fig. 2. a, b" which was derived from Aster GDEM. Both Lineaments and drainage maps were converted to Density maps using arcview 3.2a. Density map is useful when combined with other data layers, finally the density map evaluated and weighted according to its importance specially when integrated with subsurface structures. Hence, Lineament and Drainage density maps classed in to three categories, (High, Moderate and Low) as shown in "Fig. 2, c, d".
Figure 2. The resulted maps of Remote sensing data: a; The drainage system extracted from ETM7 image and Aster GDEM image, b; The Lineaments map, c; The Drainage Density Map (DD), D; The Lineaments Density map (LD).
3.1.2. Geophysical Data Different geophysical data sets obtained were in the form of hard copy maps, hence these were scanned and then digitized using arcmap 9.3. The subsurface faults map was prepared from magnetic, gravity and seismic maps by digitizing in GIS environment. Density map also prepared from subsurface faults map, and was subsequently categorized into three classes. Three isopach (thickness) maps of Madbi Source rock, Qishn Reservoir and Harshyat Cap rock were prepared, Madbi source map was assigned two classes (present and not present), the other two maps of Qishn and Harshyat were given three classes(High, Moderate
and low). TWT (two way time travel) structure contour of Basement Top map was digitized and classed into (High, moderate and low). 3.1.3. Boreholes Data Geothermal gradient, total oil content (TOC) and oil field maps were contoured using surfer13, then it was exported to arcmap 9.3 with the same extension and projection of the other themes. Geothermal map given two class (High, and Low), TOC map was given three classes (High, Intermediate and Low) and oil field map was given two classes(present, not present). "Table 1" summarized the process and the result maps.
Table 1. The details of the data used, techniques, software and resultant theme for the present study. Themes Lineament Density (LD) Drainage Density (DD) Qishn Isopach(QTR) Harshyat Isopach(HTR)
Software used Envi 4.3+ globalmapper16 +surfur13+ arcview3.2 + arcmap 9.3 Arcmap 9.3 (digitized & georefrenced)
process Georeferencing + digitizing + density gridding Georeferencing + digitizing
Data type Two scenes P162R49 P163R49 Four scenes Scanned Digital maps
Source data ETM7 (free on line) Aster GDem (free on line) Seismic Magnetic
4
Arafat Mohammed Bin Mohammed et al.: Spatial Data Modeling Based MCE Fuzzy Logic for Petroleum Exploration in Part of Say'un-Masilah Basin of Yemen
Themes Top Basement(BT) subsurface faults(SLD)
Software used
process
Data type
Source data Gravity maps (provided from Yemeni petroleum exploration & production Authority, PEPA)
Arcmap 9.3+ surfur13
Georeferencing + digitizing+ contouring
Scanned Digital maps
Boreholes Data
Source rock isopach (STR) TOC map (TOC) Geothermal gradient map(GG) Oil fields map(OIF)
Gamma Operation: this is defined in term of the fuzzy algebraic product and fuzzy algebraic sum by representation:
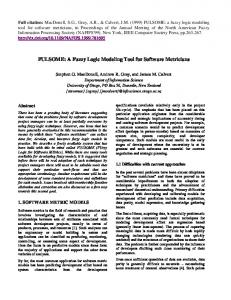
3.2. Methodology The methodology for the present study has five broad steps. "Fig. 3". Firstly, the data were prepared as vector maps, then it was evaluated and classed, then the main criteria were defined and categorized as different sub criteria then those criteria and sub criteria were converted in to raster maps. The raster maps were assigned fuzzy membership values and the Fuzzy membership (FM) maps were evaluated for the final process. Finally, the criteria and sub criteria (FM) maps were combined to locate the favorable zone for oil exploration using Fuzzy Logic operators. The final favorable map was evaluated with ground truth data for the validation of the result map. The fuzzy logic operators are (Fuzzy AND, Fuzzy OR, Fuzzy algebraic Sum, Fuzzy algebraic Product and Gamma operator). summary of operators definition mentioned below: Fuzzy AND: This is the equivalent to a Boolean AND (logical intersection) operation on classical set values µv = MIN(µA,µB,µC,……,n)
µv = (1 - ∏ni= 1[1-µ])γ (∏ni= 1µi) (1-γ)
(5)
Where, γ is a parameter chosen in the range (0, 1). when γ is 1 the combination is same as fuzzy algebraic sum, and when γ is 0 the combination is equal to the fuzzy algebraic product. Judicious choice of the γ produces output values that ensure flexible compromise between the "increasing" tendencies of the Fuzzy algebraic sum and the "decreasing" effects of the fuzzy algebraic product.
(1)
Fuzzy OR: this is equivalent to a Boolean OR (logical union) on classical set values µv = MAX(µA,µB,µC,……,n)
(2)
Fuzzy Algebraic Product: the combined membership function is defined as µv =∏ni=1µi
(3)
Where µi is the fuzzy membership function for the i map, i=1, 2, 3….., n maps are to be combined. The Fuzzy membership values tend to be very small with this operator, due to the effect of multiplying several numbers less than 1. nevertheless, all the contributing membership values have an effect on the result, unlike the fuzzy AND or Fuzzy OR operators. Fuzzy Algebraic Sum: this Operator is complementary to the Fuzzy product, being defined as µv= 1 - ∏ni =1 (1- µi)
(4)
The result is always larger (or equal to) the largest contributing fuzzy membership value. The effect is therefore "increasive". The "increasive" effect of combining several favorable pieces of evidence is automatically limited by the maximum values of (1.0). Fuzzy algebraic product is an algebraic product but Fuzzy algebraic sum is not an algebraic summation.
Figure 3. The Methodology flow chart.
4. Results and Discussion 4.1. Defining the Criteria Three main criteria can be summarized as (1) Criteria-A (2) Criteria-B, and (3) Criteria-C. The sub criteria will be defined as below. 4.1.1. Criteria-A The criteria-A, focused on the surface anomalies such as Lineaments and drainage density map of the study area, these anomalies show strong relation with the subsurface Basement
American Journal of Remote Sensing 2017; 5(1): 1-9
structures, (2010) [30], (2011) [31]. Most of the derived surface anomalies are in agreement with the location areas of oil fields and leads, therefore three sub criteria were combined, Lineament density (LD), drainage Density (DD) and subsurface Lineament Density (SLD). Hence, subsurface lineament density map was combined with surface Lineament and drainage density maps, this combination was done to show how strongly the surface anomalies (Lineament and Drainages) are controlled by subsurface structures. Hence, the results of this integration strongly support the area of structural traps. Most of the reservoirs within SayunAlMasilah Basin are of structural type, which is corroborated from the available literature. 4.1.2. Criteria-B The geophysical maps provide a better understanding of the subsurface structures. Hence, the time structure of Basement Top (BT), Qishn Isopach (QTR), Harshyat Isopach (HTR), and Madbi source Isopach (MTR) maps were used in this criteria. sub criteria layers classed according to their importance,"Table2". 4.1.3. Criteria-C Around 34 exploration well data covering the sedimentary Basin provided from the Yemeni authority, the well data ranges between producing and Dry wells, different information were extracted and mapped such as total oil content (TOC), geothermal gradient (GG). Generally two sub criteria layers were prepared and classed according to their importance, "Table 2". After the defining of the criteria and sub criteria, the final format for analysis depends on two factors: the nature of the data (raster, vector) and the type of MCE analysis. Fuzzy logic requires the use of map algebra, which is not applicable on vector data sets unless those data sets are converted to a raster. The most appropriate method for making the vector to raster conversion must be established based on the map scale of the analysis, which will influence the cell size of the raster and any vector to raster conversion methods. At the end of this step, all data should be in a uniform GIS-based format with appropriate semantically consistent attributes. Furthermore, all data should be in the same projection and should have the same grid spacing [32]. In this step all the (vector) maps were converted to raster maps, using spatial conversion tool (vector to raster) of arcmap 9.3. the resulted maps from conversion were given same pixel size (100) and image extension (Esri grid) with (UTM Zone 39N) projection. "Fig. 4" shows the 9 sub criteria after the conversion was applied using feature to raster convert of Gis spatial analyst tool.
5
4.2. Fuzzy Membership (FM) Assigned to Thematic Classes The Fuzzy membership values have been assigned to different thematic raster maps according to their classification in respect of oil exploration contribution. Different classes have been given the weightage by the different experts. All the expert weightage has been converted in the fuzzy membership maps according to their fuzzy membership values within the range of 0.1-1.0). 4.3. Model Build up Based Fuzzy Logic Operation After the criteria has been selected and the fuzzy membership values have been assigned, creating a conceptual model on how these criteria and sub criteria will interact is important by choosing fuzzy-logic operators. This section demonstrates the results of combining the data at the criteria of higher levels .Using the Spatial Data Modeler [33], a model was built in ArcGIS™ 9.3 using the model builder, "Fig. 5". The model represents all sub criteria layers to have a regional favorability map. Fuzzy logic operation process applying the equations described in section (3.2). section. The results are a series of maps showing favorability for petroleum exploration for each criterion from from "(2)" and "(5)". The final result, which is used for the evaluation, is the map from "(5)". Hence, the criteria-A map combines sub criteria using Gamma operation "(5)" by giving Gamma value equal to (0.80) which produces increasive output result map (SLLDD) showing fuzzy membership values range (0.08 to 1.0) "Fig. 6, a". The criteria-B map combines sub criteria using the Gamma value equal to (0.85) and applying "(5)". The resultant map (BTMQH) showing fuzzy membership values range (0.27 to 0.94), "Fig. 6, b", shows that black color zones indicating a high favorability. The criteria-C map combines sub criteria using the algebraic (OR) and applying "(2)", the resultant map (GTOC) showing fuzzy membership values range(0.1 to 1.0), "Fig.6,c". Finally the three derived maps from above combination (SLLDD, BTMQH and GTOC) were combined using a gamma value equal to (0.95) and applying "(5)". It is suggested that the gamma value would be near (0.95) because this value will probably be increasive and will reflect the decision-making process of a geologist (1994) [8]. Previous models used 0.95 and 0.975 for geologic models (1991) [33] and (1996) [10]. The result of the combination reflected an increasive valued map (FAFOE) showing fuzzy membership values range (0.31 to 0.99), as shown in "Fig. 6, d", indicating highly favorable zone for oil exploration.
Table 2. The criteria, sub criteria and attribute with fuzzy membership values. Criteria
Sub criteria Surface Lineament Density(LD)
A Drainage Density(DD)
Attribute High Intermediate Low High Intermediate Low
Fuzzy membership Values(FM) 1.0 0.5 0.1 1.0 0.5 0.1
6
Arafat Mohammed Bin Mohammed et al.: Spatial Data Modeling Based MCE Fuzzy Logic for Petroleum Exploration in Part of Say'un-Masilah Basin of Yemen
Criteria
Sub criteria Subsurface Density(SLD)
Lineament
Basement Top(BT)
Qishn Isopach(QTR) B Harshyat Isopach(HTR) Madbi Source(MTR) TOC C Geothermal Gradient(GG)
Attribute High Intermediate Low High Intermediate Low High Intermediate Low High Intermediate Low Present Not Present High Intermediate Low High Low
Fuzzy membership Values(FM) 1.0 0.5 0.1 1.0 0.5 0.1 1.0 0.5 0.1 0.7 0.3 0.1 1.0 0.1 0.9 0.5 0.1 1.0 0.1
Figure 4. The raster maps with their classes, (a) surface lineament density(SLD), (b) drainage density(DD), (c) subsurface lineament density(SLD), (d) basement top(BT), (e) Madbi thickness rock (MTR),(f) Qishn thickness rock (QTR),(g) Hrashyat thickness rock (HTR), (h) geothermal gradient (GG),(i) total oil content (TOC).
Figure 5. The model builder flow chart.
American Journal of Remote Sensing 2017; 5(1): 1-9
7
Figure 6. The resulted criteria maps from the fuzzy logic combinations, A; the SLLDD criteria map result from combination LD,DD,SLD sub criteria, B; the BTMQH criteria map result from combination BT,MTR,QTR,HTR sub criteria, C; the GTOC criteria map result from combination GG,TOC sub criteria, D; the FAFOE criteria map result from combination SLLDD,BTMQH,GTOC favorable maps.
4.4. Validation of Outcome The final favorability map was derived, and categorized into five classes, i.e. extremely Favorable with fuzzy membership values 0.95 to 0.99 (class 1), favorable with fuzzy membership values 0.87 to 0.95 (class 2), Moderate favorable with fuzzy membership values 0.76 to 0.87 (class 3) less favorable with fuzzy membership values 0.62 to 0.76, (class 4) and the last unfavorable with fuzzy membership values 0.31 to 0.62 (class 5). This classified map can be compared to known oil production locations in the basin. Three oil fields and six producing wells were chosen for the verification and validation of the outcome, as shown in "Fig.
7". out of 6 wells 5 wells were found in area with black color that classed as extremely favorable zone, this zone covers an area around (9166.65 sq. km), also it is observed that out of 3 oil fields 2 oil fields are located in the zone of extremely favorability as well as the oil wells, while one oil field located in zone classed as favorable zone shown in dark grey color, this zone covers an area of around (3686.24 sq. km). Hence, we can suggest that our assumption for the assigning fuzzy membership values to the sub criteria maps shows an optimum approach specially the selected logic operators and the assigning values to the gamma as well as the success in defining and evaluation the criteria and sub criteria.
Figure 7. The final favorability map for oil exploration with oil fields and produced wells locations draped over FAFOE map with fuzzy membership valuesLegend for the validation of the applied model.
8
Arafat Mohammed Bin Mohammed et al.: Spatial Data Modeling Based MCE Fuzzy Logic for Petroleum Exploration in Part of Say'un-Masilah Basin of Yemen
5. Conclusion The present study demonstrates the utility of remote sensing data and its integration with other physical and structural data in GIS domain to demarcate the potential areas of oil and gas exploration. The achieved results have manifested the oil-gas potential zones, which were detected through the use of GIS MCE based Fuzzy logic, and was subsequently validated. The study logically proves that almost all of the known oil-gas discovered wells coincided with the extremely favorable zones in the Sauyn – Al Masilah Basin .MCE based fuzzy logic is a new approach that can be applied in oil-gas exploration in the frontier Yemeni Basins. The results presented in this paper prove the significance and importance of the approach in delineating oil-gas favorable zones, especially in areas which have limited data. The approach adopted in the study seems to be the most time and cost effective besides it has a considerably high accuracy which may be replicated in other petroliferous basins of the world.
Acknowledgements The authors gratefully acknowledge the College of Oil and Minerals Engineering, University of Aden. We thank the Petroleum Exploration and Production Authority (PEPA Yemen) for their expert opinions and for preparing the data. We would like to thank The anonymous referee for their comments, which helped us improve our paper.
[8]
Bonham-Carter, G. F., 1994, Geographic information systems for geoscientists modeling with GIS: Computer methods in the geosciences: Oxford, Pergamon, 398 p.
[9]
Aminzadeh, F., 1994, Applications of fuzzy expert systems in integrated oil exploration: Computers and Electrical Engineering, v. 20, p. 89-97, doi:10.1016/00457906(94)90023-X.
[10] Wright, D. F., and G. F. Bonham-Carter, 1996, VHMS favorability mapping with GIS-based integration models, Geological Survey of Canada Bulletin 426, p. 339-376. [11] Tounsi, M., 2005, An approximate reasoning-based technique for oil assessment: Expert Systems with Applications, v. 29, p. 485-491, doi:10.1016/j.eswa.2005.05.001. [12] Bingham L., Zurita M. R., and Escalona A., Geographic information system–based fuzzy-logic analysis for petroleum exploration with a case study of northern South America, American Association Petroleum Geologists. AAPG Bulletin, vol.96, no.11 (November 2012), p.2121–2142. [13] Greenwood, W. R., Anderson, R. E., Fleck, R. J., and Roberts, R. J., 1980, Precambrian geologic history and plate tectonic evolution of the Arabian Shield, Directorate General of Mineral Resources, Ministry of Petroleum and Mineral Resources, Jiddah, Saudi Arabia, Bulletin 24, 35 p. [14] Husseini, M. I., 1989, Tectonic and deposition model of Late Precambrian–Cambrian Arabian and adjoining plates, American Association of Petroleum Geologists Bulletin, v. 73, p. 1117–1131.
[1]
Carter, S., 1991, Site search and multicriteria evaluation: Planning Outlook, vol.34, p. 27-36.
[15] Jungwirth, J., and As-Saruri, M., 1990, Structural evolution of the platform cover on southern Arabian Peninsula (P. D. R. Yemen), Zeitschrift fur Geologische Wissenschaft, vol. 18, p. 505–514.
[2]
Heywood, I., S. Cornelius, and S. Carver, 2006, An introduction to geographical information systems: Harlow, England, Pearson Prentice Hall, p 426.
[16] Schlumberger, 1992, Looking for Yemen’s hidden treasure, Middle East Well Evaluation Review, no.12, p. 12–20.
[3]
Heywood, I., J. Oliver, and S. Tomlinson, 1995, Building an exploratory multicriteria modeling environment for spatial decision support: Innovations in GIS, vol. 2, p. 127-136.
[17] Redfern, P., and Jones, J. A., 1995, The interior rifts of Yemen Analysis of basin structure and stratigraphy in a regional plate tectonic context, Basin Research, v. 7, p. 337–356.
[4]
Saaty, R., 1987, The analytical hierarchy process: What it is and how it is used: Mathematical Modeling, vol.9, p.161176, doi:10.1016/02700255(87)90473-8.
[5]
Andriantiatsaholiniaina, L., V. S. Kouikoglou, and Y. A. Phillis, 2004, Evaluating strategies for sustainable development: Fuzzy logic reasoning and sensitivity analysis: Ecological Economics, vol. 48, p. 149-172, doi:10.1016/j.ecolecon.2003.08.009.
References
[6]
Voogd, H., 1983, Multicriteria evaluation for urban and regional planning: London, United Kingdom, Pion Limited, 367 p
[7]
Carver, S. J., 1991, Integrating multicriteria evaluation with geographical information systems: International Journal of Geographical Information Systems, vol.5, p. 321-339, doi:10.1080/02693799108927858.
[18] Csato, I., Habib, A., Kiss, K., Kocz, I., Kovacs, Z., Lorincz, K., and Milota ,K., 2001, Play concepts of oil exploration in Yemen, Oil and Gas Journal, v. 99, no. 23, p. 68–74. [19] Beydoun, Z. R., 1997, Introduction to the revised Mesozoic stratigraphy and nomenclature for Yemen, Marine and Petroleum Geology, v. 14, no. 6, p. 617– 629. [20] Beydoun, Z. R., A. L. As-Saruri, Mustafa, El-Nakhal, Hamed, Al-Ganad I. N., Baraba, R. S., Nani, A. S. O., and Al-Aawah, M. H., 1998, International lexicon of stratigraphy, Volume III, Republic of Yemen, Second Edition: International Union of Geological Sciences and Ministry of Oil and Mineral Resources, Republic of Yemen Publication 34, 245 p.
American Journal of Remote Sensing 2017; 5(1): 1-9
[21] Putnam, P. E., Kendall, G., and Winter, D. A., 1997, Estuarine deposits of the Upper Qishn formation (Lower Cretaceous), Masila region ,Yemen, American Association of Petroleum Geologists Bulletin, v .81, no. 8, p. 1306–1329. [22] Lalor, J. H., The Olympic Dam copper-uranium-gold deposit, South Australia, Transactions Fourth CircumPacific Energy and Mineral Resources Conference, Singapore. American Association Petroleum Geologists. Tulsa ,Oklahoma: 561-567, 1986. [23] Woodall, R., 1993, The multidisciplanary team approach to successful mineral exploration, Society of Economic Geologists Newsletter 14: 1-6. [24] Woodall, R., 1994, Empiricism and concept in successful mineral exploration, Australian Journal of Earth Sciences 41 (1): 1-10. [25] O'Driscoll, E. S. T. & Campbell, I. B., 1997, Mineral deposits related to Australian continental ring and rift structures with some terrestrial and planetary analogies, Global Tectonics and Metallogeny vol. 6: p. 83-101. [26] Mostafa, M., Zakir, F., 1996, New enhanced techniques for azimuthal analysis of lineaments for detecting tectonic trends in and around the Afro-Arabian Shield, International Journal of Remote Sensing, vol. 17, p. 2923–2943. [27] Arlegui, L. E., Soriano, M. A., 1998, Characterizing lineaments from satellite images and field studies in the central Ebro basin (NE Spain), International Journal of Remote Sensing vol. 19, p. 3169-3185.
9
[28] Suzen, M. L., Toprak, V., 1998, Filtering of satellite images in geological lineament analyses: an application to a fault zone in Central Turkey, International Journal of Remote Sensing, vol.19, p. 1101–1114. [29] Zakir, F., Qari, M., Mostfa, M., 1999, A new optimising technique for preparing lineament density maps, International Journal of Remote Sensing, vol.20, p. 1073–1085. [30] Arafat M. M., Palanivel K, Kumanan C. J, Ramsamy SM, 2010, Significance of surface lineaments for oil and Gas Explorations in part of Sabatayn Basin, Yemen, Journal of Geography and Geology, Vol.2, No.(1), pp.119-228. www.ccsenet.org/jgg. [31] Arafat M. M., Palanivel K, C. J. Kumanan, SM Ramsamy, 2011, Spatial Analysis of Geosystem Parameters for Hydrocarbon Prospecting in part of Yemen, Journal of Geomatics ,Vol. 5, No. (1), pp25-29. [32] Sawatzky, D. L., G. L. Raines, G. F. Bonham-Carter, and C. G. Looney, 2009, Spatial data modeller (SDM): ArcMAP 9.3geoprocessing tools for spatial data modeling using weights of evidence, logistic regression, fuzzy-logic and neural networks: http://arcscripts.esri.com/details.asp?dbid=15341(access ed January 15, 2011). [33] An, P., W. M. Moon, and A. Rencz, 1991, Application of fuzzy set theory for integration of geological, geophysical and remote sensing data, Canadian Journal of Exploration Geophysics, vol. 27, p. 1–11.