Although by many perceived as important, spatial data quality has hardly ever been taken centre ... ISPRS Geospatial Week 2015, 28 Sep â 03 Oct 2015, La Grande Motte, France ..... Towards spatial data quality information analysis tools for.
The International Archives of the Photogrammetry, Remote Sensing and Spatial Information Sciences, Volume XL-3/W3, 2015 ISPRS Geospatial Week 2015, 28 Sep – 03 Oct 2015, La Grande Motte, France
SPATIAL DATA QUALITY AND A WORKFLOW TOOL M.Meijer a* L.A.E. Vullings a , J.D. Bulens a, F.I. Rip a, M. Boss a, G. Hazeu a, M.Storm a, a
Alterra, Wageningen University and Research Centre, Wageningen, The Netherlands Commission II, WG II/4
KEY WORDS: Spatial Data Quality, Communication, Producer, Consumer, Fitness for Use, Open Data, LPIS, ETS
ABSTRACT: Although by many perceived as important, spatial data quality has hardly ever been taken centre stage unless something went wrong due to bad quality. However, we think this is going to change soon. We are more and more relying on data driven processes and due to the increased availability of data, there is a choice in what data to use. How to make that choice? We think spatial data quality has potential as a selection criterion. In this paper we focus on how a workflow tool can help the consumer as well as the producer to get a better understanding about which product characteristics are important. For this purpose, we have developed a framework in which we define different roles (consumer, producer and intermediary) and differentiate between product specifications and quality specifications. A number of requirements is stated that can be translated into quality elements. We used case studies to validate our framework. This framework is designed following the fitness for use principle. Also part of this framework is software that in some cases can help ascertain the quality of datasets.
1. INTRODUCTION 1.1 General Instructions Although spatial data quality for many years has been considered important, it has not always been a priority. However, times are changing. In our day to day lives we are more and more depending on applications and services in which data plays a crucial role. And as more data becomes available we also have different datasets to choose from. But how do we make that choice? How do we make sure that we end up using the best possible data set for our application? It is our view that spatial data quality has the potential to help users choose the correct dataset. Specifically the fitness for use approach (Devillers et al., 2007) can contribute in facilitating the choice in what data to use for a specific type of application. Fitness for use of course isn’t a new concept within the scope of spatial data quality. There is already a great deal of research related to fitness for use and spatial data (e.g. Vasseur et al., 2003, Frank et al. 2004 and Devillers et al., 2007). In June 2014 we organized a symposium titled ‘Why Spatial data quality?’ More than eighty Dutch scientist and policymakers shared their thoughts on this subject. It was concluded that spatial data quality has indeed the potential to become a selection criterion and that fitness for use should be the guiding principle, but in order to reach its full potential more attention is needed to subjects such as the definition of spatial data quality, validation, communication, business case development, and means of determining spatial data quality.
defined a framework for spatial data quality. This framework is validated by case studies from a consumer as well as a producer perspective. 1.2 Background There are many ways to describe and categorise the quality of spatial data. According to ISO 8402 (1994) quality is defined as “the totality of characteristics of an entity that bear upon its ability to satisfy stated and implied needs.” And “The purpose of describing the quality of geographic data is to facilitate the comparison and selection of the dataset best suited to application needs or requirements’ (ISO 19157:2013). Not only do we have many ways of describing quality from different perspectives, we also have numerous standards describing quality. However since we are converging towards the ISO standards for spatial data we focus on the ISO 19157 (2013) standard describing spatial data quality by the following six groups of elements: Completeness, Logical consistency, Positional accuracy, Thematic accuracy, Temporal accuracy and Usability element (ISO 19157:2013). According to Devillers et al. (2006) there’s a general consensus about these criteria. All the elements before mentioned refer to the internal quality of a dataset. With internal quality we refer to the level of similarity between the data produced and the ‘perfect’ data that should have been produced (Devillers et al., 2006). However quality of spatial data in isn’t absolute. It differs in accordance with the intended use and the ability to satisfy stated and implied needs (ISO, 1994). This type of quality is perhaps better known as external quality or fitness for use.
Based on the outcome of the before mentioned symposium and our broad experiences dealing with spatial data in a number of cases (Meijer & Vullings, 2012; Storm et al., 2012a; Storm et al., 2012b; Hazeu et al., 2014; Meijer et al., in press) we have *
Corresponding author
This contribution has been peer-reviewed. Editors: A.-M. Olteanu-Raimond, C. de-Runz, and R. Devillers doi:10.5194/isprsarchives-XL-3-W3-55-2015
55
The International Archives of the Photogrammetry, Remote Sensing and Spatial Information Sciences, Volume XL-3/W3, 2015 ISPRS Geospatial Week 2015, 28 Sep – 03 Oct 2015, La Grande Motte, France
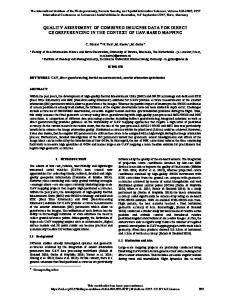
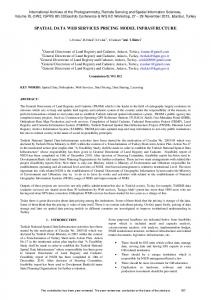
2. FRAMEWORK Based on our own experience with spatial quality projects (specifying criteria and auditing datasets (Meijer & Vullings, 2012; Storm et al., 2012a; Storm et al., 2012b; Hazeu et al., 2014; Rip & Bulens, 2013; Meijer et al., in press)) and existing literature related to spatial data quality (Devillers et al., 2006). we defined a framework for assessing spatial data quality. In order to verify and specify the framework further we used case studies. For the basic setup of the framework we take the user as a starting point. By describing the use case we identify the relevant context to be the universe of discourse. Based on this information we define the product that is wanted by the user. This can vary from plain data provisioning to automated procedures like an App to providing human services. In this stage we will limit the functionality of the framework to data and the requirements of processes. For now we leave the quality aspect of the processes themselves as well as the institutional aspect out of our scope. They are to be included in a next stage. In the framework the user as a consumer plays a central role, since the consumer and the context of the actual use determines the necessary quality (fitness for use). In order to get a good understanding of what the user actually needs it’s important to unravel the information question into criteria with the help of spatial data quality expertise. Depending on the case this can be done by a structured questionnaire or, if more complex, with the help of mediators and using interview techniques. The mediators need to be good communicators with a good understanding of spatial data quality. In figure 2 we present a workflow that will help guide us to get a better understanding of the quality needed. The first phase is focussed on revealing all relevant product characteristics and, where applicable, relating them to quality requirements using the standardised quality elements. So, we distinguish between product characteristics and quality characteristics. For instance if the consumer is looking for data of trees in his municipality and he needs to know what type of tree is located where, a product characteristic is that the data set needs to include data on the type of tree. A quality characteristic can be that 95% of the records in the dataset provide species information. At the end of this process the user/consumer has a complete list of appropriate product characteristics and quality characteristics. Next to the consumer there is a producer and an intermediary or broker role defined. The broker is defined as a service provider of spatial data between the consumer and producer and as such can add value to the data of the producer or supply services that provide the data as a product. Both the broker and producer should specify the product characteristics and the value of the quality characteristics of their dataset(s) and in case of data set transformations of all the ‘in between’ products as well. This information has to be comprehensible and easily accessible for the consumer. Only then a consumer can judge whether a dataset is ‘good enough’ to fit the intended use. The framework is visualised in figure 1.
Figure 1: framework spatial data quality In the past producers were the ones creating datasets, usually initiated by a specific need for that data. In time more use cases can evolve that have a need for the same type of data. Common practice was to use that data or when necessary transform the data to be useful for the case. It is conceivable that a producer from a business point of view will market his data. In that case the data should be multipurpose, fitting more than one need. Instead of just one use case, the producer should make an inventory of possible use cases for which the data could be needed and for each use case the product and quality characteristics should be defined. This process is visualised in figure 1. Software like for example webbased workflow tool can facilitate processes to ascertain the quality of datasets for producers. Firstly it will help them to establish that the quality of the dataset is in accordance with the set of standards for consumers. Secondly it will help the producer to find out whether the quality of the dataset is conform the criteria defined by the information question. In the next chapter the use of a workflow tool is illustrated by an example about the land parcel information system in the Netherlands. 3. USE CASE: LAND PARCEL INFORMATION SYSTEM In Europe farmers receive around €50 BLN of subsidies a year. Most of this money is reserved for so-called area based subsidies. Meaning for example that for every hectare of arable land or square meter of hedgerows farmers receive a certain amount. These subsidies are part of the Common Agricultural Policy (CAP). To make sure that subsidies are paid for the correct area all member states have setup a Land Parcel Identification System (LPIS). One of the most important datasets of the LPIS is the reference layer. The reference layer is used as a control instrument to check area applications made by farmers. In the Netherlands this reference layer was based on a product called TOP10NL. This is a digital topographical dataset produced by the Dutch Cadastre. It is the most detailed product within the national topographical base registration. It is generated from aerial photo interpretation, combined with information from cyclorama photographs. Cyclorama’s are high-quality 360° panoramic images with high accuracy. They provide current and clear views of street level environments
This contribution has been peer-reviewed. Editors: A.-M. Olteanu-Raimond, C. de-Runz, and R. Devillers doi:10.5194/isprsarchives-XL-3-W3-55-2015
56
The International Archives of the Photogrammetry, Remote Sensing and Spatial Information Sciences, Volume XL-3/W3, 2015 ISPRS Geospatial Week 2015, 28 Sep – 03 Oct 2015, La Grande Motte, France
readily from the web. Cycloramas have a number of unique features, including metric accuracy and geo-referencing. As-Is situation: what are the current product characteristics
Start How or for what is the product used?
Identify possible Use Cases
Optimise the product for this UC
For every UC
Ja
Can the product be improved
no
no
Does the product satisfy the specifications of the UC
Figure 3: In this example the land use is unclear and not all parcel boundaries correspond to features in the field.
Determine product and quality characteristics and specifications
yes
Not suitable for the UC
Suitable for UC
UC void
All UC’s processed?
no
yes
roadside verge
Determine the specifications margin of the product and quality characteristics based on the processed UC’s
End The specifications margin of the product and quality characteristics determined
Figure 4: This example show an incorrect interpretation of the operator. Non agricultural area (a roadside verge) was included in the reference parcel.
Figure 2: process flow of identifying customer product and quality requirements for producer For many years the Dutch paying agency responsible for controlling and paying subsidies to farmers considered the TOP10NL fit for use to control area based payments. But a couple of years ago the Dutch government was sanctioned by the European Commission because the Dutch LPIS was unable to perform two explicit functions;
unambiguous localisation of all declared agricultural parcels by farmer and inspectors, the quantification of all eligible area for crosschecks during the administrative controls by the paying agency.
In figure 3 and 4 two examples are given illustrating the problems related to the Dutch LPIS.
Failure of an LPIS in the unambiguous localisation induces risks for double declaration of land and for ineffective inspections; inadequate quantification of eligible area renders the crosschecks ineffective for preventing and identifying overdeclarations by farmers. Both failures involve financial risks for the EU Funds. Based on decision process similar to the flowchart presented in figure 1 the Dutch paying agency looked for an alternative. Eventually it was decided to create a new reference layer from scratch. But how can you be sure that this new reference layer is able to perform the two functions previously mentioned? And not only now but also in the future? The Dutch landscape is dynamic in nature. Land changes for example from agricultural to residential or grassland changes into arable land. If these changes are not recorded properly and/or quick enough this will have an impact on the quality of a spatial dataset. But how to decide if the quality is below a certain threshold? When is the quality so bad that the LPIS
This contribution has been peer-reviewed. Editors: A.-M. Olteanu-Raimond, C. de-Runz, and R. Devillers doi:10.5194/isprsarchives-XL-3-W3-55-2015
57
The International Archives of the Photogrammetry, Remote Sensing and Spatial Information Sciences, Volume XL-3/W3, 2015 ISPRS Geospatial Week 2015, 28 Sep – 03 Oct 2015, La Grande Motte, France
can’t perform its two explicit functions? The first step is to relate the two explicit functions to quality criteria and find the best fitness for use. In paragraph 1.2 we already presented six groups of elements we believe are important. We can also use these elements in the case of the LPIS. For example thematic accuracy can be linked to the eligibility of a reference parcel or the correct land cover classification. Completeness can be linked to the coverage of all agricultural land in a specific region or country. Temporal quality can be linked to changes of the land and the processing of these changes in the reference layer. In the Netherlands this has been used to setup a quality framework for the LPIS. For each of the different criteria the European Commission has indicated which quality should be. To give an example. One of the quality is related to the correct quantification of the area eligible for subsidies. To check this an operator has to digitize the same area covered by an existing reference parcel and compare both areas. If the area difference is less than 3% the existing reference parcel is considered to be conform.
4. WORKFLOW TOOL In order to facilitate the user but also the producer in assessing the quality of the reference layer we built a web-based workflow tool that guides for example the quality control expert through a number of steps which will eventually lead to an overview of the quality of the product. The first phase consists of taking a representative sample of the reference layer and collecting recent orthoimagery. The orthoimagery can be a recent aerial image or high resolution satellite imagery. After sampling the reference parcels the selected parcels are inspected. The first step in inspecting the reference parcels consists of ascertaining if it’s feasible to inspect the selected reference parcels. In some cases it’s impossible to check a particular parcel because of issues with the imagery (see figure 5). If a parcel can’t be inspected the parcel is skipped and a new parcel is added to the sample.
Figure 6: In this image in red the original boundaries of the reference parcel are shown. In yellow the boundaries of the parcel digitised by the operator.
The workflow tool that is used to guide the operator is called the ETS Manager. ETS refers to Executable Test Suite which is often used in conformance testing (Sagris et al., 2013). Currently this workflow tool is mainly used for checking the quality of the LPIS. The main advantage of the ETS Manager is that it follows the workflow of the LPIS Quality Assurance Framework (Sagris et al., 2013). All operators follow the same set of rules which makes standardisation and reporting the results of the LPIS QAF to the European Commission a lot easier. The tool has led to a reduction of operator time but, also increased the quality of the actual reporting, and made it easier to share information about the results between different departments. 1 Preperation of orthoimagery and sample pre-selection
Output 1 1. Orthoimagery 2. Sample pre-selection
2 Reference parcel inspection
Output 2 1. Observations on pre-defined quality measures 2. Land cover delineation
3 Analysis of observed data Output 3. 1. Values on prime quality elements 2. Additional statistics and investigations
Figure 5. The selected reference parcel can’t be inspected because of clouds. If the reference parcel can technically be checked the operator has to digitise the parcel again and label the parcel in accordance with the land cover visible on the image. After the entire sample is digitised again and all errors and deviations are labelled the results need to analysed and reported to the European Commission (see also figure 7).
Annual reporting on the LPIS assessment
Figure 7: an overview of the different phases of the inspection of the quality of the reference layer (source: https://marswiki.jrc.ec.europa.eu/wikicap/index.php/Main_Page )
This contribution has been peer-reviewed. Editors: A.-M. Olteanu-Raimond, C. de-Runz, and R. Devillers doi:10.5194/isprsarchives-XL-3-W3-55-2015
58
The International Archives of the Photogrammetry, Remote Sensing and Spatial Information Sciences, Volume XL-3/W3, 2015 ISPRS Geospatial Week 2015, 28 Sep – 03 Oct 2015, La Grande Motte, France
5. DISCUSSION AND FUTURE RESEARCH/ RECOMMENDATIONS
Alterra Wageningen UR (University & Research Centre), Alterra-rapport 2548. 86 blz.; 16 fig.; 12 tab.; 15 ref. ISO 19157:2013: Geographic information - Data quality.
In order to use spatial data quality as a selection criterion when choosing a data set for usage in an application, the determination and communication of spatial data quality between consumers, brokers and producers needs to improve. A workflow tool as the one presented in the article can play a role in this process. More specifically the use of a workflow tool can lead to a harmonisation of the way quality of a dataset is assessed. It also makes reporting more easy. Additionally the use of a web-based workflow tool makes it possible to visually and remotely discuss specific issues between for example the consumer and producer. Although the ETS tool is already used by a number of different consumers and producers we want to develop the workflow tool further. To get a better understanding of how your specific dataset is performing it will be interesting to compare the results with the quality inspection results of a similar dataset. So one of the features we want to add is benchmarking. In the framework we focussed firstly on extracting and defining characteristics based on its intended use. Future work will be to extent the framework to other relevant data quality properties like for example temporal aspects of spatial data. One extension will be to assess the information published besides the data itself. One can think of the availability of feature catalogues containing commonly, standardized and excepted definitions of spatial features and their attributes. The level of compliance with existing standards (INSPIRE). Proper documentation and metadata using standards, availability of managed code lists accessible through registries based on described standardized hierarchies as for example Simple Knowledge Organization System (SKOS). Furthermore we like to continue focussing on the communication aspects, so all parties involved can find and know what is meant by quality information.
ISO 8402:1994: Quality management and quality assurance – Vocabulary. Justice, C.O., Belward, A., Morisette, J., Lewis, P., Privette, J. & Baret, F., 2000. Developments in the 'validation' of satellite sensor products for the study of land surface. In: International Journal of Remote Sensing, 21, 3383-3390. Meijer, M., Rip, F.I., Van Benthem, R., Clement, J. and Van der Sande, C, 2015. Boomkronen afleiden uit het Actueel Hoogtebestand Nederland. Alterra rapport (in prep.). Wageningen University and Research Centre. Meijer, M. and Vullings, L.A.E., 2012. Kwaliteit van ruimtelijke data in relatie tot het LPIS; kwaliteitsaspecten rondom het beheer van ruimtelijke data. Wageningen, Alterra, Alterra-rapport 2285. 124 blz; 51 fig.; 4 tab.; 40 ref. Sagris, V., Wojda, P., Milenov, P., and Devos, W., 2013. The harmonised data model for assessing Land Parcel Identification Systems compliance with requirements of direct aid and agrienvironmental schemes of the CAP. In: Journal of environmental management, 118, 40-48. Storm, M.H., Knotters, M. and Brus, D.J., 2012a. Controlemethodiek Basisregistratie Topografie. Wageningen, Alterra. Storm, M.H., Knotters, M. and Brus, D.J., 2012b. Audit Basisregistratie Topografie, resultaten van een eerste wettelijk vereiste externe controle op de kwaliteit van de BRT. Vasseur, B., Devillers, R. and Jeansoulin, R., 2003, Ontological approach of the fitness of geospatial datasets. In: Proceedings of 6th Agile Conference on Geographic Information Science, Lyon, France, pp. 497–504.
It all matters when one has the luxury to choose what data to use; it will improve use of spatial data and avoid capital mistakes. 6. REFERENCES Devillers, R. and Jeansoulin, R. (eds), 2006. Fundamentals of spatial data quality. IST. Devillers, R., Bédard, Y., Jeansoulin, R. and Moulin, B., 2007. Towards spatial data quality information analysis tools for experts assessing the fitness for use of spatial data. In: International Journal of Geographical Information Science, 21:3, 261-282. Frank, A.U., Grum, E. and Vasseur, B., 2004, Procedure to select the best dataset for a task. In: Proceedings of the Third International Conference on Geographic Information Science (GIScience 2004), Adelphi, USA, pp. 81–93. Hazeu, G.W., Schuiling, C., Dorland, G.J., Roerink, G.J., Naeff, H.S.D., and Smidt, R.A., 2014. Landelijk Grondgebruiksbestand Nederland versie 7 (LGN7); Vervaardiging, nauwkeurigheid en gebruik. Wageningen,
This contribution has been peer-reviewed. Editors: A.-M. Olteanu-Raimond, C. de-Runz, and R. Devillers doi:10.5194/isprsarchives-XL-3-W3-55-2015
59