Apr 29, 2011 - segmentation approaches can be modified easily for MS lesion segmentation. In (Bricq et al., .... The average symmetric surface distance (SD).
Spatial Decision Forests for MS Lesion Segmentation in Multi-Channel Magnetic Resonance Images Ezequiel Geremiaa,c , Olivier Clatza , Bjoern H. Menzea,b , Ender Konukogluc , Antonio Criminisic , Nicholas Ayachea a
Asclepios Research Project, INRIA Sophia-Antipolis, France Computer Science and Artificial Intelligence Laboratory, MIT, USA c Machine Learning and Perception Group, Microsoft Research Cambridge, UK b
Abstract A new algorithm is presented for the automatic segmentation of Multiple Sclerosis (MS) lesions in 3D Magnetic Resonance (MR) images. It builds on a discriminative random decision forest framework to provide a voxel-wise probabilistic classification of the volume. The method uses multi-channel MR intensities (T1, T2, FLAIR), knowledge on tissue classes and long-range spatial context to discriminate lesions from background. A symmetry feature is introduced accounting for the fact that some MS lesions tend to develop in an asymmetric way. Quantitative evaluation of the proposed methods is carried out on publicly available labeled cases from the MICCAI MS Lesion Segmentation Challenge 2008 dataset. When tested on the same data, the presented method compares favorably to all earlier methods. In an a posteriori analysis, we show how selected features during classification can be ranked according to their discriminative power and reveal the most important ones. Keywords: Multi-sequence MRI, Segmentation, Multiple Sclerosis, Random Forests, MICCAI Grand Challenge 2008 Preprint submitted to NeuroImage
April 29, 2011
1. Introduction Multiple Sclerosis (MS) is a chronic, inflammatory and demyelinating disease that primarily affects the white matter of the central nervous system. Automatic detection and segmentation of MS lesions can help diagnosis and patient follow-up. It offers an attractive alternative to manual segmentation which remains a time-consuming task and suffers from intra- and inter-expert variability. MS lesions, however, show a high variability in appearance and shape which makes automatic segmentation a challenging task. MS lesions lack common intensity and texture characteristics, their shapes are variable and their location within the white matter varies across patients. A variety of methods have been proposed for the automatic segmentation of MS lesions. For instance, in (Anbeek et al., 2004) and (AdmiraalBehloul et al., 2005), the authors propose to segment white matter signal abnormalities by using an intensity-based k-nearest neighbors method with spatial prior and a fuzzy inference system, respectively. A similar classifier combined with a template-driven segmentation was proposed in (Wu et al., 2006) to segment MS lesions into three different subtypes (enhancing lesions, T1 black holes, T2 hyperintense lesions). A false positive reduction based on a rule-based method, a level set method and a support vector machine classifier is presented in (Yamamoto et al., 2010) along with a multiple-gray level thresholding technique. Many general purpose brain tissue and brain tumor segmentation approaches can be modified easily for MS lesion segmentation. In (Bricq et al., 2008b), for example, the authors present an unsupervised algorithm based on hidden Markov chains for brain tissue segmentation in 2
MR sequences. The method provides an estimation of the proportion of white matter (WM), grey matter (GM) and cerebro-spinal fluid (CSF) in each voxel. It can be extended for MS lesions segmentation by adding an outlier detector (Bricq et al., 2008a). Generative methods were proposed consisting in a tissue classification by means of an expectation maximization (EM) algorithm. For instance, the method presented in (Datta et al., 2006) aims at segmenting and quantifying black holes among MS lesions. The EM algorithm can be modified to be robust against lesion affected regions, its outcome is then parsed in order to detect outliers which, in this case, coincide with MS lesions (Van Leemput et al., 2001). Another approach consists in adding to the EM a partial volume model between tissue classes and combining it with a Mahalanobis thresholding which highlights the lesions (Dugas-Phocion et al., 2004). Morphological postprocessing on resulting regions of interest was shown to improve the classification performance (Souplet et al., 2008). In (Freifeld et al., 2009), a constrained Gaussian mixture model is proposed, with no spatial prior, to capture the tissue spatial layout. MS lesions are detected as outliers and then grouped in an additional tissue class. Final delineation is performed using probability-based curve evolution. Multi-scale segmentation can be combined with discriminative classification to take into account regional properties (Akselrod-Ballin et al., 2006). Beyond the information introduced via the spatial prior atlases, these methods are limited in their ability to take advantage of long-range spatial context in the classification task. To overcome this shortcoming, we propose the use of an ensemble of dis-
3
criminative classifiers. Our algorithm builds on the random decision forest framework which has multiple applications in bioinformatics (Menze et al., 2009), and, for example, more recently also in the image processing community (Andres et al., 2008; Yi et al., 2009; Criminisi et al., 2010). Adding spatial and multi-channel features to this classifier proved effective in object recognition (Shotton et al., 2009), brain tissue segmentation in MR images (Yi et al., 2009), myocardium delineation in 3D echocardiography (Lempitsky et al., 2009) and organ localization in CT volumes (Criminisi et al., 2010). Applying multi-channel and context-rich random forest classification to the MS lesion segmentation problem is novel, to our knowledge. The presented classifier also exploits a specific discriminative symmetry feature which stems from the assumption that the healthy brain is approximately symmetric with respect to the mid-sagittal plane and that MS lesions tend to develop in asymmetric ways. We then show how the forest combines the most discriminative channels for the task of MS lesion segmentation. 2. Materials This section describes the data, algorithms and notations which are referred to in the rest of the article. 2.1. MICCAI Grand Challenge 2008 dataset The results in this article rely on a strong evaluation effort. This section presents the MICCAI1 Grand Challenge 2008 datasets, which is the largest 1
MICCAI is the annual international conference on Medical Image Computing and
Computer Assisted Intervention.
4
dataset publicly available, and explains the way our method is compared against the winner of the challenge (Souplet et al., 2008). In the rest of the article, the MICCAI Grand Challenge 2008 on MS Lesions Segmentations will be referred as MSGC. 2.1.1. Presentation The MSGC (Styner et al., 2008a) aims at evaluating and comparing algorithms in an independent and standardized way for the task of MS lesion segmentation. The organizers make publicly available two datasets through their website. A dataset of labeled MR images which can be used to train a segmentation algorithm, and an unlabeled dataset on which the algorithm should be tested. The website offers to quantitatively evaluate the segmentation results on the unlabeled dataset using the associated private ground truth database, and to publish the resulting scores. This project is an original initiative to provide an unbiased comparison between MS lesions segmentation algorithms. In the rest of the article, the dataset for which labels are publicly available will be referred to as public dataset, whereas the dataset for which data is not available will be referred to as private dataset. 2.1.2. Data The public dataset contains 20 cases, 10 from the Children’s Hospital in Boston (CHB) and 10 from the University of North Carolina (UNC), which are labeled by a CHB expert rater. The private dataset contains 25 cases, 15 from CHB and 10 from UNC. The private dataset was annotated by a single expert rater at CHB and jointly by 2 expert raters UNC. For each case, the centers provided 3 MR volumes: a T1-weighted image, a T2-weighted 5
image and a FLAIR image. These were co-registered and sampled to fit the isotropic 0.5 × 0.5 × 0.5 mm3 resolution. Both private and public datasets gather anatomical images from two different centers, CHB and UNC, and shows high variability in intensity contrast (cf. Section 5.2), image noise and bias field. Both public and private datasets contain highly heterogeneous cases and could thus be considered as realistic test cases. 2.1.3. Evaluation Quantitative evaluation is carried out on the private dataset using a set of known metrics defined in (Styner et al., 2008a) and summed up in Table 1. The two full sets of expert segmentations were used as reference for method comparison. 2.1.4. Top-ranked methods The challenge results highlight four top-ranked methods each reflecting a different approach to the task of MS lesion segmentation. A k-nearest neighbor classification of brain tissue relying on spatial location and intensity value was proposed in (Anbeek et al., 2008). This method provides a voxel-wise probabilistic classification of MS lesions. In (Bricq et al., 2008a), the authors present an unsupervised segmentation algorithm based on a hidden Markov chain model. The method takes into account neighborhood information, MR sequences and probabilistic priors in order to delineate MS lesions. Alternatively, the iterative method proposed in (Shiee et al., 2008, 2010) jointly performs brain tissue classification and MS lesion segmentation by combining statistical and topological atlases. Finally, in (Souplet et al., 2008), the 6
Name TNR TPR FPR PPV VO VD X SD
v∈∂(Seg)
Definition TN FP + TN TP TP + FN FP FP + TN TP TP + FP V ol(Seg ∩ GT ) V ol(Seg ∪ GT ) V ol(Seg) − V ol(GT ) V ol(GT X ) min d(u, v) + min
u∈∂(GT )
v∈∂(GT )
card(Seg ∪ GT )
u∈∂(Seg)
Unit
Best
Worse
%
100
0
%
100
0
%
0
100
%
100
0
%
0
100
%
0
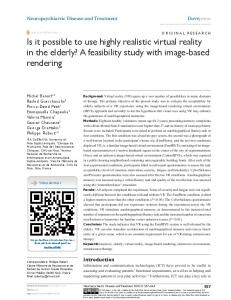
τposterior ) with τposterior = 0.5). Segmentation results show that most of lesions are detected. Although some lesions are not detected, e.g. peri-ventricular lesion in slice 38, they appear enhanced in the posterior map. Moreover the segmentations of slices 38 and 42 show peri-ventricular regions, visually very similar to MS lesions, but not delineated in the ground truth.
27
IF LAIR + GT
P osterior
IF LAIR + Seg
axial slice 50
axial slice 46
axial slice 42
axial slice 38
IT 1 + GT
Figure 6: Segmenting case UNC02 from the public MSGC dataset. From left to right: preprocessed T1-weighted (IT 1 ), T2-weighted (IT 2 ) and FLAIR MR images (IF LAIR ) overlayed with the associated ground truth GT , the posterior map P osterior = (Plesion (vk ))k displayed using an inverted grey scale and the FLAIR sequence overlayed with the segmentation (Seg = (P osterior > τposterior ) with τposterior = 0.5).
28
the UNC (cf. Figures 7 and 8) centers are obtained with the same forest. It is mandatory to use the same preprocessing as during training (cf. Section 2.2). By doing so, the cases from different datasets, e.g. T1-weighted and FLAIR images in Figures 5 and 6, show very similar intensity values for a specific brain tissue and a given MR sequence. However, we observe that the contrast in the T1-weighted and FLAIR images is more marked in case CHB05 (cf. Figure 5) than in case UNC02 (cf. Figure 6). Despite contrast changes, classification results are coherent. This illustrates the stability of our method, the random forest framework together with its preprocessing step to slight inter-image contrast variations. The trees are generated in parallel on 30 nodes and gathered to form the forest. Cropping and sub-sampling the training images aims at reducing, by a factor larger than 10, the execution time spent to learn a single tree. On IBM e325 dual-Opterons 246 at a maximum frequency of 2Ghz, learning a tree on 20 sub-sampled images and with parameters fixed in Section 4.2 on a single CPU takes, on average, 8 hours. 5.3. Influence of forest parameters The number of the trees and their depth, respectively denoted T and D, characterize the generalization power and the complexity of the nonparametric model learned by the forest. This section aims at understanding the contribution of each of these meta-parameters. A 3-fold cross-validation on the public dataset is carried out for each parameter combination. Segmentation results are evaluated for each combination using two different metrics: the area under the receiver operating characteristic (ROC) curve and the area under the precision-recall curve. 29
The ROC curve plots T P R vs. F P R scores computed on the test data for every value of τposterior ∈ [0, 1]. The precision-recall curve plots P P V vs. T P R scores computed on the test data for every value of τposterior ∈ [0, 1]. Results are reported in Figure 7. We observe that 1) for a fixed depth, increasing the number of trees leads to better generalization; 2) for a fixed number of trees, low depth values lead to underfitting while high depth values lead to overfitting; 3) overfitting is reduced by increasing the number of trees. This analysis was carried out a posteriori. Tuning the meta-parameters of the forest on the training data is not a valid practice. Using out-of-bag samples for forest parametrization is indeed preferable. Due to the fact that little training data is available for the MS lesion class, available labeled data was exclusively used to train the forest. From this perspective, the forest parameters were set to arbitrary but high enough values to avoid under- and overfitting: T = 30 and D = 20. Forest parameters were indeed selected in a safety-area with respect to under- and overfitting. The safety-area corresponds to a sufficiently flat region in the evolution of the areas under the ROC and the precision-recall curve. As shown in Figure 8, increasing the number of trees tends to benefit the generalization power of the classifier. We also observe that the performance of the classifier stabilizes for large enough forests. 5.4. Analysis of feature relevance During training, features considered for node optimization form a large and heterogeneous set (cf. Section 3.2). Unlike other classifiers, random forests provide an elegant way of ranking these features according to their 30
Figure 7: Influence of forest parameters on segmentation results. Both curves were plotted using mean results from a 3-fold cross validation on the public dataset. Left: the figure shows the influence of forest parameters on the area under the precision-recall curve. Right: the figure shows the influence of forest parameters on the area under the ROC curve. The ideal classifier would ensure area under the curve to be equal to 1 for both curves. We observe that 1) for a fixed depth, increasing the number of trees leads to better generalization; 2) for a fixed number of trees, low depth values lead to underfitting while high values lead to overfitting; 3) overfitting vanishes by increasing the number of trees.
31
Figure 8: Influence of the number of trees on segmentation results. Both curves were plotted using mean results from a 3-fold cross validation on the public dataset. Top: the figure shows the influence of the number of trees on the area under the precision-recall curve. Bottom: the figure shows the influence of the number of trees on the area under the ROC curve. We observe that, for a fixed depth D = 14, increasing the number of trees improves generalization as stated in (Breiman, 2001). The increase in performance stabilizes around the value T = 30.
32
discriminative power. In this section, we aim at better understanding which are the most discriminative channels and visual cues (local, context-rich or symmetric) used in the classification process. 5.4.1. Most discriminative visual features The first approach consists in counting the nodes in which a given feature was selected. We observe that local features were selected in 24% of the nodes, context-rich features were selected in 71% of the nodes whereas symmetry features were selected in 5% of the nodes (cf. Figure 9). In this case, no distinction is made as for the depth at which a given feature was selected. Context-rich features exhibit high variability (900 of them are randomly sampled at every node). This variability combined with their ability to highlight regions which differ from their neighborhood explains why they were chosen. Together with local features, context-rich features learn a multichannel appearance model conditioned by tissue spatial priors. Symmetry features are under-represented in the forest and thus prove to be the least discriminative ones. This is due to the fact that a large proportion of periventricular MS lesions tend to develop in a symmetric way. Nevertheless, symmetric features appear in top levels of the tree (up to third level) which indicates that they provide an alternative to local and context-rich features when these two fail. A finer estimation of the feature importance consists in weighting the counting process. For a given feature, instead of only counting the nodes in which it appears, we also take into account the proportion of lesion voxels it helps discriminating: “the larger the proportion of lesion voxels it helps to 33
discriminate, the larger the weight of the feature”. This leads us to define for a fixed depth value d, the importance of a given feature type, denoted (IF T ), as: IF T (α) =
1 X 1 |T | · χα (θp ) α ∈ {loc, cont, sym} |T 1 | p p
(11)
where α denotes a feature type, p indices the nodes in layer d, T 1 is the training set of lesion voxels which partition Tp1 reached node p, and χ is the indicator function such that:
1, χα (θp ) = 0,
if θp is of type α otherwise
(12)
The feature importance evaluates to 21.1 % for local features, 76.6 % for context-rich features and 2.3 % for symmetry features. Results are comparable to those obtained only by counting the features in the forest, but the real advantage of this measure is to allow us to draw depth-by-depth feature importance analysis in a normalized way. The feature importance as a function of the depth of the tree is reported in Figure 10. Presented results are averaged values over a forest containing T = 30 trees. Again, we observe that context-rich features are predominantly selected as the most discriminative, which confirms the trend reported in Figure 9. However, as shown in Figure 10, the preponderance of context-rich features is not uniform throughout the tree. Indeed, local features are the most discriminative in layers 0 and 2. A careful analysis of selected channels helps understanding why local features are selected in the top layers of the tree (cf. Section 5.4.2). The selected context-rich features show high variability. More specifically, 34
the long-range regions are distributed all over the neighborhood. Depthby-depth analysis does not show any specific pattern in the position of the regions with respect to the origin voxel. In addition, the volume of the regions also show high variability. The observed heterogeneity of selected contextrich features aims at coping with the variability of MS lesions (shape, location and size). The symmetry feature is under-represented in the forest. Its discriminative power is thus very low compared to local and context-rich features. This observation induces two complementary interpretations to explain why symmetry features are the least significant: 1) most of MS lesions appear in peri-ventricular regions and in a symmetric way, 2) most of MS lesions can be clearly identified by their signature across MR sequences and their relative position in the white matter of the brain. However, in deeper layers of the trees, the symmetry feature is more significant and tends to classify ambiguous asymmetrical regions. When looking into the selected features, we also notice that the hard symmetric constraint is preferred over the loose symmetric constrain (cf. Section 3.2). Indeed, the feature importance evaluates to 1.6% for the hard symmetric feature, and to 0.7% for the loose symmetric feature. Moreover, in the rare cases where the loose constrain is selected, the 6-neighbors version predominates (cf. Section 3.2). This observation supports the idea that considering brain hemispheres as symmetric is an accurate approximation in our specific setting (cf. Sections 2 and 3). 5.4.2. Most discriminative channels The second approach focuses on the depth at which a given feature was selected. For every tree in the forest, the root node always applies a test on 35
Figure 9: Ranking features according to the proportion of nodes in which they appear. Context-rich features are selected in 71% of the nodes, local features are selected in 24% of the nodes whereas symmetry features are selected in 5% of the nodes.
the FLAIR sequence (θFlocLAIR ). It means that out of all available features, containing local, context-rich and symmetry multi-channel features, θFlocLAIR was found to be the most discriminative. At the second level of the tree, cont a context-rich feature on spatial priors (θW M,GM ) appears to be the most
discriminative over all trees in the forest. It aims at discarding all voxels which do not belong to the white matter. The optimal decision sequence found while training the context-rich forest can thus be thought as a threshold on the FLAIR MR sequence followed by an intersection with the white matter mask (cf. Figure 11). Interestingly, this sequence matches the first and second steps of the pipeline proposed by the challenge winner method (Souplet et al., 2008). Note that in our case, it is automatically generated during the training process. Deeper layers in the trees, then, refine the segmentation of MS lesions by applying more accurate decisions. 36
Figure 10: Type of feature selected by layer of the tree. For a fixed depth, the red circle stands for the importance of the context-rich feature (θcont ), while the green circle stands for the importance of the local feature (θloc ). For clarity, symmetry features (θsym ) are omitted as they are under-represented in the forest. The blue line monitors the proportion of training samples of the lesion class which do not reside in leaf nodes, for each layer of the tree. We observe that context-rich features are predominantly selected as the most discriminative ones except in layers 0 and 2.
37
Figure 11: Combination of features and channels learned by the forest to discriminate MS lesions. The first layer of all trees in the forest performs a threshold on the FLAIR MR sequence. The second one discards all voxels which do not belong to the white matter. The posterior map is obtained by using a forest with trees of depth 2 and thus highlights hyper-intense FLAIR voxels which lie in peri-ventricular regions.
The feature importance (cf. Equation 11) can be extended in a straightforward way to be parametrized not only by the type of feature (local, context-rich, symmetric) but also by the channel. When globally looking at the selected channels (cf. Figure 12), we notice that their importance varies throughout the tree: first layers, as mentioned before, favor detection of bright spots in the white matter by successively testing the FLAIR MR sequence, spatial priors on WM and GM tissues and finally testing on the T2 MR sequence; deeper layers take into account other modalities to adjust the segmentation. 6. Conclusion We demonstrated the power of the RF formulation applied to the difficult task of MS lesion segmentation in multi-channel MR images. We presented 38
Figure 12: Channel importance as a function of the depth of the tree. Plots draw the channel importance drawn as a function of the depth of the tree for both local (top) and long-range features (bottom). For a fixed depth, only the most discriminative channel is depicted. Note how successive layers of the tree test complementary channels: the first layer performs a local test on the FLAIR MR sequence in order to detect bright spots, the second one discards all voxels which do not belong to the white matter by using context-rich information over the WM and GM channels. Note that a large spectrum of available channels is tested throughout the tree.
39
three kinds of 3D features based on multi-channel intensity, prior and contextrich information. Those features are part of a context-rich random decision forest classifier which demonstrated improved results on one of the state of the art algorithms on the public MS challenge dataset. In addition, the random decision forest framework provided a means to automatically select the most discriminative features to achieve the best possible segmentation. Future work could include the use of more sophisticated features to reduce even further the preprocessing requirements. The context-rich random forest framework presented in this article is generic which is an additional strength of the method. It can be applied as is to any other segmentation task, e.g. brain tumors segmentation in multi-sequence MR images of the brain. Finally, one could investigate an extension of the proposed approach to larger multi-class problems in order to try to simultaneously segment brain tissues (WM, GM, CSF) along with MS lesions.
40
References Admiraal-Behloul, F., van den Heuvel, D., Olofsen, H., van Osch, M., van der Grond, J., van Buchem, M., Reiber, J., 2005. Fully automatic segmentation of white matter hyperintensities in mr images of the elderly. NeuroImage 28 (3), 607 – 617. Akselrod-Ballin, A., Galun, M., Basri, R., Brandt, A., Gomori, M. J., Filippi, M., Valsasina, P., 2006. An integrated segmentation and classification approach applied to multiple sclerosis analysis. In: CVPR ’06: IEEE. pp. 1122–1129. Amit, Y., Geman, D., 1997. Shape quantization and recognition with randomized trees. Neural Computation 9 (7), 1545–1588. Anbeek, P., Vincken, K., van Osch, M., Bisschops, R., van der Grond, J., March 2004. Probabilistic Segmentation of White Matter Lesions in MR Imaging. NeuroImage 21 (3), 1037–1044. Anbeek, P., Vincken, K., Viergever, M., 2008. Automated MS-lesion segmentation by K-Nearest neighbor classification. In: The MIDAS Journal - MS Lesion Segmentation (MICCAI 2008 Workshop). Andres, B., K¨othe, U., Helmstaedter, M., Denk, W., Hamprecht, F. A., 2008. Segmentation of SBFSEM volume data of neural tissue by hierarchical classification. In: DAGM-Symposium. pp. 142–152. Bernhard Schlkopf, C. J. B., Smola, A. J., 1999. Advances in Kernel Methods: Support Vector Learning. MIT Press, Cambridge, MA. 41
Bishop, C., 2006. Pattern Recognition and Machine Learning. Springer. Breiman, L., 2001. Random forests. Machine Learning 45 (1), 5–32. Breiman, L., Friedman, J. H., Olshen, R. A., J., S. C., 1984. Classification and Regression Trees. Wadsworth Press. Bricq, S., Collet, C., Armspach, J.-P., september 2008a. Ms lesion segmentation based on hidden markov chains. In: 11 th International conference on medical image computing and computer assisted intervention. Paper selected for ?a grand challenge : 3D segmentation in the clinic”. MICCAI, new-York September 6-10,. Bricq, S., Collet, C., Armspach, J.-P., december 2008b. Unifying framework for multimodal brain mri segmentation based on hidden markov chains. Medical Image Analysis 12 (6), 639–652. Criminisi, A., Shotton, J., , Bucciarelli, S., 2009. Decision forests with longrange spatial context for organ localization in CT volumes. In: MICCAI workshop on Probabilistic Models for Medical Image Analysis (MICCAIPMMIA). Criminisi, A., Shotton, J., Robertson, D., Konukoglu, E., 2010. Regression forests for efficient anatomy detection and localization in CT studies. In: MICCAI workshop on Medical Computer Vision: Recognition Techniques and Applications in Medical Imaging (MICCAI-MCV). Datta, S., Sajja, B. R., He, R., Wolinsky, J. S., Gupta, R. K., Narayana, P. A., 2006. Segmentation and quantification of black holes in multiple sclerosis. NeuroImage 29 (2), 467 – 474. 42
´ G., Malandain, G., Ayache, N., Lebrun, Dugas-Phocion, G., Ballester, M. A. C., Chanalet, S., Bensa, C., 2004. Hierarchical segmentation of multiple sclerosis lesions in multi-sequence MRI. In: ISBI. IEEE, pp. 157–160. Evans, A. C., Collins, D. L., Mills, S. R., Brown, E. D., Kelly, R. L., Peters, T. M., 1993. 3D statistical neuroanatomical models from 305 MRI volumes. In: IEEE-Nuclear Science Symposium and Medical Imaging Conference. pp. 1813–1817. Freifeld, O., Greenspan, H., Goldberger, J., 2009. Multiple sclerosis lesion detection using constrained GMM and curve evolution. J. of Biomed. Imaging 2009, 1–13. Geurts, J. J., Barkhof, F., September 2008. Grey matter pathology in multiple sclerosis. Lancet neurology 7 (9), 841–851. INRIA, 2010. MedINRIA. URL www-sop.inria.fr/asclepios/software/MedINRIA/index.php Lempitsky, V. S., Verhoek, M., Noble, J. A., Blake, A., 2009. Random forest classification for automatic delineation of myocardium in real-time 3D echocardiography. In: FIMH. LNCS 5528. Springer, pp. 447–456. Menze, B. H., Kelm, B. M., Masuch, R., Himmelreich, U., Petrich, W., Hamprecht, F. A., 2009. A comparison of random forest and its Gini importance with standard chemometric methods for the feature selection and classification of spectral data. BMC Bioinformatics 10, 213. Prima, S., Ayache, N., Barrick, T., Roberts, N., 2001. Maximum likelihood estimation of the bias field in MR brain images: Investigating different 43
modelings of the imaging process. In: MICCAI. LNCS 2208. Springer, pp. 811–819. Prima, S., Ourselin, S., Ayache, N., 2002. Computation of the mid-sagittal plane in 3d brain images. IEEE Trans. Med. Imaging 21 (2), 122–138. Quinlan, J. R., 1993. C4.5: Programs for Machine Learning. Morgan Kaufmann. Rey, D., October 2002. D´etection et quantification de processus ´evolutifs dans des images m´edicales tridimensionnelles : application `a la scl´erose en plaques. Th`ese de sciences, Universit´e de Nice Sophia-Antipolis, (in French). Shiee, N., Bazin, P., Pham, D., 2008. Multiple sclerosis lesion segmentation using statistical and topological atlases. In: The MIDAS Journal - MS Lesion Segmentation (MICCAI 2008 Workshop). Shiee, N., Bazin, P.-L., Ozturk, A., Reich, D. S., Calabresi, P. A., Pham, D. L., 2010. A topology-preserving approach to the segmentation of brain images with multiple sclerosis lesions. NeuroImage 49 (2), 1524 – 1535. Shotton, J., Winn, J. M., Rother, C., Criminisi, A., 2009. Textonboost for image understanding: Multi-class object recognition and segmentation by jointly modeling texture, layout, and context. Int. J. Comp. Vision 81 (1), 2–23. Souplet, J.-C., Lebrun, C., Ayache, N., Malandain, G., 2008. An automatic segmentation of T2-FLAIR multiple sclerosis lesions. In: The MIDAS Journal - MS Lesion Segmentation (MICCAI 2008 Workshop). 44
Styner, M., Lee, J., Chin, B., Chin, M., Commowick, O., Tran, H., MarkovicPlese, S., Jewells, V., Warfield, S., Sep 2008a. 3D segmentation in the clinic: A grand challenge II: MS lesion segmentation. In: MIDAS Journal. pp. 1–5. Styner, M., Warfield, S., Niessen, W., van Walsum, T., Metz, C., Schaap, M., Deng, X., Heimann, T., van Ginneken, B., 2008b. MS lesion segmentation challenge 2008. URL http://www.ia.unc.edu/MSseg/index.php Van Leemput, K., Maes, F., Vandermeulen, D., Colchester, A. C. F., Suetens, P., 2001. Automated segmentation of multiple sclerosis lesions by model outlier detection. IEEE Trans. Med. Imaging 20 (8), 677–688. Wu, Y., Warfield, S., Tan, I., III, W. W., Meier, D., van Schijndel, R., Barkhof, F., Guttmann, C., 09 2006. Automated segmentation of multiple sclerosis lesion subtypes with multichannel mri. Neuroimage 32 (3), 1205– 1215. Yamamoto, D., Arimura, H., Kakeda, S., Magome, T., Yamashita, Y., Toyofuku, F., Ohki, M., Higashida, Y., Korogi, Y., 2010. Computer-aided detection of multiple sclerosis lesions in brain magnetic resonance images: False positive reduction scheme consisted of rule-based, level set method, and support vector machine. Computerized Medical Imaging and Graphics 34 (5), 404 – 413. Yi, Z., Criminisi, A., Shotton, J., Blake, A., 2009. Discriminative, semantic
45
segmentation of brain tissue in MR images. LNCS 5762. Springer, pp. 558–565. Yin, P., Criminisi, A., Winn, J., Essa, I., 2010. Bilayer segmentation of webcam videos using tree-based classifiers. Trans. Pattern Analysis and Machine Intelligence (PAMI) 33.
46