Howard Zhouâ , Mei Chenâ¡, Le Zouâ¡, Richard Gassâ¡, Laura Ferris§, Laura Drogowski§, James M. Rehgâ . â Georgia ..... (g) Error = 13.61%. (h). (i) Error ... [1] D.S. Rigel, R.J. Friedman, and A.W. Kopf, âThe incidence of malignant melanoma.
SPATIALLY CONSTRAINED SEGMENTATION OF DERMOSCOPY IMAGES Howard Zhou† , Mei Chen‡ , Le Zou‡ , Richard Gass‡ , Laura Ferris§ , Laura Drogowski§ , James M. Rehg† †
Georgia Institute of Technology,
‡
Intel Research Pittsburgh,
ABSTRACT Dermoscopy is a technique used to better visualize pigmented skin lesion and aid the clinician in determining if a lesion is benign or malignant. Automated segmentation of dermoscopy images is an important step for computer-aided diagnosis of melanoma. In this paper, we investigate how to use the spatial constraints present in pigmented lesions to improve the segmentation of dermoscopy images. We present an unsupervised segmentation algorithm that embeds these constraints into the feature space. The algorithm groups image pixels with homogeneous properties, and merges the pixel groups into a few super-regions. The optimal lesionskin boundary is chosen from the set of all region boundaries, where the optimality is determined from the color and texture properties of the regions. We test our method on 67 dermoscopy images and compare the automatically generated segmentation with dermatologist-determined segmentation. The results demonstrate the advantage of incorporating domain-specific constraints into the segmentation process. Index Terms— Computer-Assisted Image Interpretation, Dermoscopy, Segmentation, Pigmented Skin Lesion, Coordinate system, 1. INTRODUCTION Skin cancer is the most common form of malignancy in humans, and melanoma is the leading cause of mortality among all forms of skin cancer. The incidence of melanoma is increasing at a rate greater than any other form of cancer in the United States [1]. However, if caught in early stage, melanoma can often be cured with a simple excision. Therefore, early detection of malignant melanoma significantly reduces mortality. Dermoscopy is a noninvasive imaging technique that has been shown to be effective for such a purpose. The procedure requires an incident light magnification system and a liquid contact medium applied at the skin-microscope interface. This allows the incident light to penetrate the top layer of the skin tissue and permits a detailed examination of the pigmented structures beyond what would be visible to the naked eye. Studies have shown that dermoscopy can improve the diagnostic accuracy of dermatologists by as much as 30% over clinical examination [1]. This improvement in diagnostic accuracy, however, is seen primarily when dermoscopy is used by a trained expert, or
§
University of Pittsburgh
when the user applies specific diagnostic algorithms that are often not practical in the clinical setting. Based on this, there has been increasing interest in computer aided analysis of dermoscopy images. The first step of such analysis is the segmentation of pigmented lesions from the surrounding skin. The resulting border structure not only provides a basis for calculation of important clinical features such as lesion size and border irregularity, but it is also crucial for extraction of discriminating dermoscopic features such as atypical pigment networks and radial streaming. A number of algorithms have been developed for automated segmentation of pigmented skin lesions. Many had roots in image processing and computer vision techniques such as the PDE approach [2], histogram thresholding [3], clustering [4], and statistical region merging [5]. Researchers have also explored different color spaces, e.g., RGB, HSI, CIELUV [4], and CIELAB to improve segmentation performance. However, due to the large variability in lesion properties and skin conditions, along with the presence of artifacts such as hair and air bubbles, automated segmentation of pigmented lesions in dermoscopy images remains a challenge. Due to space limit, we refer readers to [5] for an extensive list of border detection algorithms. In this paper, we focus on the spatial constraints universally present in dermoscopy images, which arise from the growth pattern of pigmented lesions. We show that by embedding such domain knowledge into the feature space, the performance of automated segmentation algorithms can be improved. Our algorithm starts with a two-stage clustering and region merge process. Once homogeneous regions are identified, it determines an optimal boundary based on a measure that integrates both color and texture properties. We test our method on 67 dermoscopy images. The automatically generated borders are compared with those determined by an experienced dermatologist. The results demonstrate that segmentation performance is improved by incorporating these spatial constraints. 2. SPATIAL REPRESENTATION OF LESIONS 2.1. The growth pattern of pigmented lesions Melanoma arises from pigmented skin cells (melanocytes) and is commonly identified with two growth phases, radial and vertical. In the radial growth phase, both melanoma and
benign pigmented lesions appear as plaques. Lesions increase in depth and carry a less favorable prognosis when they enter the vertical growth phase (see Fig. 1(a)). Since skin absorbs and scatters light, the appearance of melanocytes varies with depth. As a result, melanocytes are dark brown within the epidermis, tan at or near the dermoepidermal junction, and blue-gray in the dermis. This gives pigmented lesions a common radiating growth pattern seen from skin surface. That is in general, the difference in lesion appearance is more significant along the radial direction from the lesion center than any other direction, as shown in Fig. 1(b). Notice that the skin patch in the cyan square bears more resemblance to the patch in the red square than the yellow one, even though the yellow square is much closer to the cyan square.
(a) Melanoma growth.
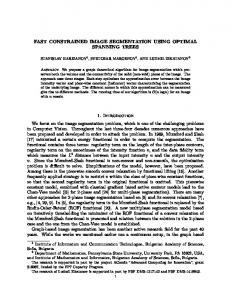
a filtered image by substituting the RGB values of each pixel with its cluster mean. The mean per-pixel residue between each original and filtered pair is then calculated. We apply this operation on our dermoscopy dataset (Derm), which consists of 216 lesion images, as well as on the Berkeley natural image dataset (BSD) [8], which has 300 images of randomly selected natural scenes Fig. 2 shows that for Dermoscopy images in Derm, the mean residue is reduced by 18% switching from Cartesian to polar coordinates. In contrast, the difference is much less for the natural images in BSD. Moreover, in the Derm data, all but two data points have smaller residue error under polar system, whereas for the BSD, the data points are being spread more uniformly across the equal performance line. We will describe our segmentation algorithm in the next section and demonstrate how the embedding of spatial constraints improves segmentation performance.
(b) Radiating pattern.
Fig. 1. The growth pattern of pigmented skin lesion (a) and its radiating appearance (b) (Image courtesy of Med-Art).
2.2. Using polar radius Many algorithms enforce explicit spatial constraints to simplify the figure/ground label assignment. Melli et al. [6] assume that the pixels at the four corners of an image belong to skin. Celebi et al. [5] discard the rectangular regions touching the image frame. Moreover, some methods such as the meanshift algorithm implicitly enforces local neighborhood constraints on image Cartesian coordinates during pixel grouping. However, because pigmented lesions have a radiating appearance, direct embedding of Cartesian coordinates may not be optimal. For example, in Cartesian coordinates, the red square in Fig. 1(b) is farther away from the cyan square than the yellow one. Consequently, it is less likely to be grouped together with the cyan square, even though their underlying melanocytes are probably in the same growth period. Given the fact that dermatologists tend to put the lesion near the center of image frame while acquiring dermoscopy images, we can better capture the radial growth pattern by replacing the x, y coordinates with a polar radius r measured from the image center. We verify this by comparing the clustering residue errors using both coordinate systems. The feature space includes the coordinates of each pixel, (x, y) in Cartesian and r in polar, and its RGB values. We apply k-means [7] clustering on both representations of the image. After clustering, we generate
Fig. 2. Mean per-pixel residue comparison between polar and Cartesian representation on the Derm dataset (left) and BSD dataset (right).
3. SEGMENTATION ALGORITHM Our algorithm identifies large regions with homogeneous properties (super-regions) through a two-stage clustering. The lesion-skin boundary is then chosen as the optimal boundary among all possible boundaries of these regions. We use a measure that integrates both color and texture properties to determine the optimum. 3.1. Two-stage Clustering The first clustering stage serves two purposes. First, it removes small variations in appearance due to noise. Second, it groups pixels into homogenous regions; the color and location values of each pixel are replaced with the average values of the region to which they belong. The regions resulting from this operation give us a more compact representation of the original image. We use the k-means++ algorithm [7]. It is a variation of the k-means algorithm that improves both speed and accuracy by using a randomized seeding technique. The input to k-means++ is all the image pixels represented as
points in R4 , where the coordinates of each point encodes the color and location of the corresponding pixel. We convert the pixels from RGB to L*a*b* values because the CIELAB space is more perceptually uniform. The fourth coordinate is the polar radius measured from the image center encoding the location of each pixel. We normalize this coordinate with a constant w to make the polar radius commensurate with the L*a*b* color values. We chose the number of clusters k as 30 such that the clusters are able to represent the image compactly without incurring large residue errors [6]. This first round of clustering serves the same noisereducing purpose as the median filtering used in [4] and [5], but avoids boundary localization errors introduced by the smoothing process. Figs. 4(a) and 4(b) show the original and the filtered images after clustering, respectively. For comparison purposes, we perform the same clustering procedure on points represented by their L*a*b* values and Cartesian coordinates. As shown in Fig. 4(c), the regions appear more blocky when the clustering is performed in Cartesian space. This unnatural appearance is not present when polar radius is used (Fig. 4(b)). After the first stage of clustering, the mean values of the clusters are fed into the next round of k-means++ clustering to produce super-regions, as defined previously. We choose the number of clusters k by satisfying the following two requirements. First, it must account for intra-skin and intralesion variations. For example, the appearance of the lesion in Fig. 4(a) varies significantly across lesion, and an attempt to produce a single lesion cluster is unlikely to succeed. Second, we want to avoid a value that is too large making the subsequent combinatoric region merge (see next section) intractable. Based on our experiments and previous studies [6], we set k to 6, which produces satisfactory results. As shown in Figs. 4(d), 4(h), 4(f), and 4(j), the super-regions do correspond to meaningful regions such as skin, skin-lesion transition, and inner lesion. 3.2. Color and texture cue integration After the super-regions are identified, we apply a region merge procedure to produce a plausible lesion segmentation. However, for many cases merging based on color cues alone is insufficient. For instance, on severely sun damaged skin (Fig. 4(i)), texture variations are often more informative than color. Moreover, many lesions exhibit texture variations at boundaries in addition to color variations. For these cases, incorporating texture information can improve segmentation performance. In order to measure the amount of texture variations across regions, we apply the texture gradient filter (TG) [8] to the original dermoscopy images. The resulting images are pseudo-likelihood maps, which contain the information of how likely an edge caused by texture variation is at a certain location. By considering both the super-regions and the likeli-
hood map, we determine the optimal skin-lesion boundary as follows. We uniformly sample the original values of the pixels within each super-region and compute an Earth Mover’s Distance (EMD) [9] between every pair of super-regions. For a particular lesion Ω the optimal skin-lesion boundary δΩ is the curve that separates the set of super-regions inside ˆ is found by minimizing the Ω from the rest. The optimal Ω integrated color-texture measure as follows: ˆ = arg min ( 1 Ω K Ω
X ∀Sk ,Sl ∈Ω
Ck,l +
1 M
X
Cm,n − λTδΩ ),
∀Sm ,Sn ∈Ω /
where Si and Sj (i, j = k, l, m, n ∈ {1, 2, . . . , 6}) are a pair of super-regions, Ci,j is the EMD between them, K, M normalize the sums, and T is the normalized texture gradient on the lesion boundary δΩ. λ is a constant that can be adjusted to put emphasis on either color or texture. 4. VALIDATION AND RESULTS We have our collaborating dermatologist manually outline the lesions in 67 dermoscopy images, and treat that as groundtruth. We compare them to the automatically generated borders using the grading system in [5]. The border error is given by error =
Area(computer XOR ground-truth) × 100%, Area(ground-truth)
where computer is the binary image obtained by filling the automatic detected border and ground-truth is obtained by filling in the boundaries outlined by our dermatologist. Fig. 3 shows a performance comparison using this error measure. We can see that while both colorspace conversion (from RGB to L*a*b*) and color-texture integration improved segmentation accuracy, the biggest boost came from embedding the spatial constraints during clustering. Typical segmentation results are shown in Fig. 4(d) - 4(k). The first image of each pair shows the super-regions while the second one shows the lesions. Both the computer generated borders (in blue) and the dermatologist’s (in white) are overlayed on top of the original images for comparison purposes. 5. CONCLUSION In this paper, we show that the growth pattern of pigmented skin lesions can be utilized to improve lesion segmentation accuracy in dermoscopy images. We present an unsupervised segmentation algorithm incorporating these spatial constraints, and we demonstrate its efficacy by comparing the segmentation results to ground-truth segmentations determined by an expert.
(a) Error = 12.96%
(b)
(c)
(d)
(e) Error = 5.80%
(f)
(g) Error = 13.61%
(h)
(i) Error = 16.60%
(j)
(k) Error = 34.09%
Fig. 4. Segmentation results. (a) Original dermoscopy image. (b) Image filtered using polar radius (k = 30, w = 0.11). (c) Image filtered using Cartesian coordinates (k = 30, w = 0.08). (d)-(k) Typical segmentation results. The boundaries in blue are generated by our algorithm, and those in white are from the dermatologist.
sion boundary detection in dermoscopy images using gradient vector flow snakes,” Skin Research and Technology, vol. 11, pp. 17–26, 2005. [3] M. Hintz-Madsen, L. K. Hansen, J. Larsen, and K. Drzewiecki, “A probabilistic neural network framework for detection of malignant melanoma,” in Artificial Neural Networks in Cancer Diagnosis, Prognosis and Patient Management, pp. 141–183. 2001. [4] P. Schmid, “Segmentation of digitized dermatoscopic images by two-dimensional color clustering,” IEEE Trans. Medical Imaging, vol. 18, pp. 164–171, 1999. [5] M.E. Celebi, H.A. Kingravi, H. Iyatomi, J. Lee, Y.A. Aslandogan, W.V. Stoecker, R. Moss, J.M. Malters, and A.A. Marghoob, “Fast and accurate border detection in dermoscopy images using statistical region merging,” in SPIE Medical Imaging, 2007.
Fig. 3. Comparison of results.
[6] R. Melli, C. Grana, and R. Cucchiara, “Comparison of color clustering algorithms for segmentation of dermatological images,” in SPIE Medical Imaging, 2006. [7] D. Arthur and S. Vassilvitskii, “k-means++: the advantages of careful seeding,” in SODA, 2007, pp. 1027–1035.
6. REFERENCES [1] D.S. Rigel, R.J. Friedman, and A.W. Kopf, “The incidence of malignant melanoma in the united states: Issues as we approach the 21st century,” J Am Acad Dermatol., vol. 34, pp. 839–847, 1996. [2] B. Erkol, R.H. Moss, R.J. Stanley, W.V. Stoecker, and E. Hvatum, “Automatic le-
[8] D.R. Martin, C.C. Fowlkes, and J. Malik, “Learning to detect natural image boundaries using local brightness, color, and texture cues,” IEEE PAMI, vol. 26, pp. 530–549, 2004. [9] Y. Rubner, C. Tomasi, and L.J. Guibas, “A metric for distributions with applications to image databases,” in ICCV, 1998, p. 59.