find that ii the probability distributions of the average mutual information I¯ are significantly different ..... 4 R. Guigo, S. Knudsen, N. Drake, and T. F. Smith, J. Mol.
PHYSICAL REVIEW E
VOLUME 61, NUMBER 5
MAY 2000
Species independence of mutual information in coding and noncoding DNA Ivo Grosse,1 Hanspeter Herzel,2 Sergey V. Buldyrev,1 and H. Eugene Stanley1 1
Center for Polymer Studies and Department of Physics, Boston University, Boston, Massachusetts 02215 2 Institute for Theoretical Biology, Humboldt University, Invalidenstrasse, 43, 10115 Berlin, Germany 共Received 29 October 1999兲
We explore if there exist universal statistical patterns that are different in coding and noncoding DNA and can be found in all living organisms, regardless of their phylogenetic origin. We find that 共i兲 the mutual information function I has a significantly different functional form in coding and noncoding DNA. We further find that 共ii兲 the probability distributions of the average mutual information ¯I are significantly different in coding and noncoding DNA, while 共iii兲 they are almost the same for organisms of all taxonomic classes. Surprisingly, we find that ¯I is capable of predicting coding regions as accurately as organism-specific coding measures. PACS number共s兲: 87.10.⫹e, 02.50.⫺r, 05.40.⫺a
I. INTRODUCTION
H关 X 兴 ⬅⫺k B
DNA carries the genetic information of most living organisms, and the goal of genome projects is to uncover that genetic information. Hence, genomes of many different species, ranging from simple bacteria to complex vertebrates, are currently being sequenced. As automated sequencing techniques have started to produce a rapidly growing amount of raw DNA sequences, the extraction of information from these sequences becomes a scientific challenge. A large fraction of an organism’s DNA is not used for encoding proteins 关1兴. Hence, one basic task in the analysis of DNA sequences is the identification of coding regions. Since biochemical techniques alone are not sufficient for identifying all coding regions in every genome, researchers from many fields have been attempting to find statistical patterns that are different in coding and noncoding DNA 关2–6兴. Such patterns have been found, but none seems to be species independent. Hence, traditional coding measures 关7兴 based on these patterns need to be trained on organism-specific data sets before they can be applied to identify coding DNA. This trainingset dependence limits the applicability of traditional coding measures, as many new genomes are currently being sequenced for which training sets do not exist.
H关 Y 兴 ⬅⫺k B
兺i p i ln p i ,
兺j q j ln q j ,
H关 X,Y 兴 ⬅⫺k B
and
P i j ln P i j , 兺 i, j
where k B denotes the Boltzmann constant. If X and Y are statistically independent, then H关 X 兴 ⫹H关 Y 兴 ⫽H关 X,Y 兴 , which states that the Boltzmann entropy is extensive. If X and Y are statistically dependent, then the sum of the entro-
II. MUTUAL INFORMATION FUNCTION
In search for species-independent statistical patterns that are different in coding and noncoding DNA, we study the mutual information function I(k), which quantifies the amount of information 共in units of bits兲 that can be obtained from one nucleotide X about another nucleotide Y that is located k nucleotides downstream from X 关8兴. Within the framework of statistical mechanics I can be interpreted as follows. Consider a compound system 共X,Y兲 consisting of the two subsystems X and Y. Let p i denote the probability of finding system X in state i, let q j denote the probability of finding system Y in state j, and let P i j denote the joint probability of finding the compound system 共X,Y兲 in state 共i,j兲. Then the entropies of the systems X,Y, and 共X,Y兲 are defined by 1063-651X/2000/61共5兲/5624共6兲/$15.00
PRE 61
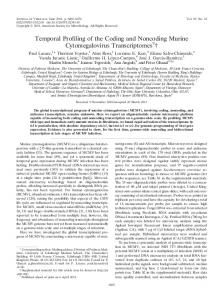
FIG. 1. Mutual information function, I(k), of human coding 共thin line兲 and noncoding 共thick line兲 DNA, from GenBank release 111 共Ref. 关10兴兲. We cut all human, non-mitochondrial DNA sequences into non-overlapping fragments of length 500 bp, starting at the 5 ⬘ -end. We compute the mutual information function of each fragment, correct for the finite length effect 共Ref. 关13兴兲, and display the average over all mutual information functions 共of coding and noncoding DNA separately兲. We find that for noncoding DNA I(k) decays to zero as k increases, while for coding DNA I(k) shows persistent period-3 oscillations. 5624
©2000 The American Physical Society
PRE 61
SPECIES INDEPENDENCE OF MUTUAL INFORMATION . . .
pies of the subsystems X and Y is strictly greater 关9兴 than the entropy of the compound system (X,Y ), i.e., H关 X 兴 ⫹H关 Y 兴 ⬎H关 X,Y 兴 . The mutual information I关 X,Y 兴 is defined as the difference of the sum of the entropies of the subsystems and the entropy of the compound system,
If k B is replaced by 1/ln 2, then I关 X,Y 兴 quantifies the amount of information in X about Y in units of bits 关9兴. Two obvious but noteworthy properties of I关 X,Y 兴 are 共i兲 I关 X,Y 兴 ⫽I关 Y ,X 兴 , so the amount of information in X about Y is equal to the amount of information in Y about X, and 共ii兲 I关 X,Y 兴 ⭓0, so the amount of information is always nonnegative, and it is equal to zero if and only if X and Y are statistically independent. We choose P i j (k) to denote the joint probability of finding the pair of nucleotides n i and n j (n i ,n j 苸 兵 A,C,G,T 其 ) spaced by a gap of k⫺1 nucleotides, and we define p i ⬅ 兺 j P i j (k) and q j ⬅ 兺 i P i j (k). Then 4
兺 P i j 共 k 兲 log2 i, j⫽1
P i j共 k 兲 p iq j
values, the in-frame mutual information Iin at distances k that are multiples of 3 and the out-of-frame mutual information Iout at all other values of k. III. AVERAGE MUTUAL INFORMATION
I关 X,Y 兴 ⬅H关 X 兴 ⫹H关 Y 兴 ⫺H关 X,Y 兴 .
I共 k 兲 ⬅
5625
共1兲
quantifies the degree of statistical dependence between the nucleotides X and Y spaced by a gap of k⫺1 nucleotides, and we study I as a function of k for coding and noncoding DNA of all eukaryotic organisms available in GenBank release 111 关10兴. Figure 1 shows I(k) for human coding and noncoding DNA. We observe that for noncoding DNA I(k) decays to zero, whereas for coding DNA I(k) oscillates between two
The oscillatory behavior of I(k) in coding DNA is a consequence of the presence of the genetic code 关which maps nonoverlapping nucleotide triplets 共codons兲 to amino acids兴 and the nonuniformity of the codon frequency distribution. The fact that the codon frequencies are nonuniformly distributed in almost all organisms is well known to biologists, and arises because 共i兲 the frequency distribution of amino acids is non-uniform, 共ii兲 the number of synonymous codons 关11兴 that encode one amino acid varies from 1 to 6, and 共iii兲 the frequency distribution of synonymous codons is nonuniform 关12兴. A simple model that incorporates the nonuniformity of the codon frequency distribution, but neglects any other correlation, is the pseudo-exon model 关13兴, which concatenates codons randomly chosen from a given probability distribution (Q AAA ,...,Q TTT ), where Q XY Z denotes the probability of codon XYZ (X,Y ,Z苸 兵 A,C,G,T 其 ). As the pseudo-exon model has been shown to reproduce the period-3 oscillations in genomic DNA 关13兴, we use the model assumption of neglecting weak correlations between codons in order to express the joint probabilities P i j (k) in terms of the 12 posi关14兴 of finding nucleotide tional nucleotide probabilities p (m) i n i at position m苸 兵 1,2,3 其 in an arbitrarily chosen reading frame 关15兴 as follows 关3,13兴:
再
p 共i 1 兲 p 共j 1 兲 ⫹ p 共i 2 兲 p 共j 2 兲 ⫹ p 共i 3 兲 p 共j 3 兲 , for k⫽3,6,9, . . . 1 共1兲 共2兲 共2兲 共3兲 共3兲 共1兲 P i j 共 k 兲 ⫽ • p i p j ⫹ p i p j ⫹ p i p j , for k⫽4,7,10, . . . . 3 p 共i 1 兲 p 共j 3 兲 ⫹ p 共i 2 兲 p 共j 1 兲 ⫹ p 共i 3 兲 p 共j 2 兲 , for k⫽5,8,11, . . .
It is clear that P i j (k) is invariant under shifts of the reading frame, because the expressions on the rhs of Eq. 共2兲 are invariant under cyclic permutations of the upper indices 共1,2,3兲. Since the second and third line on the rhs of Eq. 共2兲 are identical after transposition of the lower indices (i, j), we obtain P i j (k⫽4,7,10, . . . )⫽ P ji (k⫽5,8,11, . . . ), which implies that I(k) computed from P i j (k) of Eq. 共2兲 will assume only two different values, Iin⫽I(3,6,9, . . . ) and Iout ⫽I(4,5,7,8,10,11, . . . ). In order to construct a coding measure that can predict whether a single sequence is coding or noncoding, we focus on the presence 共absence兲 of the period-3 oscillation in coding 共noncoding兲 DNA, and neglect any other statistical pattern in I(k), such as the decay of I(k) in noncoding DNA and the decay of the envelope of I(k) in coding DNA. Based on Eq. 共2兲, we are able to express, for each single DNA sequence, the maxima and minima of the I(k) oscillations, as follows: we sample from Iin and Iout , in terms of p (m) i each sequence the 12 frequencies p (m) , compute P i j (k) from i p (m) by using Eq. 共2兲, and then compute i
Iin⫽I共 3 兲 and Iout⫽I共 4 兲 ⫽I共 5 兲
共2兲
共3兲
(2) (3) by plugging P i j (k) and p i ⫽q i ⫽(p (1) i ⫹ p i ⫹ p i )/3 into Eq. 共1兲. For the sake of obtaining a simple coding measure with a natural and intuitive interpretation, we compute from Iin and Iout the average mutual information
¯I⬅Pin•Iin⫹Pout•Iout ,
共4兲
where Pin⫽ 31 and Pout⫽ 32 denote the occurrence probabilities of Iin and Iout . The value of ¯I quantifies the average amount 关16兴 of information one obtains about a nucleotide X by learning both the identity of any other nucleotide Y in the same DNA sequence and whether the distance k between X and Y is a multiple of 3. We compute ¯I from each single sequence fragment 关17兴 with the goal to distinguish coding from noncoding DNA. Due to the presence of the genetic code we expect that ¯I will be typically greater in coding than in noncoding DNA.
5626
GROSSE, HERZEL, BULDYREV, AND STANLEY
PRE 61
TABLE I. Means 共variances兲 of log10¯I for coding and noncoding DNA of 6 taxonomic sets. While the means of log10¯I are significantly different in coding and noncoding DNA, they are almost the same for all taxonomic sets. Also the variances of log 10¯I are almost the same for all taxonomic sets, supplementing the visual finding from Fig. 2 that the ¯I-distributions are nearly species independent. Noncoding Primates Nonprimate vertebrates Vertebrates Invertebrates Animals Plants FIG. 2. ¯I distributions of coding DNA 共thin lines兲 and noncoding DNA 共thick lines兲 from all eukaryotic DNA sequences in GenBank release 111 共Ref. 关10兴兲. We cut all DNA sequences into nonoverlapping fragments of length 54 bp 共Ref. 关17兴兲, starting at the 5 ⬘ -end. We compute ¯I of each DNA fragment and show the ¯I histograms for coding and noncoding DNA, for each of the 4 disjoint taxonomic sets 共primates, nonprimate vertebrates, invertebrates, plants兲 separately. We find that 共i兲 for all taxonomic sets ¯ ) is centered at significantly smaller values than c (I ¯ ), while n (I ¯ ) and n (I ¯ ) of different taxonomic sets are almost identi共ii兲 c (I cal. The close similarity of the ¯I distributions for different taxonomic orders, phyla, and kingdoms illustrates the species indepen¯ ) and n (I ¯ ). dence of c (I IV. ACCURACY OF THE AVERAGE MUTUAL INFORMATION
First, we investigate how accurately ¯I can distinguish coding from noncoding DNA. The accuracy A is defined as ¯ ) and n (I ¯ ) the probability density follows: Denote by c (I ¯ functions of I for coding and noncoding DNA 共see Fig. 2兲. ¯ )⬅ 兰 M(I ¯ )dI ¯ , where M(I ¯) Define the overlap integral O(I ¯ ¯ denotes the maximum of the two values c (I) and n (I) at ¯ ) can be expressed as the position ¯I. In statistical terms, O(I ¯ sum of T p and T n , O(I)⫽T p ⫹T n , where T p (T n ) denotes the fraction of true positives 共true negatives兲 over all positives 共all negatives兲 关18兴. Hence, the accuracy, defined by ¯ )⬅O(I ¯ )/2, ranges from from 21 共no discrimination兲 to 1 A(I 共perfect discrimination兲 关19兴. We use the standard data set and benchmark test from Ref. 关5兴 and compare the accuracy of ¯I to the accuracy of all of the 21 coding measures evaluated in Ref. 关5兴. We find that ¯ )⫽0.69, 0.76, 0.81 for human DNA the accuracy of ¯I 关A(I sequences of lengths N⫽54, 108, 162 bp兴 is higher than the accuracy of many of the 21 traditional coding measures ¯ ) is comparable to the accufrom Ref. 关5兴. In particular, A(I racy of the hexamer measure H, 关 A(H) ⫽0.70, 0.73, 0.74兴 , which is the most accurate of the 21 frame-independent 关15兴 coding measures from Ref. 关5兴. This finding is interesting, because H 共like all other 20 traditional coding measures兲 is trained on species-specific data sets, and
⫺2.52 ⫺2.54 ⫺2.53 ⫺2.50 ⫺2.52 ⫺2.48
共0.31兲 共0.39兲 共0.34兲 共0.33兲 共0.34兲 共0.31兲
Coding ⫺2.04 ⫺2.06 ⫺2.05 ⫺2.04 ⫺2.05 ⫺2.09
共0.30兲 共0.30兲 共0.30兲 共0.32兲 共0.31兲 共0.31兲
¯I is not. If the ¯I distributions turn out to be species independent, then ¯I could be used without prior training to distinguish coding from noncoding DNA in all species, regardless of their taxonomic origin 关20兴. V. SPECIES INDEPENDENCE OF THE AVERAGE MUTUAL INFORMATION
¯) Next, we investigate the species independence of c (I ¯ ). Figure 2 shows the ¯I distributions for coding and and n (I noncoding DNA sequences from species of different taxonomic orders, phyla, and kingdoms. We find that the ¯I distributions are significantly different for coding and noncoding DNA, while they are almost identical for all taxonomic sets. In order to supplement this qualitative finding by a quantitative analysis, we present in Table I the means and variances of log10 ¯I 关21兴. Table I shows that the means are significantly different for coding and noncoding DNA, and that the means and variances are almost the same for all species. This finding is in agreement with the visual finding based on Fig. 2 that the ¯I distributions are species independent and significantly different in coding and noncoding DNA. VI. UNDERSTANDING THE SPECIES INDEPENDENCE FOR NONCODING DNA
In search for a possible origin of the observed species independence, we attempt to develop simple models that are able to reproduce the ¯I distributions for coding and noncoding DNA. We first present a model that reproduces the ¯I distributions for noncoding DNA. For a random, uncorrelated sequence of arbitrary composition (p 1 ,p 2 ,p 3 ,p 4 ), we can derive the asymptotic form of the probability density function ¯ ) as follows: Taylor-expand I(k) about P i j (k)⫺p i p j , (I i.e., express I(k) by the power series 兺 i, j 兺 l⬁ ⫽0 a i j l 关 P i j (k) ⫺p i p j 兴 l , and truncate the Taylor series after the quadratic term ( l ⫽2). The constant term ( l ⫽0) vanishes because I(k)⫽0 at P i j (k)⫽ p i p j , and the linear terms ( l ⫽1) vanish because I(k) achieves its minimum at P i j (k)⫽p i p j , which causes the first derivatives of I(k) to vanish at P i j (k)⫽ p i p j . Hence, the first nonvanishing terms in the
SPECIES INDEPENDENCE OF MUTUAL INFORMATION . . .
PRE 61
5627
Taylor-series expansion are the quadratic terms ( l ⫽2), and we obtain I共 k 兲 ⬀
1 ln 2
兺 i, j
关 P i j 共 k 兲 ⫺p i p j 兴 2 , 2p i p j
共5兲
where the symbol ⬀ indicates that we neglect terms of O 关 ( P i j ⫺p i p j ) 3 兴 . Substituting P i j (k) 共for k⫽3,4,5兲 by the expressions on the rhs of Eq. 共2兲 and expressing ¯I⬅ 关 I(3) ⫹I(4)⫹I(5) 兴 /3 in terms of p (m) yields i ¯I⬀
1 ln 2
冋兺 i,m
共 p 共i m 兲 ⫺p i 兲 2
2p i
册
2
.
共6兲
For a random, uncorrelated sequence the probability density 2 function of N 兺 i,m (p (m) i ⫺p i ) /p i converges, for asymptotically large sequence length N, to a 2 distribution with 6 ¯ ) condegrees of freedom 关22兴. Hence, we obtain that (I verges, for asymptotically large N, to
共 ¯I兲 ⫽
共 N 冑ln 2 兲 3 冑¯ • 冑¯I•e ⫺N 冑ln 2 I. 4
共7兲
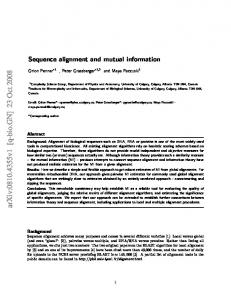
¯ ) from Eq. 共7兲 and the ¯I histograms Figure 3共a兲 shows (I for human noncoding DNA for N⫽54, 108, and 162 bp. We find that 共i兲 the ¯I distributions for noncoding DNA collapse after rescaling with a factor of N 2 , and that 共ii兲 the ¯I-distributions can be approximated by Eq. 共7兲. The agreement of the theoretical with the experimental ¯I-distributions states that the species independence of the ¯I distributions for noncoding DNA may be attributed to the absence of the genetic code in noncoding DNA of all living species. VII. UNDERSTANDING THE SPECIES INDEPENDENCE FOR CODING DNA
We now test if the species independence of the ¯I distributions for coding DNA may be reproduced by a simple model that incorporates the presence of a reading frame. We generate a random, uncorrelated sequence where the probability of obtaining nucleotide n i at position m is given by p (m) averaged over the entire set of DNA sequences for i which the model is constructed关23兴. Figure 3共b兲 shows the ¯I histograms for the model sequences and for human coding DNA sequences of length N⫽54 bp. We find that the ¯I distribution of the model sequences is significantly different from the ¯I distribution of human coding DNA sequences. We perform the same analyses for different organisms, ranging from simple bacteria to complex vertebrates, as well as for different N, and we find that in all cases the modeled ¯I distributions cannot reproduce the ¯I distributions of experimental, coding DNA. This result shows that the presence of a reading frame in coding DNA is not sufficient to reproduce the ¯I distributions of experimental, coding DNA, and thus cannot explain the observed species independence for coding DNA. This finding leads us to the conclusion that there must exist additional correlations or inhomogeneities 关24兴 in coding DNA, which are responsible for the observed speciesindependence of the ¯I distributions.
FIG. 3. Rescaled ¯I distributions of model and experimental, coding and noncoding DNA 共Ref. 关10兴兲. Fig. 3共a兲 shows the histograms of log10 N 2¯I for human noncoding DNA for N⫽54 bp 共䊊兲, 108 bp 共䊐兲, and 162 bp 共〫兲, and the corresponding 2 probability density function with 6 degrees of freedom 共thick line兲. In addition to the observation 共Fig. 2兲 that the ¯I distributions are almost identical for different species, we find that 共i兲 the rescaled ¯I distributions collapse for all taxonomic sets and for all N, and that 共ii兲 they agree with the 2 probability density function. Hence, the species independence of the ¯I distributions for noncoding DNA may be explained by the absence of a reading frame in noncoding DNA of all species. Figure 3共b兲 shows the histograms of log10 N 2¯I for human coding DNA sequences of length N⫽54 bp 共䊊兲, the probability density function for model sequences 共thick line兲, and the central 2 probability density function 共thin dotted line兲. We find that 共i兲 the modeled ¯I distribution 共thick line兲 is indeed shifted to higher ¯I values than the ¯I distribution of noncoding DNA 共thin dotted line兲, but that 共ii兲 the ¯I distribution of the model sequences 共thick line兲 is significantly different from the ¯I distribution of human coding DNA 共䊊兲. The significant difference between the modeled and the experimental ¯I distribution states that the presence of a reading frame is not sufficient to explain the species independence of the ¯I distributions of coding DNA 共Fig. 2兲. VIII. CONCLUSIONS
We reported the finding of a species-independent statistical quantity, the average mutual information ¯I, whose probability distribution function is significantly different in coding and noncoding DNA. We showed that ¯I can distinguish coding from noncoding DNA as accurately as traditional coding measures, which all require prior training on speciesspecific DNA data sets. The capability of ¯I to distinguish coding from noncoding DNA without prior training and irrespective of its phylogenetic origin suggests that ¯I might be useful to identify coding regions in genomes for which training sets do not exist. In an attempt to understand the origin of
5628
GROSSE, HERZEL, BULDYREV, AND STANLEY
PRE 61
correlations or inhomogeneities are a vital and speciesindependent ingredient of coding DNA sequences of any living organism.
the observed species independence of ¯I, we found that the ¯ ) may result from the absence species independence of n (I of a reading frame in noncoding DNA. We derived analytically the ¯I distribution for an ensemble of random, uncorrelated sequences of arbitrary composition, and we showed that this distribution is consistent with the observed ¯I distribution of noncoding DNA for all species and all sequence lengths N. For coding DNA, we could show that the presence of a reading frame in coding DNA sequences is not sufficient to reproduce the observed ¯I distributions of coding DNA. This finding makes it tempting to conjecture that additional
We thank D. Beule, C. DeLisi, J. W. Fickett, R. Guigo, K. Hermann, D. Holste, J. Kleffe, L. Levitin, W. Li, K. A. Marx, A. O. Schmitt, T. F. Smith, E. Trifonov, Z. Weng, and M. Q. Zhang for valuable discussions, and NIH, NSF, and DFG for financial support.
关1兴 B. Lewin, Genes VI 共Oxford Univ. Press, Oxford, 1997兲; H. Lodish et al., Molecular Cell Biology 共Freeman, New York, 1995兲; B. Alberts et al., Molecular Biology of the Cell 共Garland Publishing, New York, 1994兲. 关2兴 J. W. Fickett, Nucleic Acids Res. 10, 5303 共1982兲. 关3兴 R. Staden and A. D. McLachlan, Nucleic Acids Res. 10, 141 共1982兲. 关4兴 R. Guigo, S. Knudsen, N. Drake, and T. F. Smith, J. Mol. Biol. 226, 141 共1992兲; M. Borodovski and J. McIninch, ibid. 268, 1 共1993兲; M. S. Gelfand and M. A. Roytberg, BioSystems 30, 173 共1993兲; S. Dong and D. B. Searls, Genomics 23, 540 共1994兲; V. V. Solovyev, A. A. Salomov, and C. B. Lawrence, Nucleic Acids Res. 22, 5156 共1994兲; A. Thomas and M. H. Skolnick, IMA J. Math. Appl. Med. Biol. 11, 149 共1994兲; E. E. Snyder and G. D. Stormo, J. Mol. Biol. 248, 1 共1995兲; Y. Xu and E. C. Uberbacher, J. Comput. Biol. 4, 325 共1997兲; S. Tiwari, S. Ramachandran, A. Bhattacharya, S. Bhattacharya, and R. Ramaswamy, Comput. Appl. Biosci 13, 263 共1997兲; M. Q. Zhang, Proc. Natl. Acad. Sci. USA 94, 565 共1997兲; C. Burge and S. Karlin, J. Mol. Biol. 268, 78 共1997兲; J. Kleffe, Bioinformatics 14, 232 共1998兲. 关5兴 J. W. Fickett and C.-S. Tung, Nucleic Acids Res. 20, 6441 共1992兲. 关6兴 J. W. Fickett, Comput. Chem. 共Oxford兲 20, 103 共1996兲; M. Burset and R. Guigo, Genomics 34, 353 共1996兲; J.-M. Claverie, Hum. Mol. Genet. 6, 1735 共1997兲; R. Guigo, DNA Composition, Codon Usage, and Exon Prediction, in Bishop 共ed.兲 ‘‘Genetics Databases’’ 共Academic Press, New York, 1999兲, pp 53–79. 关7兴 A coding measure is a function f that maps a statistical pattern xជ to a real number y⬅ f (xជ ) such that the probability distribution functions of y are different in coding and noncoding DNA. Typically, xជ is high dimensional, and f depends on many empirical parameters. Typically, these parameters vary significantly from species to species. Hence, these parameters must be fitted by empirical analyses of species-specific data sets. The process of fitting the parameters is called training of the coding measure. 关8兴 The mutual information function is similar to, but different from, autocorrelation functions 共Ref. 关13兴兲. Its main advantage over correlation functions is that it does not require any mapping of symbols to numbers, which affects the analysis of symbolic sequences by correlation functions, because correlation functions are not invariant under changes of the map. Moreover, the mutual information function is capable of detecting
any deviation from statistical independence, whereas—by definition—correlation functions measure only linear dependences. Hence, we use the mutual information function in our analysis of DNA sequences. C. E. Shannon, Bell Syst. Tech. J. 27, 379 共1948兲. We use all eukaryotic DNA sequences from GenBank release 111 共D. A. Benson, M. S. Boguski, D. J. Lipman, J. Ostell, B. F. Ouellette, B. A. Rapp, and D. L. Wheeler, Nucleic Acids Res. 27, 12 共1999兲, ftp://ncbi.nlm.nih.gov/genbank/兲. There are 4 3 ⫽64 codons, 3 of which are stop codons, and 61 of which encode 20 amino acids. Hence, the genetic code is degenerate, i.e., there are 共many兲 amino acids that are encoded by more than one codon. All codons that encode the same amino acid are called synonymous codons. T. Ikemura, J. Mol. Biol. 146, 1 共1981兲; P. M. Sharp and H. Li, Nucleic Acids Res. 15, 1281 共1987兲; M. Bulmer, Nature 共London兲 325, 728 共1987兲; G. Bernardi, Annu. Rev. Genet. 23, 637 共1989兲; Y. Nakamura et al., Nucleic Acids Res. 24, 214 共1996兲. W. Li, J. Stat. Phys. 60, 823 共1990兲; H. Herzel and I. Grosse, Physica A 216, 518 共1995兲; Phys. Rev. E 55, 800 共1997兲. Mathematically, p i( m ) can be defined in terms of Q XY Z as folp i( 2 ) ⬅⌺ X,Z Q Xn i Z , and p i( 3 ) lows: p i( 1 ) ⬅⌺ Y ,Z Q n i Y Z , ⬅⌺ X,Y Q XY n 1 . Since the genetic code is a nonoverlapping triplet code, there are three frames in which a DNA sequence can be translated into an amino acid sequence. In the cell, only one of the three reading frames encodes the proper amino acid, but in our statistical analysis the choice of the reading frame is arbitrary in the sense that P i j (k) is invariant under shifts of the reading frame. In terms of the mutual information function I(k) for the pseudo-exon model, the average mutual information ¯I can be N expressed as ¯I⫽limN→⬁ ⌺ k⫽1 I(k)/N. We choose the length to be 54 bp in order to allow a comparison with the standard data set created in Ref. 关5兴, which consists of sequences of length 54 bp. Here, true positives 共true negatives兲 refer to correctly-predicted coding 共noncoding兲 sequences, and positives 共negatives兲 refer to all coding 共noncoding兲 sequences. Hence, T p (T n ) denotes the fraction of correctly predicted coding 共noncoding兲 sequences over all coding 共noncoding兲 sequences. Mathemati¯) cally, T p and T n are defined by T p ⬅ 兰 关 c (I ¯ ˜ ¯ ¯ ¯ ˜ ¯ ⫺ n (I) 兴 c (I)dI and T n ⬅ 兰 关 n (I)⫺ c (I) 兴 n (I)dI, where denotes the Heavyside function, i.e., (x)⬅1 for x⭓0 and (x)⬅0 for x⬍0.
ACKNOWLEDGMENTS
关9兴 关10兴
关11兴
关12兴
关13兴 关14兴
关15兴
关16兴
关17兴
关18兴
PRE 61
SPECIES INDEPENDENCE OF MUTUAL INFORMATION . . .
¯ ) and n (I ¯ ) were identical, O(I ¯ ) would be equal to 1. 关19兴 If c (I ¯ ) and n (I ¯ ) were completely disjoint 共nonIf c (I ¯ ) would be equal to 2. overlapping兲, O(I 关20兴 It is clear that ¯I can be computed from sequences of any length N 共which does not need to be a multiple of 54 bp兲. We present the accuracy of ¯I for N⫽54 bp, N⫽108 bp, and N⫽162 bp because these are the three length scales on which all of the 21 coding measures in Ref. 关5兴 are evaluated. 关21兴 In Figs. 2 and 3 and in Table I we take the logarithm of ¯I because 共i兲 the ¯I distributions have a broad tail 共ranging over several orders of magnitude兲, and 共ii兲 they are sharply peaked at ¯I⫽0. Consequently, the moments of ¯I are dominated by large values of ¯I and not by the bulk of the distribution. Hence, we display the density and compute the moments of log10 ¯I rather than those of ¯I. 关22兴 The mathematical proof can be found in: H. Cramer, Math-
5629
ematical Methods of Statistics 共Princeton University Press, Princeton, 1946兲. An intuitive heuristic argument of why the number of degrees of freedom is equal to 6 is that there are 4⫹3⫺1 independent linear constraints that the 4⫻3⫽12 numbers p i( m ) ⫺p i must satisfy. Hence, the number of degrees of freedom is 4⫻3⫺(4⫹3⫺1)⫽6. 关23兴 For the probabilities p i( m ) we choose the total number of nucleotides n i in position m of the biological reading frame divided by the total number of nucleotides from exactly the same set of coding human sequences to which the model sequences are compared. 关24兴 By correlations or inhomogeneities we mean that the probability distributions p i( m ) are not constant, but vary along the DNA sequence from gene to gene and also within a gene. These variations of the probability distributions p i( m ) seem to be a typical feature of coding DNA of any living organism.