Having broken up multi-threaded execution time into different cycle components for each thread, we revert to speedup, which is defined as single-threaded ...
Speedup Stacks: Identifying Scaling Bottlenecks in Multi-Threaded Applications Stijn Eyerman Kristof Du Bois Lieven Eeckhout ELIS Department, Ghent University, Belgium 16
Multi-threaded workloads typically show sublinear speedup on multi-core hardware, i.e., the achieved speedup is not proportional to the number of cores and threads. Sublinear scaling may have multiple causes, such as poorly scalable synchronization leading to spinning and/or yielding, and interference in shared resources such as the lastlevel cache (LLC) as well as the main memory subsystem. It is vital for programmers and processor designers to understand scaling bottlenecks in existing and emerging workloads in order to optimize application performance and design future hardware. In this paper, we propose the speedup stack, which quantifies the impact of the various scaling delimiters on multithreaded application speedup in a single stack. We describe a mechanism for computing speedup stacks on a multi-core processor, and we find speedup stacks to be accurate within 5.1% on average for sixteen-threaded applications. We present several use cases: we discuss how speedup stacks can be used to identify scaling bottlenecks, classify benchmarks, optimize performance, and understand LLC performance.
1
Introduction
Power efficiency and diminishing returns in improving single-core performance have driven the computer industry towards multi-core processors. Current general-purpose processors employ a limited number of cores in the typical range of 4 to 8 cores, see for example Intel Nehalem, Intel Westmere, IBM POWER7, AMD Bulldozer, etc. It is to be expected that the number of cores will increase in the coming years given the continuous transistor density improvements predicted by Moore’s law, as exemplified by Intel’s Many Integrated Core architecture with more than 50 cores on a chip. A major challenge with increasing core counts is the ability to program multi-core and many-core systems. Although parallel programming has been a challenge for many years in the scientific computing community, given the recent advent of multi-core and many-core processors, par-
speedup
Abstract
14
blackscholes
12
facesim cholesky
10 8 6 4 2 0 1 thread
2 threads
4 threads
8 threads
16 threads
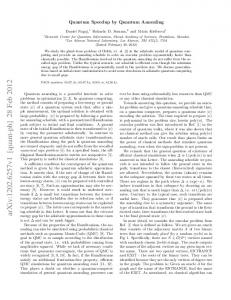
Figure 1. Speedup as a function of the number of cores for blackscholes, facesim (both PARSEC) and cholesky (SPLASH-2).
allel programming has become inevitable for mainstream computing. One of the key needs to efficient programming is to have the appropriate tools to analyze parallel performance. In particular, a software developer needs analysis tools to identify the performance scaling bottlenecks, not only on current hardware but also on future hardware with many more cores than are available today; likewise, computer architects need analysis tools to understand the behavioral characteristics of existing and future workloads to design and optimize future hardware. Speedup curves which report speedup as a function of the number cores, as exemplified in Figure 1, are often used to understand scaling behavior of an application. Although a speedup curve gives a high-level view on application scaling behavior, it does not provide any insight with respect to why an application does or does not scale. There are many possible causes for poor scaling behavior, such as synchronization, as well as interference in both shared on-chip resources (e.g., last-level cache) and off-chip resources (e.g., main memory). Unfortunately, a speedup curve provides no clue whatsoever why an application exhibits poor scaling behavior. In this paper, we propose the speedup stack which is a novel representation that provides insight into an application’s scaling behavior on multi-core hardware. The height
speedup
hardware. The concept of a speedup stack is broadly applicable to multiprocessor, chip-multiprocessor and various forms of multi-threading architectures.
max theoretical speedup N
imbalance spinning yielding
• We extend a previously proposed per-thread cycle accounting architecture [7] for computing speedup stacks on chip-multiprocessors. The extensions include support for quantifying the impact of positive interference in shared caches on multi-threaded application performance along with support for quantifying the impact of spinning and yielding. The overall accounting architecture can be implemented in hardware.
cache coherency parallelization overhead negative interference
net negative interference actual speedup positive interference base speedup
0
Figure 2. Illustrative speedup stack.
2 of the speedup stack is defined as N with N the number of cores or threads. The different components in a speedup stack define the actual speedup plus a number of performance delimiters: last-level cache (LLC) and memory interference components represent both positive and negative interference in the LLC and main memory; the spinning component denotes time spent spinning on lock and barrier variables; the yield component denotes performance deficiency due to yielding on barriers and highly contended lock variables; additional components are due to cache coherency, work imbalance and parallelization overhead. Figure 2 shows an example speedup stack. The intuition is that the scaling delimiters, such as negative LLC and memory interference, spinning and yielding, and their relative contributions, are immediately clear from the speedup stack. Optimizing the largest scaling delimiters is likely to yield the largest speedup, hence, a speedup stack is an intuitive and useful tool for both software and hardware optimizations. Next to introducing the concept of the speedup stack, this paper also describes a method for computing speedup stacks from a single run, either in simulation software or real hardware; the cost for a hardware implementation is limited to 1.1KB per core or 18KB for a 16-core CMP. Our experimental results demonstrate the accuracy of the approach: we achieve an average absolute error of 5.1% on 16-core processors across a set of SPLASH-2, PARSEC and Rodinia benchmarks. Finally, we describe several applications for speedup stacks apart from the obvious application of analyzing performance scaling bottlenecks. We use speedup stacks to classify benchmarks based on their scaling bottlenecks, we identify optimization opportunities, and we analyze LLC performance. In summary, we make the following two major contributions in this paper: • We introduce the speedup stack which is a novel representation that quantifies the impact of various scaling bottlenecks in multi-threaded workloads on multi-core
Speedup stack
For explaining the key concept of a speedup stack, we refer to Figure 3. To simplify the discussion we focus on the parallelizable part of a program. Amdahl’s law already explains the impact of the sequential part on parallel performance, hence, we do not consider it further in the remainder of the paper. If of interest, including the sequential part in the speedup stack can easily be done. We define Ts as the execution time of (the parallelizable part of) a program under single-threaded execution. The execution time of the same program during multi-threaded execution will (most likely) be shorter, say Tp . We now break up the execution time of a thread during multi-threaded execution in various cycle components; note that the total execution time is identical for all threads under this breakup. The idealized multi-threaded execution time, assuming perfect parallelization, equals Ts /N with N the number of threads or cores. Note we use the terms ‘thread’ and ‘core’ interchangeably as we assume chip-multiprocessors in this paper, however, the concept of a speedup stack can also be applied to shared-memory multiprocessors (SMP) as well as simultaneous multi-threading (SMT) and other forms of multi-threading. Obviously, the idealized multi-threaded execution time Ts /N is not achieved in practice, hence multi-threaded execution time is typically larger, for a number of reasons. Parallelizing an application incurs overhead in the form of additional instructions being executed to communicate data between threads, recompute data, etc. This is referred to as parallelization overhead in the speedup stack. Other overhead factors include spinning (active spinning on lock and barrier variables), yielding (the operating system scheduling out threads that are waiting on barriers or highly contended locks), and imbalance (threads waiting for other threads to finish their execution). Finally, there are interference effects in the memory hierarchy, both positive and negative in both the LLC and memory subsystem, as well as performance penalties due to cache coherency. Positive interference obviously offsets negative interference. In a rare case, positive interference could lead to superlinear speedups in case
(a) Single-threaded execution
tion overhead) for thread i, and Pi positive interference for thread i. Given the estimated single-threaded execution time, we ˆ can now estimate the achieved speedup S: � � PN P PN ˆ T − O + P ˆ p i,j i i j Ti Ts Sˆ = = i = . (3) Tp Tp Tp
single-threaded execution time Ts
(b) Multi-threaded execution per-thread execution time Tp
We now reformulate the above formula to: PN N P X Pi j Oi,j ˆ S=N− + i . Tp Tp i
per-thread execution time breakup: idealized execution time Ts/N
positive interference
parallelization overhead yielding negative interference spinning imbalance cache coherency
Figure 3. Breaking up per-thread performance for computing speedup stacks.
negative interference as well as the other overhead factors are small. Interference in a chip-multiprocessor is limited to parts of the memory hierarchy; multi-threading architectures (e.g., SMT) also incur interference in the processor core, and hence an additional core interference component would need to be considered for these architectures. Having broken up multi-threaded execution time into different cycle components for each thread, we revert to speedup, which is defined as single-threaded execution time divided by multi-threaded execution time: S=
Ts . Tp
(1)
The way we build up a speedup stack is to profile a multithreaded execution, compute the aforementioned cycle components for each thread, and estimate single-threaded execution time from them. How we define and compute the cycle components will be explained extensively later on in the paper. The way we estimate single-threaded execution time is essentially the reverse process of what we just explained considering Figure 3. We estimate the various cycle components during multi-threaded execution, and we substract these cycle components from the measured execution time. This yields the fraction single-threaded execution time Tˆi for each thread. Summing these fractions Tˆi then provides an estimate for the total single-threaded execution time Tˆs : N N X X X T p − Tˆs = Tˆi = Oi,j + Pi , (2) i
i
j
with Oi,j overhead component j (negative interference, spinning, yielding, imbalance, cache coherency, paralleliza-
(4)
This formula immediately leads to the speedup stack by showing the different terms in the above formula in a stacked bar. The height of the bar equals the maximum achievable speedup, namely N . The various terms denote the aggregate overhead components across all threads, along with the aggregate positive interference component. In summary, the speedup stack consists of the base speedup plus a number of components, see also Figure 2. Base speedup is defined as N P X j Oi,j ˆ , (5) Sbase = N − Tp i and denotes the achieved speedup not taking into account positive interference. The actual speedup then is the base speedup plus the positive interference component. The other components highlight overhead components due to negative interference, cache coherency, parallelization overhead, spinning, yielding and imbalance. Note that the net negative interference is computed as the negative interference component minus the positive interference component. An intuitive interpretation of a speedup stack is that it shows the reasons for sublinear scaling and hints towards the expected performance benefit from reducing a specific scaling bottleneck, i.e., the speedup gain if this component is reduced to zero. This can guide programmers and architects to tackle those effects that have the largest impact on multi-threaded multi-core performance. The remainder of this paper is organized as follows. We start with explaining the various overhead and interference effects during multi-threaded execution in more detail in Section 3. Section 4 then describes a method for computing these effects. In Sections 5 and 6, we describe our setup and validate the described method, respectively. We show some interesting examples and applications in Section 7, we describe related work in Section 8, and we finally conclude in Section 9.
3
Scaling delimiters
In this section, we describe the five major scaling delimiters of multi-threaded workloads on multi-core hardware:
resource sharing, cache coherency, synchronization, load imbalance, and parallelization overhead. The next section then describes how we account for each of these. In case an application spawns more threads than there are hardware thread contexts, scheduling also has an effect on performance — this is out of the scope for this paper though.
3.1
Resource sharing
Multi-core architectures typically have some level of resource sharing. This ranges from the interconnection network only (in case of an SMP); to main memory, memory bandwidth and the LLC (in case of a chip-multiprocessor); to core components (in case of an SMT core). Resource sharing improves the utilization of a hardware component and can improve overall system performance. However, resource sharing may also have a negative impact on per-thread performance. Focusing on a CMP with a shared LLC and main memory, cache sharing may cause threads to evict data of other threads, which means that the latter will experience more misses than in isolated execution. On the other hand, cache sharing may also lead to positive interference, i.e., one thread bringing data into the shared cache that is later accessed by other threads. Sharing main memory implies that accesses from one thread may be delayed by accesses from other threads, in a number of ways. If the bus between the processor and main memory is occupied by one thread, other threads have to wait. Similarly, when a memory bank is occupied by one thread, other threads cannot access that same bank in the same cycle. If the memory has an open-page policy, it may occur that a thread opens another page between two consecutive accesses to the same page of another thread. The last access of the latter thread now encounters another open page, which means it incurs an extra penalty of writing the current page back and reopening the original page.
3.2
Cache coherency
Cache coherency ensures that private caches (e.g., the L1 caches in a CMP) are consistent with respect to shared data. Cache coherency introduces extra traffic on the bus or interconnection network, and causes additional misses when local cache lines that are invalidated through upgrades by other cores, are re-referenced later. Unnecessary cache coherency traffic may result from false sharing.
3.3
is transactional memory. A barrier on the other hand, imposes ordering and denotes a point in the execution beyond which a thread is only allowed to go after all other threads have reached that point. The result of a barrier is that the execution of a thread is halted until all threads have reached the barrier. A barrier can be shared across all threads, or between a subset of the threads.
3.4
Load imbalance
Load imbalance means that one or a few threads need (substantially) more time to execute than the other threads, which puts a limit on the achievable speedup, as the execution time of a multi-threaded application is determined by the slowest thread. Load imbalance can be caused by an uneven division of the work among the threads, but it can also be a result of the impact of resource sharing, cache coherency or synchronization. A thread that has an equal amount of work compared to the other threads, but is delayed more through resource sharing, cache coherency or synchronization can become the slowest thread, limiting an application’s overall performance. Synchronization effects through barriers could also lead to load imbalance: an application should be developed such that all threads reach the common barrier at the same time; if not, load imbalance may cause some threads to wait for other threads to reach the barrier. In this work, we classify work imbalance at barriers as a synchronization effect.
3.5
Parallelization overhead
Parallelizing a program typically incurs some overhead. Threads need to be spawned, locks need to be checked, acquired and released, local calculations possibly need to be done multiple times if it is too costly to communicate their results via shared variables, etc. Because these extra instructions incur computation time, they contribute to the sublinear speedup effect. Although parallelization overhead cannot be readily measured in hardware, it is most visible to the programmer. A software developer has a good understanding of the amount of parallelization overhead. In this paper, we do not measure the impact of parallelization overhead though, which implies that the estimated speedup is higher than the actual speedup in most cases. However, we do argue in Section 6 that this error correlates well with parallelization overhead.
Synchronization
The two most commonly used synchronization primitives are locks and barriers. Locks are typically used to define critical sections to guarantee atomicity when modifying shared data. Critical sections do not impose a particular ordering of execution, but they prevent threads from reading and modifying the same data concurrently. An alternative to using locks for guaranteeing atomicity in critical sections
4
Cycle component accounting
As explained in Section 2, in order to compute a speedup stack, we need to break up multi-threaded execution time into its various cycle components. We therefore extend a previously proposed per-thread cycle accounting method [7] to measure the impact of positive inter-
ference due to sharing, spinning and yielding. These effects only occur when executing a multi-threaded program on a CMP, while the previously proposed mechanism targets measuring interference for multi-program workloads, i.e., negative interference when co-executing independent single-threaded programs. The next section briefly summarizes the key features of the previously proposed CMP perthread cycle accounting technique. In subsequent sections, we then describe how we quantify the impact of positive interference in the LLC, spinning, yielding, cache coherency, and load imbalance.
4.1
Negative interference
We use the per-thread cycle accounting architecture by Eyerman et al. [7] for quantifying negative interference effects due to sharing in the LLC and main memory subsystem. Inter-thread misses, i.e., misses due to sharing in the LLC, are detected using auxiliary tag directories (ATDs). There is an ATD for each core, and its goal is to quantify the number of additional misses due to sharing the LLC against a private LLC for each core (of the same size as the shared LLC). The ATD has as many ways as the shared LLC and keeps track of the tags and status bits for each cache line. Misses in the LLC that hit in the ATD are classified as interthread misses (negative interference). To reduce the hardware cost of the ATDs, only a few sets are monitored in the LLC. To estimate the total penalty of inter-thread misses, the penalty of the sampled inter-thread misses is extrapolated by multiplying it with the sampling factor. Negative interference in the memory subsystem occurs due to memory bus, memory bank and open page conflicts. Interference in the bus and at the memory bank level is measured as follows: if a memory access is ready to access the bus or a specific memory bank, and the bus or bank is occupied by a memory access of another core, then the waiting time until the bus or bank is free is accounted as interference cycles. For measuring interference due to closed pages by other threads, an open row array (ORA) is added per core. The ORA keeps track of the pages opened by the given core only. If a memory access of a core encounters a closed page (i.e., its data is not in the current open page), and the ORA indicates this core opened the page most recently, then there is negative interference. The cost of writing back the page, and opening a new page is accounted for as interference cycles. In order to model overlap effects in an out-of-order processor, we only account interference cycles in case a miss blocks the ROB head and causes the ROB to fill up.
4.2
Positive interference
This previously proposed cycle accounting architecture accounts for negative interference only when running multiprogram workloads. Multi-threaded workloads on the other hand also exhibit positive interference as threads share data.
This implies that one thread can load data into the shared LLC that can possibly be reused by other threads. This means that the other threads will experience a hit instead of a miss in case of a private LLC. This sharing effect thus has a positive impact on performance and should be measured by the cycle accounting infrastructure. We refer to an LLC hit as an inter-thread hit if the thread accesses data that was previously brought into the shared LLC by another thread. An inter-thread hit can be detected using the aforementioned ATDs: a hit in the shared LLC that results in a miss in the private ATD, is classified as an inter-thread hit. Interestingly, identifying inter-thread hits does not incur additional hardware state over the per-thread cycle accounting described in the previous section. To quantify the impact of inter-thread hits on performance, we need to estimate the penalty an access would have seen if it were a miss. We cannot use an extrapolation technique here, because there is no penalty, hence we cannot measure it. Instead, we use an interpolation approach: we take the total number of cycles a core is stalled on an LLC load miss, and divide that by the number of LLC load misses. This yields the average miss penalty. Then we take the number of sampled inter-thread hits, multiply it with the sampling factor (total number of LLC accesses divided by the number of sampled ATD accesses) to get the estimated total number of inter-thread hits. We then multiply this number with the average miss penalty to obtain an estimate for the total positive interference.
4.3
Spinning
Spinning happens when a thread wants to acquire a lock to enter a critical section, but the lock is in use by another thread. Similarly, spinning may happen on a barrier. In that case, the thread enters a spin loop and constantly checks the lock until it is released. This implies that the time a thread spends in a spinning loop should be accounted as interference cycles. To detect spinning and account for its interference cycles, we implemented and evaluated two spinning detection mechanisms that have been proposed in literature. Li et al. [11] propose a mechanism where all backward branches are monitored and considered as possible spinning loop branches. If the processor state is unchanged since the last occurrence of the same branch, then the loop is considered a spinning loop. Processor state is tracked using a compact representation to represent register state changes, and when a (non-silent) store occurs, processor state is assumed altered. By keeping a timestamp at the occurrence of backward branches, and subtracting this timestamp from the current time (when the same branch is executed and processor state is unchanged), one can quantify the time spent in spin loops. A second mechanism, proposed by Tian et al. [14], de-
tects spinning by monitoring loads as a spin loop contains at least one load (to check the lock status). If a load instruction loads the same data more than a given number of times (determined by a threshold), it is marked as possibly belonging to a spinning loop. If at some point in time, a marked load loads different data, then it is checked whether the new data was written by another core (using cache coherence information). If so, it was a spinning loop. Again, by keeping a timestamp at the first occurrence of a load, the total spinning time can be measured. Tian et al. implemented this technique in software, but it could also be done in hardware. Because the Tian et al. mechanism is simpler to implement (only keeping track of loads, no processor state monitoring), we consider this method for quantifying spinning overhead. This discussion assumed lock-based critical sections. In the case of transactional memory, one could measure the execution time of a transaction, and when it is rolled back because of a conflict, the time spent in the transaction is added as a synchronization penalty.
4.4
Yielding
Spinning consumes resources despite of the fact that the thread does not make forward progress. Synchronization libraries are therefore optimized to avoid spinning when a long waiting time is to be expected. Instead of spinning, the threads trying to aquire the lock or barrier are scheduled out, and are awoken when the synchronization condition is met. Like that, the operating system can schedule other threads on the core, or shut down a core if there are no available threads. Since this is also a form of synchronization penalty, we also measure the time a thread is scheduled out. This can be done in a straightforward way in the operating system. In this paper, we refer to this effect as yielding.
4.5
Cache coherency
As previously discussed, cache coherency affects multithreaded performance by invalidating local cache lines in private caches, which in its turn may induce additional L1 cache misses. However, a balanced out-of-order processor core can hide (most) L1 data cache misses very well [10], hence we do not account for cache coherency misses in this paper. This may introduce error in case a workload suffers from a large number of L1 data cache misses along with long chains of dependent instructions which would prevent the out-of-order core from hiding their performance impact. However, in case L1 misses do incur a penalty (e.g., in an in-order architecture), coherency misses can be detected by noticing that invalidation by the coherency mechanism causes a cache line to be invalid without being (immediately) replaced by another cache line. Also, in case of an invalidation, usually only the status bits are adapted, while the tag remains in the tag array. If a miss occurs, but there is
a hit in the tag array and the status is invalid, we can assume that this is most likely a coherency miss.
4.6
Load imbalance
The load imbalance component for a thread is computed as follows. Knowing the execution time of the slowest thread, we add a load imbalance component to each of the other threads such that the sum of all the cycle components for each thread equals the execution time of the slowest thread. This accounts for the load imbalance at the end of the (parallel part of the) program. Imbalance at barriers is accounted as synchronization, either through spinning or yielding, as described above. The reason is that it is impossible for the cycle accounting architecture when implemented in hardware to distinguish lock spinning from barrier spinning (or yielding). This problem can be solved though by computing speedup stacks for each region between consecutive barriers; the imbalance before each barrier (to be computed alike the load imbalance at the end of the program as described above) then quantifies barrier overhead.
4.7
Hardware cost
The total hardware cost for implementing the cycle component accounting architecture is limited. The accounting for computing both negative and positive interference in shared resources incurs a hardware cost of 952 bytes per core, see also [7]. The accounting for spinning overhead using the Tian et al. [14] approach incurs a load table: assuming a spinning loop contains at most 8 loads, 8 entries are needed in the table, containing the load PC, the address, the loaded data, a mark bit and a timestamp, which amounts to 217 bytes per core (assuming 64 bit addresses and data). The total hardware cost is therefore 1.1KB per core, or 18KB in total for a 16-core CMP. The cycle component accounting architecture implemented in hardware provides raw cycle counts that are then processed in software. For example, for computing positive interference, the cycle accounting hardware architecture computes the total number of cycles a core is stalled on an LLC load miss plus the number of LLC load misses; system software then computes the average penalty per miss from these raw event counts and performs the interpolation as previously explained. This way, hardware complexity is limited and the proposed accounting architecture is feasible to implement in hardware.
5
Methodology
We implemented the cycle accounting architecture in the gem5 simulator assuming the Alpha ISA [3]. Further, we simulate a set of multi-threaded benchmarks from the SPLASH-2 [15], PARSEC [2] and Rodinia [4] benchmark
suites that we were able to run in our simulation environment. All benchmarks were compiled using GCC version 4.3.2 with the -O3 optimization level. Results are gathered from the parallel fraction of the benchmarks only. We simulated all benchmarks for 1, 2, 4, 8 and 16 threads, and we assume as many threads as there are cores, unless mentioned otherwise. The simulated processor is a CMP consisting of fourwide superscalar out-of-order cores. L1 caches are private (32KB L1 I-cache and 64KB L1 D-cache), and the shared L2 cache is 2MB in size and is the last-level cache (LLC) — the technique proposed in this paper can be trivially extended to architectures with private L2 caches and a shared L3 LLC. All cores share the memory bus and the memory subsystem with 8 memory banks.
6
Validation
Validating an implementation for computing speedup stacks is challenging, because it is hard, if at all possible, to isolate each of the stack contributors. Nevertheless, we can evaluate what the accuracy is of the estimated speedup Sˆ (Formula 3) versus the actual speedup S (Formula 1). We define error as Sˆ − S , (6) Error = N with N the number of cores/threads. The average absolute error is 3.0%, 3.4%, 2.8% and 5.1%, for 2, 4, 8 and 16 threads, respectively. Figure 4 shows the actual speedup against the estimated speedup for 2, 4, 8 and 16 threads/cores. Accuracy is fairly good: cycle component accounting identifies the benchmarks that scale well versus the benchmarks that do not, and more importantly, the method fairly accurately identifies the degree of scaling. For some benchmarks through, the estimated speedup is off, see for example fluidanimate medium (22.0%), swaptions small (21.3%), lu.ncont (16.2%) and srad (14.8%). The reason for these errors are multifold. For one, as mentioned before, the proposed method does not account for parallelization overhead. Computing the increase in dynamic instruction count for a multi-threaded execution over singlethreaded execution, and subtracting the number of instructions due to spinning, is a measure for the amount of parallelization overhead. We found parallelization overhead to be fairly high for swaptions small (26% more instructions) and fluidanimate medium (18% more instructions). Other possible reasons for the error are inaccuracies for estimating the impact of positive and negative interference (cf. interpolation and extrapolation); inaccuracies for computing spinning overhead as it is based on some threshold; not taking into account the impact of cache coherency.
7
Applications
Having obtained confidence in the accuracy of the speedup stacks, we now explore a number of applications to illustrate their usefulness for performing performance analyses and workload characterization studies, as well as for driving hardware and software optimizations.
7.1
Identifying scaling bottlenecks
Our first application is to identify scaling bottlenecks in multi-threaded applications through visual inspection of the speedup stacks. Figure 5 shows speedup stacks for the blackscholes, facesim and cholesky benchmarks for 2 up to 16 threads/cores; note that Figure 1 in the introduction of the paper showed speedup curves for the same set of benchmarks. The black bottom component represents the base speedup, i.e., the speedup without positive interference effects, or the number of threads minus all negative interference components. The dark gray component on top of it (if present) represents the positive LLC interference component, hence the actual speedup is the sum of the dark gray and black components. The white component is the net negative interference LLC sharing component, i.e., the negative LLC sharing component minus the positive LLC sharing component. In other words, the negative LLC interference component equals the sum of the dark gray and white components. If all negative cache sharing could be removed, then the speedup would increase with an amount equal to the negative cache sharing component, which is the sum of the dark gray and white components. The other components represent interference in the memory subsystem, spinning and yielding. The speedup stacks in Figure 5 do not show an imbalance component: as we measure the stacks over the entire parallel fraction of the program (i.e., between the divergence and convergence of the threads), the imbalance component is zero or nearly so, hence it is not visible. As was apparent from the speedup curves in Figure 1, blackscholes shows almost perfect scaling; there are no significant scaling bottlenecks as clearly observed from the speedup stacks in Figure 5. Figure 1 also showed that speedup scales poorly with the number of threads and cores for facesim and cholesky. Although their speedup curves look similar and both benchmarks achieve comparable speedups, the speedup stacks shown in Figure 5 reveal that the reason for the limited speedups differs across the two benchmarks. For facesim, the main scaling delimiters are yielding, negative LLC interference and interference in the memory subsystem. In contrast, spinning is the major scaling bottleneck for cholesky, followed by yielding and memory interference. cholesky also has a fairly large positive sharing component (the largest, as we will see in Section 7.3), but its impact is completely compensated by negative interference in the shared cache.
speedup
16 14 12 10
actual estimated
8 6 4 2 0
Figure 4. Actual speedup and estimated speedup for all benchmarks for 2, 4, 8 and 16 threads. 16 yielding
14
speedup
12
spinning
10 8
negative memory interference
6 net negative LLC interference
4 2
positive LLC interference
0 2 4 8 16 2 4 8 16 2 4 8 16 threads threads threads threads threads threads threads threads threads threads threads threads blackscholes
facesim
base speedup
cholesky
Figure 5. Speedup stacks as a function of the number of threads for blackscholes, facesim and cholesky.
These examples clearly show the value of speedup stacks, as they reveal the major scaling bottlenecks, which vary across programs, even if the actual speedups are comparable. Moreover, identifying these scaling bottlenecks without speedup stacks would be challenging. Guided by the speedup stacks, programmers can try to reduce synchronization overhead if spinning or yielding is large, for example by using finer grained locks and smaller critical sections. If negative interference in the LLC or main memory is a major component for several important applications according to the speedup stacks, processor designers can put more resources towards avoiding negative interference, for example through novel cache partitioning algorithms.
7.2
Benchmark classification
Having obtained speedup stacks for a large number of benchmarks, one can classify the benchmarks according to their scaling behavior. Figure 6 shows such a schematic representation for all the benchmarks considered in this study based on the speedup stacks for 16-threaded execution. This tree-like representation is built up as follows. Going from left to right, we first classify the benchmarks
according to their scaling behavior. Good scaling behavior means a speedup of at least 10× for 16 threads, while poor scaling benchmarks have a speedup of less than 5×. The in-between benchmarks are classified as moderate. The next bifurcation in the tree is based on the largest scaling delimiter (i.e., the largest component in the speedup stack). It shows the main scaling delimiters for each of the benchmarks that belong to a certain scaling category. The type of the component always appears on top of the line. If there is no component on top of the line, then there is no considerable component that limits scaling (e.g., for blackscholes, as discussed before). The following two bifurcations reflect the second and third largest scaling bottlenecks. Again, if there is no component name on top of the line, then all remaining components are negligible. The fifth column lists the names of the benchmarks, followed by the benchmark suite they belong to and their actual speedup number. An insightful way for reading the tree graph in Figure 6, is to read the graph from right to left. To find the characteristics of a specific benchmark, locate the benchmark at the right handside of the figure. Then follow the first line that
scaling
good
1st comp
2nd comp
memory
yielding
yielding memory spinning
yielding yielding
cache memory
cache
memory
moderate
yielding
memory
poor
yielding
memory
3rd comp
benchmark blackscholes blackscholes radix swaptions heartwall srad cholesky lud water-nsquared fluidanimate lu.ncont lu.cont facesim facesim fft canneal canneal bfs ferret water-spatial dedup freqmine freqmine swaptions dedup bodytrack ferret needle
cache
suite parsec_medium parsec_small splash2 parsec_medium rodinia rodinia splash2 rodinia splash2 parsec_medium splash2 splash2 parsec_medium parsec_small splash2 parsec_medium parsec_small rodinia parsec_medium splash2 parsec_medium parsec_small parsec_medium parsec_small parsec_small parsec_small parsec_small rodinia
speedup 15.94 15.71 11.60 12.99 10.39 5.20 5.02 5.77 5.77 5.71 5.53 5.79 5.50 5.46 9.43 7.61 6.93 5.65 4.77 4.57 4.12 4.09 3.89 3.81 3.56 3.02 2.94 4.14
Figure 6. Tree graph showing main speedup delimiter components for each benchmark for 16 threads: follow the first line underneath a benchmark from right to left to find its scaling behavior and its third, second and first (from right to left) largest components.
is underneath this benchmark to the left to find out the main scaling limiting components and its scaling category. For example for facesim, the major scaling bottlenecks are, in decreasing order, yielding, LLC interference and memory interference, while achieving moderate scaling. There are a number of interesting observations to be made from this tree-based classification. First, only few benchmarks scale well: 5 out of the 28 benchmarks have a speedup of at least 10× for 16 threads. The other two categories (moderate and poor scaling) contain approximately the same number of benchmarks, but by looking at the speedup numbers, it is clear that even in the moderate group, most of the benchmarks achieve a speedup only slightly above 5×. The poorest performing benchmark (ferret) shows a speedup of less than 3× for 16 threads. It is also interesting to note that scaling behavior typically improves with input size, see swaptions as an extreme example (speedup increases from 3.8× to 13.0× when the simmedium input is used compared to simsmall); this illustrates the weak scaling behavior of this workload. Interestingly, yielding seems to be the most significant scaling delimiter. It is the largest component for 23 of the 28 benchmarks (see the second column from the left), and the second largest component for 3 of the remaining 5 benchmarks. For 13 benchmarks it is the only component with a non-negligible value, which means that the only limiting factor is the fact that only a few threads are active at a time.
In this case, the speedup number is an approximation of the average number of active threads. This means that, although there are 16 threads spawned, only a fraction of the threads is active, and hence only a fraction of the cores are busy. This suggests that these benchmarks do not need 16 cores; hence, a number of cores that is slightly larger than their speedup number might yield the same performance. This insight is validated in Figure 7, which compares speedup for the 16-threaded version of ferret run on 2, 4, 8 and 16 cores. It reveals that if there are 16 threads spawned, performance saturates at 8 cores (the lower performance for 16 cores can be explained by the Linux scheduler being less efficient when there are more cores). The graph also shows the speedup when the number of threads equals the number of cores, from which it follows that having more software threads than hardware thread contexts (cores) leads to better performance.
7.3
Understanding LLC performance
Sharing the LLC has two main advantages: cache space is used more efficiently compared to private caches, and shared data has to be fetched only once, and then it can be used by all cores (positive interference). This comes at the cost of negative interference (threads evicting each other’s data). In this section, we investigate the impact of positive versus negative interference. Figure 8 shows the negative, positive and net interference
3.5
neg cache interference
16 threads
speedup stack component
3
1.5 # threads = # cores
speedup
2.5 2 1.5 1 0.5
1.0
pos cache interference net interference
0.5
0.0
-0.5
0 2 cores
4 cores
8 cores
16 cores
-1.0 2MB
Figure 7. Speedup numbers for ferret as a function of the number of cores. The number of threads equals the number of cores (left bars) or equals 16 (right bars).
speedup stack component
neg cache interference 1.5 1.0
pos cache interference net interference
0.5 0.0 -0.5 -1.0 cholesky lu.cont canneal canneal small large
bfs
lu.ncont needle
Figure 8. Negative, positive and net LLC interference components.
components in the LLC assuming 16 cores; only the benchmarks with a non-negligible positive interference component are shown. For all benchmarks, the negative interference exceeds the positive interference, resulting in a net component that has a negative impact on performance (which is the white component in Figure 5). However, as we enlarge the LLC, negative interference should decrease (fewer capacity misses), while positive interference should remain constant (since this is a result of the characteristics of the program, not the hardware). This is validated in Figure 9, where we show the same components for cholesky for an LLC of 2MB (default), 4MB, 8MB and 16MB. Negative interference indeed decreases, while positive interference remains approximately constant as a function of cache size, resulting in a smaller net interference component, and even a negative one, which means that the total impact of cache sharing is positive for performance.
8MB
16MB
Figure 9. Negative, positive and net interference components for cholesky as a function of LLC size.
8
2.0
4MB
Related work
There exist a number of tools for analyzing parallel performance, see for example Intel’s VTune Amplifier XE1 and Rogue Wave/Acumem ThreadSpotter2 . Intel’s VTune uses hardware performance counters provided by the hardware. Rogue Wave/Acumem ThreadSpotter samples a running application to capture a fingerprint of its memory access behavior, and provides feedback to the user to address memory performance problems. The information provided by ThreadSpotter is limited to cache miss ratios and similar aggregate event counts, and does not provide speedup stacks. Although these tools are powerful and can be used to identify performance bottlenecks, they are unable to provide a speedup stack and quantify the relative contributions of the various scaling delimiters. CPI stacks [6] are frequently used for identifying performance bottlenecks in single-threaded applications. Eyerman et al. [9] propose a cycle accounting architecture for constructing CPI stacks on out-of-order processors which is challenging to do given overlap effects among miss events and useful computation. CPI stacks are widely used for guiding software and hardware optimization. One could argue that the speedup stack is in the multi-threaded application domain what the CPI stack is for single-threaded applications. Per-thread cycle accounting, or identifying how much co-executing threads affect each other’s performance, is an important vehicle for achieving better levels of quality-ofservice and service-level agreements. Several groups have been proposing schemes for per-thread cycle accounting, see for example [5, 7, 8, 12, 13, 16]. All of the proposals focused on multi-program workloads of independent single1 http://software.intel.com/en-us/articles/intel-vtune-amplifier-xe/ 2 http://www.roguewave.com/products/threadspotter.aspx
threaded applications, and none focused on multi-threaded applications involving the performance impact of positive interference and spinning/yielding. Bhattacharjee and Martonosi [1] predict critical threads, or threads that suffer from imbalance. The motivation is to give more resources to critical threads so that they run faster, offload tasks from critical threads to non-critical threads to improve load balancing, etc. They determine thread criticality by tracking and weighting the number of cache misses at different levels in the memory hierarchy.
9
Conclusion
Analyzing parallel performance and identifying scaling bottlenecks is key to optimize both software and hardware. This paper proposed a novel representation called the speedup stack which visualizes the achieved speedup and the various scaling delimiters as a stacked bar. The height of the speedup stack equals the number of threads, and the stack components denote the scaling delimiters, such as LLC and memory subsystem interference, spinning, yielding, imbalance, cache coherency, etc. The intuition is that the relative importance of the scaling delimiters is immediately clear from the speedup stack, hence, it is a insightful tool for driving both hardware and software optimizations. The concept of a speedup stack is applicable to the broad range of multi-threaded, multi-core and multiprocessor systems. In addition to introducing speedup stacks, we also described an implementation for computing speedup stacks in hardware. Hardware cost is limited to 1.1KB per core or a total of 18KB for a 16-core CMP. Accuracy is within 5.1% average absolute error across a broad set of SPLASH2, PARSEC and Rodinia benchmarks. Further, we demonstrated the usage of speedup stacks for identifying scaling bottlenecks, for classifying benchmarks based on their scaling delimiters, and for understanding LLC performance.
Acknowledgements We thank the anonymous reviewers for their constructive and insightful feedback. Stijn Eyerman is supported through a postdoctoral fellowship by the Research Foundation–Flanders (FWO). Additional support is provided by the FWO projects G.0255.08 and G.0179.10, the UGent-BOF projects 01J14407 and 01Z04109, the ICT Department of Ghent University, and the European Research Council under the European Community’s Seventh Framework Programme (FP7/2007-2013) / ERC Grant agreement no. 259295.
References [1] A. Bhattacharjee and M. Martonosi. Thread criticality predictors for dynamic performance, power, and resource management in chip multiprocessors. In ISCA, pages 290–301, June 2009. [2] C. Bienia, S. Kumar, J. P. Singh, and K. Li. The PARSEC benchmark suite: Characterization and architectural implications. In PACT, pages 72–81, Oct. 2008. [3] N. Binkert, B. Beckmann, G. Black, S. K. Reinhardt, A. Saidi, A. Basu, J. Hestness, D. R. Hower, T. Krishna, S. Sardashti, R. Sen, K. Sewell, M. Shoaib, N. Vaish, M. D. Hill, and D. A. Wood. The gem5 simulator. Computer Architecture News, 39:1–7, May 2011. [4] S. Che, M. Boyer, J. Meng, D. Tarjan, J. W. Sheaffer, S.-H. Lee, and K. Skadron. Rodinia: A benchmark suite for heterogeneous computing. In IISWC, pages 44–54, Oct. 2009. [5] E. Ebrahimi, C. J. Lee, O. Mutlu, and Y. N. Patt. Fairness via source throttling: A configurable and high-performance fairness substrate for multi-core memory systems. In ASPLOS, pages 335–346, Mar. 2010. [6] P. G. Emma. Understanding some simple processorperformance limits. IBM Journal of Research and Development, 41(3):215–232, May 1997. [7] S. Eyerman, K. Du Bois, and L. Eeckhout. Per-thread cycle accounting in multicore processors. Technical report, Ghent University, 2011. [8] S. Eyerman and L. Eeckhout. Per-thread cycle accounting in SMT processors. In ASPLOS, pages 133–144, Mar. 2009. [9] S. Eyerman, L. Eeckhout, T. Karkhanis, and J. E. Smith. A performance counter architecture for computing accurate CPI components. In ASPLOS, pages 175–184, Oct. 2006. [10] S. Eyerman, L. Eeckhout, T. Karkhanis, and J. E. Smith. A mechanistic performance model for superscalar out-oforder processors. ACM Transactions on Computer Systems (TOCS), 27(2), May 2009. [11] T. Li, A. R. Lebeck, and D. J. Sorin. Spin detection hardware for improved management of multithreaded systems. IEEE Transactions on Parallel and Distributed Systems (TPDS), 17:508–521, June 2006. [12] C. Luque, M. Moreto, F. J. Cazorla, R. Gioiosa, A. Buyuktosunoglu, and M. Valero. ITCA: Inter-task conflict-aware CPU accounting for CMPs. In PACT, pages 203–213, Sept. 2009. [13] O. Mutlu and T. Moscibroda. Stall-time fair memory access scheduling for chip multiprocessors. In MICRO, pages 146– 160, Dec. 2007. [14] C. Tian, V. Nagarajan, R. Gupta, and S. Tallam. Dynamic recognition of synchronization operations for improved data race detection. In Proceedings of the International Symposium on Software Testing and Analysis, pages 143–154, July 2008. [15] S. C. Woo, M. Ohara, E. Torrie, J. P. Singh, and A. Gupta. The SPLASH-2 programs: Characterization and methodological considerations. In ISCA, pages 24–36, June 1995. [16] X. Zhou, W. Chen, and W. Zheng. Cache sharing management for performance fairness in chip multiprocessors. In PACT, pages 384–393, Sept. 2009.