Statistical Class Separation using sEMG Features Towards Automated Muscle Fatigue Detection and Prediction M.R. Al-Mulla, F. Sepulveda, M. Colley F. Al-Mulla*
[email protected] [email protected] [email protected] [email protected] Department of Computer Science, University of Essex, Colchester, Essex, UK *Department of Pathology, Faculty of Medicine, Kuwait University Abstract Surface Electromyography (sEMG) activity of the biceps muscle was recorded from ten subjects. Data was recorded while subjects performed isometric contraction until fatigue. The signals were segmented into three parts (Non-Fatigue, Transition-to-Fatigue and Fatigue), assisted by a fuzzy classifier using arm angle and arm oscillation as inputs. Nine features were extracted from each of the three classes to quantify the potential performance of each feature, that could aid in differentiating the three classes of muscle fatigue within the sEMG signal. Percent change was calculated between Non-Fatigue and Transition-to-Fatigue and also between Transition-toFatigue and Fatigue classes. Estimation of relative class overlap using Partition Index approach was used showing features that can best distinguish between the three classes and quantifying class separability. Results shows that the selected dominant frequency best discriminate between the classes, giving the highest average percent change of 159.37% and 64.75%. Partition Index showed small values confirming the percent change calculations.
1. Introduction Research into the detection of localized muscle fatigue of surface electromyography (sEMG) is mainly focused on differentiating two classes, the non-fatigue and fatigue. Such studies on muscle fatigue during isometric contraction have established typical sEMG readings when conducted in controlled settings. Changes in sEMG amplitude and centre frequency were studied [1]. The authors found a decrease in the centre frequency of the spectrogram of all the muscle
groups. Research in this field also shows that a development in muscle fatigue correlates with changes in amplitude and median frequency (MDF) [2]. Atieh et al. [3] tried to design more comfortable car seats by identifying and classifying sEMG signals using data mining techniques and statistical analysis to determine sEMG localized muscle fatigue. Kumar et al. have discussed the effectiveness of the using wavelet transform to identify muscle fatigue on EMG signals [4]. We have previously conducted a study aimed at classifying the three fatigue classes using Genetic programming (GP), where the evolved solution was able to classify the unseen sEMG signal to an average of 83.17% accuracy in ten different individuals [5]. In this study, the possibility of detecting three stages of muscle fatigue (Non-Fatigue, Transition-toFatigue and Fatigue) was investigated. It is important to note that the ability to successfully classify the transition-to-fatigue stage within the sEMG will have tremendous benefits in predicting muscle fatigue before it takes place. Our research focused on acquiring the sEMG, subsequently segmenting them into three segments. The segmentation was assisted by a fuzzy classifier that utilised arm angle and arm oscillation as inputs to classify muscle fatigue. Nine features were tested against the three classes for all ten participants. The percent change has been calculated between Non-Fatigue and Transition-to-Fatigue and also between Transition-to-Fatigue and Fatigue classes. Estimating the relative class overlapping between Non-Fatigue and Transition-to-Fatigue and between Transition-to-Fatigue and Fatigue classes was tested with the Partition Index approach [6] to show features that best distinguish and quantify class separability.
2. Methods and Materials In the first part of this research an experimental study was conducted to record sEMG emanating from the biceps brancii muscle. The second part involved segmenting the sEMG signal into three segments by using the arm angle and arm oscillation into a fuzzy classifier. In the third part we used the nine extracted features to differentiate between the three fatigue stages (Non-Fatigue, Transition-to-Fatigue and Fatigue).
2.1 sEMG recording and pre-processing The data were collected from ten athletic, healthy subjects (mean age 27.5 +/- 3.6 yr), and non-smokers. The ten participants were willing to reach physical fatigue state but not a psychological one. The participants were seated on a preacher curl machine to ensure stability and biceps isolation. Steps in the test bed set up: sEMG electrodes were placed on the participant’s Biceps branchi belly to acquire sEMG reading. Goniometer was placed on the side of the arm to measure the elbow angle and arm oscillation. The participant had a display placed in front of them which indicates the angle of the arm. The weight was handed to the participant at 90 deg elbow angle. Participants were asked to maintain the 90 deg angle. Participants stopped when they reach total biceps fatigue. All participants carried out isometric exercises with 40% Maximum Voluntary Contraction (MVC). The myoelectric signal was recorded using two channels; Double Differential (DD) recording equipment at 2000Hz sampling rate. The sEMG signals acquired from the experiment went through a rectification and filtering process. The signals were filtered with a dual pass Butterworth filter, with the fifth order band positioned between 1 and 500Hz. The Goniometer readings were also recorded simultaneously. The reading of the Goniometer was then correlated with the sEMG signal to ensure that fatigue resides within the sEMG. The Goniometer provided a reliable indication on the development of fatigue; Classical biceps muscle fatigue for the clinically healthy individuals usually manifest itself by small oscillation or vibrations followed by a difficulty in maintain a task, in our case the 90deg elbow angle. For each of the ten participants three trials were
carried out, providing 30 trials in total. There was a resting period of one week between each of the three trials.
2.2 sEMG segmentation In segmenting the sEMG only the physical aspects such as drop in the arm angle and oscillation of the arm was considered as they are the most reliable indicators of fatigue [7] and can correctly classify the signals. In our case the Goniometer signal contains (arm angle and arm oscillation) the physical manifestation of fatigue (Non-Fatigue, Transition-toFatigue and Fatigue). Here, we used the fuzzy classifier that had two inputs: Angular position of the arm provided by the Goniometer (0 to 180 degrees); Below 90 deg indicates fatigue. Arm oscillations Provided also by the Goniometer (+/- 5 deg); An increase of oscillation indicates transition-to fatigue. The above fuzzy classifier inputs when used in conjunction was found to assist in finding the boundaries of the classes. Both inputs were used to define a 6 rule type-1 fuzzy classifier; using both triangular and trapezoidal antecedents and product inference. As with all fuzzy classifiers only a single label was chosen as the final output to help in the classification.
2.3 Feature Extraction There are three classes of sEMG (Non-Fatigue, Transition-to-Fatigue and Fatigue). These classes relate to the status of the muscle and each class will produce different features. The features were extracted by using the methods described in the following subsections, which are relevant to sEMG analysis and some are widely used in this field [8]. It is important to note that each class of the sEMG signal was split into one second interval to enable the feature extraction processes. This research has used all the features described in the following sections, including two features established in this study that used a selected frequency band. The features helped in acquire the results, enabling discrimination between the classes. Several of these features have been used in previous studies to extract fatigue on EMG. 2.3.1 Instantaneous median frequency. The spectral frequency can be redefined to contain time dependence of the signals frequency content [9], and time dependence can be referred to as the instantaneous frequency. The Instantaneous Median Frequency was
introduced by Roy et al. [10] who depicted the following formula where t is time, P is Power spectrum density function, w is the window size and d is the depth of the signal.
2.3.2 Median frequency. There is a large amount of data in the power spectrum, making it difficult to analyze. Median Frequency is an index used in studies of spectral shifts. We can define the median frequency as “the frequency which divides the power spectrum in two parts with equal areas” [11a]. In a power spectrum we are looking at the median power frequency, which is based on a continuous distribution where the median is used in statistical terms. 2.3.3 Regression analysis.. Regression statistics was used when performing an analysis where the independent variable is known, in order to predict the dependent variable. Autoregressive (AR) model is a random process used in statistics and signal processing to model and predict natural phenomena. However, the regression analysis in this study was only used for analysis purposes. Hefftner et al. [12] discussed the AR model and used it for EMG feature discrimination because of its computational speed. 2.3.4 Higher-order statistics. The characteristics and nature of a random process can be analyzed and interpreted by using a technique called Higher-order statistics (HOS). This technique, introduced in the 1960s and applied since the 1970s, is based on the probability theory. Studies on sEMG used this statistical method to estimate the amplitude and the number of newly MUAPs (Motor Unit Action Potential), as proposed by Kanosue et al [13]. 2.3.5 Root mean square. “The root mean square (RMS) value of an AC signal is the total value of the quantity. It measures the electrical power in the signal” [11b]. Basmajian & DeLuca [14] encouraged the use of this process in analyzing the EMG signal since the value of the RMS produces the moving average. 2.3.6 Wavelet Analysis. By using a Wavelet function (WF), which is a basis function, the wavelet transform (WT) can decompose a signal into numerous multiresolution components [4]. This function, being both dilated and translated in time, undertakes a twodimensional cross correlation with the time domain
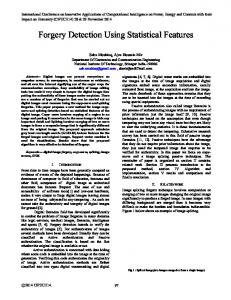
sEMG signal. This is a mathematical function used as a mean to detect and characterize short time component within a non-stationary signal, providing information regarding the signal’s time frequency. Kumar et al. [4] stated that Short Fourier Transform (SFT) does not implement an optimal time or frequency resolution for the non-stationary signal, although the relatively short time windows may trace spectral variations with time. The wavelet transform, composing of numerous WF, can be used to decompose sEMG. The output of the power transform domain is calculated and thus functions as a deciding parameter in choosing the WF, which gives the highest contrast between sEMG cases. That research showed that it is possible to detect muscle fatigue status by determining the Sym4 or Sym5 wavelet function and decomposing the signal at level 8 and 9 (out of 10 levels). However in this study we decomposed the signal using only Sym4 which, due to the sampling frequency we used, was best used to decompose the signal at level 5. 2.3.7 Total band power of sEMG. The total band power of the sEMG was estimated using Welch’s method. This method was used in several sEMG fatigue analysis [15] and proves to be useful in the broad sense. However, in this study we attempted to narrow the frequency bands to directly relate to sEMG fatigue, as will be shown in the next section. 2.3.8 Selected sEMG frequency bands. The fuzzy classifier described in section 2.2 classified the sEMG based on the physiological characteristics of muscle fatigue (drop in arm angle and arm oscillation). The same criteria (drop in arm angle and arm oscillation) that was used by the fuzzy classifier served by directly finding the correlation coefficient with each individual frequency starting from 1Hz to 450Hz which are the sEMG dominant frequencies. Fig 1 shows one example of the fuzzy classifier criteria correlated with sEMG frequencies.
Figure 1: Correlation of fatigue with sEMG frequencies
The above process has been repeated for all the 30 trials and frequencies that showed high correlation, repeated regularly were manually selected (12Hz,15Hz,20Hz, 23Hz 28, 31Hz, 42Hz, 53Hz, 57Hz, 61Hz, 63Hz, 68Hz, 74Hz.) for further feature extractions.
Dominant frequency of selected Band. This feature finds dominant frequency within a band (estimated using Welch's method) of the selected frequency band. For this feature a frequency band of 19hz to 46hz has been selected (as they repeated most frequently) .
RMS amplitude of selected band The Root Mean Square was used to find the magnitude of the signal only on the selected Frequency bands mentioned above (19hz to 46hz).
2.4 Clustering and class separability. Clustering is generally considered an unsupervised algorithm for clustering heterogeneous population into a set of homogenous group of classes. This strategy does not ensure grouping similar classes together. Al-Harbi & Rayward-Smith [16] modified the k-means clustering algorithm to act as a classifier algorithm, which could enable grouping of known classes using the k-means (Supervised k-means). This technique was partially used in this study to visualize the three different classes (Non-Fatigue, Transition-to-Fatigue and Fatigue) and mainly to produce an index for measuring class separability. The Partition index (Sc) [6] method was used in this study to validate the classes according to the formula shown below.
where µi , k is the membership data point in cluster i. The partition index is considered the ratio of the sum of both the compactness and the separation of clusters. A lower value of SC indicates improved partition.
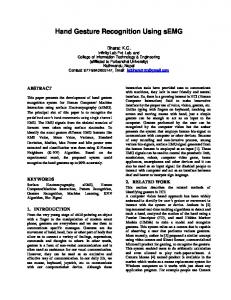
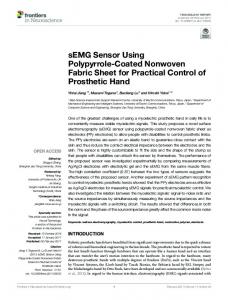
3. Results and discussion Fig. 2 and 3 present the initial results of the experiment showing the average percentage change of all the nine features between "Non-Fatigue and Transition-to-Fatigue." It also displays the percent
change between" Transition-to-Fatigue and Fatigue" for all subjects (30 trials in total).
Figure 2: Non-Fatigue and Transition-toFatigue percentage change for all 30 trials
Figure 3: Transition-to-Fatigue and Fatigue percentage change for all 30 trials Table 1: Average change for all trials between Non-Fatigue and Transition-to-Fatigue
Table 3: Partition index between Non-Fatigue and Transition-to-Fatigue for one trial
Table 2: Average change for all trials between Transition-to-Fatigue and Fatigue
Table 4: Partition index between Transitionto-Fatigue and Fatigue for one trial
Table 1 and 2 shows a summary of Fig. 2 and 3. By a closer study of the data, an initial examination indicates a clear separation between the three classes (Non-Fatigue, Transition-to-Fatigue and Fatigue) regardless of the feature in use. Inspecting each feature unfolds greater understanding on the feature's general behaviour in separating the classes, for example the selected dominant frequency feature in Table 1 shows the highest percent change, which is also exhibited in Table 2. Table 3 and Table 4 shows the cluster validity index (Partition index) for a single trial (other trials exhibit similar values of separation with a maximum of 3). It is important to note that the lower the values in this index the better is the separation of the two clusters. It can be seen from Table 3 that the Root Mean Square (RMS) had the lowest value in this particular case. As shown in Table 4 the median frequency had the best class separation, although several other values are very similar and can be considered as good indicators for fatigue recognition purposes.
These results also show that when classifying sEMG muscle fatigue a middle class should be considered, such as the one proposed here (Transition-to-Fatigue class). Clearly separability between Non-Fatigue class and Transition-to-Fatigue class is present, which Table 1 displayed with high average percent change. While Table 2 shows Transition-to-Fatigue class and Fatigue class exhibiting plausible average percent change. Table 3 and Table 4 shows good separation between the classes giving a strong sign that Transition-to-Fatigue class should be acknowledged.
4. Conclusion This study differentiated between the proposed three classes of fatigue (Non-Fatigue, Transition-to-Fatigue and Fatigue). When class one (Non-Fatigue) along with class two (Transition-to-Fatigue) are compared and subsequently the comparison of class two with class three (Fatigue) show a clear discrimination between both comparisons as demonstrated in the results. Clearly this discrimination indicates that
another class must reside in between them and we propose to name it Transition-to-Fatigue class. The Transition-to-Fatigue class can be used in the prediction of biceps brancii muscle fatigue which will serve in the future when we automate the processes of predicting muscle fatigue in real time. Results of the selected dominant frequency feature was also positive, giving the best percentage change out of the other feature extraction methods indicating that these frequencies mentioned should be investigated further.
5. References [1] J.S. Petrofsky, R.M. Glaser, C.A. Phillips, A.R. Lind, and C. Williams, "Evaluation of the amplitude and frequency components ofthe surface EMG as an index of muscle fatigue", Ergonomics,1982, 25, pp. 213-23. [2] M. Hagberg, "Work load and fatigue in repetitive arm elevations", Ergonomics, 1981, 24, pp. 543-55.
isometric contraction", MSc Dissertation, University of Essex, 2006. [8] M.B.I. Raez, M.S. Hussain, and F. Mohd-Yasin, "Techniques of EMG signal analysis: detection, processing, classification and applications', Biological Procedures Online , 2006, 8, 163. [9] S. Karlsson, J. Yu, and M. Akay, "Enhancement of Spectral Analysis of Myoelectric Signals During Dynamic Contractions: A Comparative Study", IEE Trans BME, 2000, 46, pp. 228-38 [10] S.H. Roy, P. Bonato, and M. Knaflitz, '"EMG Assessment of Back Muscle Function During Cyclical Lifting", J Electromyogr Kinesiol,1998, 8, pp. 233-45. [11a] Kumar, S. and A. Mital, Electromyography in Ergonomics, Taylor & Francis Ltd., London, 1996. (p 170) [11b] Kumar, S. and A. Mital, Electromyography in Ergonomics, Taylor & Francis Ltd., London, 1996. (p 31) [12] G. Hefftner, W. Zucchini, G. Jaros, "The
[3] M. Atieh, R. Youn`es, M. Khalil and H. Akdag, “Classification of the car seats by detecting the muscular fatigue in the EMG signal”, Journal of Computational Cognition, Dec 2005, Vol. 3, No. 4.
electromyogram (EMG) as a control signal for functional neuro-muscular stimulation part 1: Autoregressive modeling as a means of EMG signature discrimination", IEEE Trans Biomed Eng., 1988, 35, pp. 230–237
[4] D.K. Kumar, N.D. Pah, and A. Bradley, "Wavelet analysis of surface electromyography to determine muscle fatigue", IEEE Trans Neural Syst Rehabil Eng. 2003;11(4):400–406.
[13] K. Kanosue, M. Yoshida, K. Akazawa, K. Fujii, "The number of active motor units and their firing rates in voluntary contraction of human brachialiis muscle", Japan J Physiol. 1979;29(4), pp. 427–443.
[5] M. R. Al-Mulla, F. Sepulveda, M. Colley and A. Kattan, "Classification of localized muscle fatigue with Genetic Programming on sEMG during isometric contraction", IEEE conference paper, 2009.
[14] Basmajian J. and C.J. DeLuca (1985) Muscles Alive: Their function Revealed by Electromyography, Williams & Wilkins, Baltimore, USA, (1985).
[6] A.M. Bensaid, L.O. Hall, J.C. Bezdek, L.P. Clarke, M.L. Silbiger, J.A., Arrington, and R.F. Murtagh, "Validityguided (Re)Clustering with applications to image segmentation", IEEE Transactions on Fuzzy Systems, 1996, 4, pp. 112-123. [7] M.R. Al-mulla, “Myoelectrical signal analysis on localised muscle to detect muscle fatigue during sustained
[15] M. Cifrek, V. Medved, S. Tonković, S. Ostojić, "Surface EMG based muscle fatigue evaluation in biomechanics', Clinical Biomechanics, 24, 4, pp. 327-340. [16] S.H. Al-Harbi, and V.J. Rayward-Smith, "Adapting kmeans for supervised clustering", Applied Intelligence, 2006, 24(3), pp. 219-226.