1
STATISTICAL REASONING LEARNING ENVIRONMENT1 Dani Ben-Zvi2
Abstract This article describes a model for an interactive inquiry-based statistics learning environment that is designed to develop students’ statistical reasoning. This model is called a “Statistical Reasoning Learning Environment” (SRLE) and is built on the socio-constructivist theory of learning and teaching. This model is based on six principles of instructional design: fundamental statistical ideas, motivating real data sets, inquiry- and data-based classroom activities, innovative technological tools, classroom norms, and alternative assessment. Two examples of SRLEs are briefly discussed. Keywords Community of Learners; Socio-Constructivism; Statistical Reasoning; Statistics Learning Environment; Student-Centered Classroom; Teaching and Learning Statistics.
Resumo Este artigo descreve um modelo para um ambiente investigativo e interativo de aprendizagem estatística, que é projetado para desenvolver o raciocínio estatístico de alunos. Esse modelo é chamado de "Statistical Reasoning Learning Environment" (SRLE) e é construído com base na teoria sócio-construtivista de ensino e aprendizagem. Esse modelo é baseado em seis princípios de design instrucional: ideias fundamentais de Estatística, conjuntos de dados reais motivadores, atividades de sala de aula de investigação baseada em dados, ferramentas tecnológicas inovadoras, normas da sala de aula e avaliação alternativa. Dois exemplos de SRLE são brevemente discutidos. Palavras-chave Comunidade de aprendizes; Sócio-Construtivismo; Raciocínio Estatístico; Ambiente de Aprendizagem Estatística; Sala de Aula Centrada no Aluno; Ensino e Aprendizagem de Estatística.
1
This article was presented in the 2011 Inter-American Conference of Statistics Education (Recife, Brazil) and is based on ideas developed and tested in collaboration with Joan Garfield (
[email protected], University of Minnesota, USA) that are fully presented in Garfield and Ben-Zvi's book (2008). 2 The University of Haifa, Israel.
EM TEIA – Revista de Educação Matemática e Tecnológica Iberoamericana – vol. 2 - número 2 - 2011
2
The Challenge of Learning and Teaching Statistics Statistics education has been the focus for researchers in many disciplines, perhaps because statistical reasoning is used in many disciplines and in daily life, and provides so many interesting challenges. A majority of these research studies (see Garfield & Ben-Zvi, 2007) suggest different pedagogy than traditional lectures and testing, which is how most current statistics teachers learned this subject themselves. Leaving that familiar method to try active learning techniques can be quite challenging. This article presents a model for an interactive statistics learning environment that is designed to develop students’ statistical reasoning at all levels. This model is called a “Statistical Reasoning Learning Environment” (SRLE) and is built on the socio-constructivist theory of learning.
Building on Socio-Constructivist Principles of Learning The basis of this model and its theoretical foundation lie in the socioconstructivist paradigm. The origins of this paradigm are in Piaget’s constructivism, claiming that learning is an active process in which learners construct their own understanding and knowledge by making connections between new information and past experiences, beliefs and knowledge rather than by receiving knowledge (e.g., Cobb, 1994; Piaget, 1972, 1978). The socio-constructivist epistemology extends Piaget's theory by emphasizing the socio-cultural aspects of the learning process and the important role of social interaction and cultural artifacts in constructing one's learning (Vygotsky, 1978). The implication of the socio-constructivist theories of learning is that good instructional practice consists of designing and implementing learning environments that stimulate students to actively construct knowledge in a community of learners (Brown & Campione, 1994). Students' statistical reasoning is nurtured by statistical knowledge, knowledge about the problem context, and useful social norms and habits developed over time, and supported by an inquiry-based environment including activities, tools and scaffolds (Makar, Bakker, & Ben-Zvi, 2011). In particular, this involves activities that provide students many opportunities to think EM TEIA – Revista de Educação Matemática e Tecnológica Iberoamericana – vol. 2 - número 2 - 2011
3
and reflect on their learning, as well as discussing and reflecting with their peers. It does not mean that teachers should never “tell” students anything directly and instead should always allow them to construct knowledge for themselves. Rather it means that learning is enhanced when teachers pay attention to the knowledge and beliefs that learners bring to a learning task, use this knowledge as a starting point for new instruction, and monitor students’ changing conceptions as instruction proceeds. It is usually easier to prepare a lecture than it is to design a learning environment, where students engage in activities and discussions and/or collaborative projects, supported by technological tools. While the first approach is teacher centered: “what is it I want to tell my students,” “what material do I want to cover,” etc., the second approach is more student-centered: “what can I do to promote students learning,” “how can I engage students in learning, hands-on activities, developing reasoning, discussing ideas, working in teams,” etc. According to this latter approach, the teacher is cast as an instructional coach or a facilitator, rather than as a conduit of knowledge in a teacher-centered classroom. The main reason to change from a teacher-centered to a student-centered approach is that the second approach is more effective in helping students build a deeper understanding of statistics and to be able to transfer what they have learned in subsequent classes or in the real world. One problem with the “teaching is telling” approach is that students rarely have a chance to develop a deep understanding of what they have “learned,” and quickly forget it after they complete a course.
A Statistical Reasoning Learning Environment The Statistical Reasoning Learning Environment (SRLE) is an effective and positive statistics learning environment that develops in students a deep and meaningful understanding of statistics and helps students develop their ability to reason statistically (Garfield & Ben-Zvi, 2008). This approach is called a learning environment because it is the interactive combination of text materials, class activities, norms and culture, scaffolds, discussion, technology, teaching approach,
EM TEIA – Revista de Educação Matemática e Tecnológica Iberoamericana – vol. 2 - número 2 - 2011
4
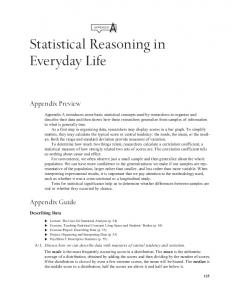
and assessment. This model is based on six principles of instructional design described by Cobb and McClain (2004) (Figure 1): 1. Focus on developing understanding of fundamental statistical ideas rather than on presenting set of statistical tools and procedures. 2. Use real and motivating data sets to engage students in making and testing conjectures and statistical inferences. 3. Use collaborative inquiry-based classroom activities to support the development of students’ reasoning. 4. Integrate the use of appropriate technological tools that allow students to test their conjectures, explore and analyze data interactively. 5. Promote classroom norms that include statistical discourse and arguments that focus on significant statistical ideas. 6. Use alternative assessment methods to learn what students know and how their statistical learning develops, and to evaluate instructional plans and progress.
Figure 1: Six key elements of the Statistical Reasoning Learning Environment (SRLE).
EM TEIA – Revista de Educação Matemática e Tecnológica Iberoamericana – vol. 2 - número 2 - 2011
5
1. Focus on Developing Conceptual Understanding of Fundamental Statistical Ideas The recent plethora of research in statistics education as well as articles by some prominent statisticians on the necessity to reform teaching approaches in statistics have led to a paradigm shift in the conceptualization of statistics teaching. This paradigm shift evolved mainly from technology developments and the identification and promulgation of the characteristics of statistical thinking and the “big ideas” underpinning statistics (e.g., Moore, 1990; Wild & Pfannkuch, 1999). The explication and exploration of these ideas by researchers have contributed to teaching approaches that emphasize Exploratory Data Analysis (EDA), attention to building students’ conceptual understandings, and curricula that aim to develop students’ reasoning, thinking, and literacy (Ben-Zvi & Garfield, 2004; Garfield & BenZvi, 2008). There are several fundamental statistical ideas that we would like all students and teachers to understand at a deep conceptual level (Burrill & Biehler, 2011). These ideas serve as overarching goals that direct teaching and motivate and guide students’ learning. These ideas include but are not limited to data, patterns in data (e.g., center), variability, distribution, and inference. While most textbooks present material in a structure based on a logical analyses of the content, students often see the content as a sequential set of tools and procedures and do not see how the concepts are interrelated. For example, learning about distribution early in a course is rarely connected to the ideas of sampling distributions later in a course. Garfield and Ben-Zvi (2008) advocate a focus on these fundamental ideas and the interrelations among them and suggest ways to present them throughout a course, revisiting them in different contexts, illustrating their multiple representations and interrelationships, and helping students recognize how they form the supporting structure of statistical knowledge.
EM TEIA – Revista de Educação Matemática e Tecnológica Iberoamericana – vol. 2 - número 2 - 2011
6
2. Use Real and Motivating Data At the very heart of statistics is recognizing that the main purpose of collecting and investigating data is to learn more about real situations and that data-based evidence is needed for making decisions and evaluating information. However, the soundness of such learning and judgments about real situations depends on understanding data generation, data analysis, and the types of conclusions that can be drawn from data. Data generation includes understanding, for example, how to capture and translate notions such as prompt service into data that can be collected, how to capture measurements that are relevant to the problem situation, and how to design methods of collecting data that avoid bias and measurement error (Pfannkuch & Ben-Zvi, 2011). Data therefore should be the focus for statistical learning as well (Franklin and Garfield, 2006). Throughout a course, students need to consider methods of data collection and production and how these methods affect the quality of the data and the types of analyses that are appropriate. Interesting real data sets motivate students to engage in activities, especially ones that ask them to make conjectures about a data set before analyzing it. For further discussion of the role and challenges of engaging teachers and students with real data see Hall (2011).
3. Use Classroom Activities to Develop Students’ Statistical Reasoning An important part of the SRLE is the use of carefully designed, researchbased activities that promote student learning through inquiry, collaboration, interaction, discussion, data, and interesting problems (e.g., Bransford, Brown, & Cocking, 2000). The positive effects of active learning have been found for short-term mastery, long-term retention, or depth of understanding of course material; acquisition of critical thinking or creative problem-solving skills; formation of positive attitudes toward the subject being taught, and level of confidence in knowledge or skills (e.g., McKeachie & Svinicki, 2010). There are at least two different models of class activities in the SRLE. The first engages students in making conjectures about a problem or a data set. This method EM TEIA – Revista de Educação Matemática e Tecnológica Iberoamericana – vol. 2 - número 2 - 2011
7
involves discussing students’ conjectures, gathering or accessing the relevant data, using technology to test their conjectures, explaining the results, and then reflecting on their own actions and thoughts. The second type of activity is based on collaborative learning, where two or more students are given questions to discuss or a problem to solve as a group. For more examples of collaborative learning in statistics, see Roseth, Garfield and Ben-Zvi (2008).
4. Integrate the Use of Appropriate Technological Tools There are a variety of technological tools to support development of student understanding and reasoning (e.g., computers, graphing calculators, Internet, statistical software, and Web applets). Students no longer have to spend time performing tedious calculations and can focus instead on the more important task of learning how to choose appropriate analytic methods and how to interpret results. Technological tools are used not only to generate statistics, graph data, or analyze data, but also to help students visualize concepts and develop an understanding of abstract ideas through simulations. For examples of innovative tools and ways to use these tools to help develop students’ reasoning, see Chance, Ben-Zvi and Garfield (2007), and Biehler, Ben-Zvi, Bakker and Maker (in press). 5. Promote Classroom Discourse Traditional statistics classes usually did not have much discourse, “giving” information through lectures and asking questions to “get” some answers. This is different from the kind of dialogue where students respond to each other’s questions and learn to question each other as well as defend their answers and arguments. In the SRLE, the use of activities and technology allows for a new form of classroom discourse. Cobb and McClain (2004) describe the characteristics of effective classroom discourse in which statistical arguments explain why the way in which the data have been organized gives rise to insights into the phenomenon under investigation; students engage in sustained exchanges that focus on significant statistical ideas.
EM TEIA – Revista de Educação Matemática e Tecnológica Iberoamericana – vol. 2 - número 2 - 2011
8
More generally, in developing statistical reasoning, students need to be taught to be disciplined in reasoning with knowledge they gather from context and data, i.e., they need to develop a set of norms for using statistical concepts in context-rich problems, including being explicit about the evidence on which their claims rely. This means that learning has to take place within normative practices (e.g., Cobb & Yackel, 1996; Yackel & Cobb, 1996). In classrooms, teachers have an important role in establishing socio-statistical norms that regulate students’ reasoning. Such norms, which take much time to develop, include, for example, what counts as valid in statistical reasoning (Makar et al., 2011) It can be very challenging to create a SRLE with classroom discourse that enables students to engage in discussions in which significant statistical issues emerge and where arguments are presented and their meaning is openly negotiated. Some suggestions for developing classroom discourse include: a) Use questions that encourage students to speculate and think and do not necessarily have one right answer. b) Require students to explain their reasoning and justify their answers. Then ask other students if they agree or disagree and why. c) Create a classroom norm where students feel safe expressing their views, even if they are tentative. This can be done if teacher encourage students to express their conjectures, and asking other students to comment on these conjectures, and allowing students to test some of these conjectures using tools and software, rather than telling them whether they are right or wrong. For more information and practical advice about leading and managing discussions, see McKeachie and Svinicki (2010), and about the promoting explanations in developing students' statistical reasoning see Gil and Ben-Zvi (2011).
6. Use Alternative Assessment In recent years, many alternative forms of assessment are used in statistics classes. In addition to quizzes, homework and exams, many teachers use student's statistical projects as a form of authentic assessment. Other forms of alternative assessment are also used to assess students’ statistical literacy (e.g., critique a
EM TEIA – Revista de Educação Matemática e Tecnológica Iberoamericana – vol. 2 - número 2 - 2011
9
graph in a newspaper), their reasoning (e.g., write a meaningful short essay), or provide feedback to the teacher (e.g., minute papers) (Garfield & Franklin, 2011). Assessments need to be aligned with learning goals, focusing on understanding key ideas and not just on skills, procedures, and computed answers. This can be done with formative assessments used during a course (e.g., quizzes, small projects, or observing and listening to students in class) as well as with summative evaluations (course grades). Useful and timely feedback is essential for assessments to lead to learning. Types of assessment may be more or less practical in different types of courses. However, it is possible, even in large classes, to implement good assessments. The ARTIST Website (https://app.gen.umn.edu/artist) offers an item bank of more than a thousand items that have been designed to measure students’ statistical literacy, reasoning and thinking, many of which are in forced choice format but provide examples of more reasoning-based items.
Examples of SRLE Learning Environments To better understand the SRLE approach, I provide two examples of learning environments, the first is a high school or tertiary introductory statistics class, while the second is a primary school learning environment. SRLE in high school or university In a SRLE introductory statistics class, the students know that they have to prepare for class by reading a few pages in the textbook using study questions to guide their reading and note taking. Students are therefore prepared to come to class with a preliminary exposure to words and techniques. Class begins with a short summary of what was learned in the previous class, and students are asked if they have questions on the previous class or on the assigned reading. Students ask some questions that are answered by other students and/or the teacher. The teacher rarely answers a question directly but often asks students, “What do you think?” and if another student gives an answer asks, “Do you agree with this answer? Why?” Now the class is ready to begin the first activity. A question is given to the students such as “Do you think that female college students spend more time on cell
EM TEIA – Revista de Educação Matemática e Tecnológica Iberoamericana – vol. 2 - número 2 - 2011
10
phones than male students?” Additional questions are asked such as “What are typical amounts of time students spend per call on their cell phones?” or “What type of distribution would you expect to see for cell phone usage?” Students form small groups to discuss these questions and sketch possible distributions, and then share and compare their conjectures and reasoning with the class. The students move to computers and access a data set containing this information that has previously been gathered about the students in the class using an online student survey. Working in pairs, students generate graphs and statistics to answer the questions on cell phone use. Students may discuss appropriate measures of center and spread for the data, revisiting those ideas from previous lessons. They may notice outliers in the data and discuss what to do: How to find out if they are legitimate values or errors, what happens to the graphs and statistics if those extreme values are removed? The teacher’s role in this class is to present the problem, guide the discussion, anticipate misconceptions or difficulties in reasoning, make sure students are engaged and on task and not experiencing any difficulties. The teacher has to know when to end discussions, when to correct mistakes, and how to provide a good summary for the activity using the work students have done, so students can appreciate what they learned from the activity. At the end of class, after the wrap-up discussion and summary, students may be asked to complete a brief assessment task, providing the teacher with feedback on their learning for that class.
SRLE in primary school The Connections Project (Ben-Zvi, 2006; Ben-Zvi, Gil, & Apel, 2007) is an example of a project implementing SRLE in a science-focused primary school in Israel. The project extends for five weeks of six hours per week each year (Grades 46) during which students actively experience some of the processes involved in experts’ practice of data-based inquiry. Students conduct real data investigations through peer collaboration and classroom discussions using TinkerPlots (Version 1.0, Konold & Miller, 2005), a computer tool for dynamic data exploration. By playing a major role in helping students learn new ways of representing data and develop statistical reasoning, TinkerPlots gradually becomes a thinking tool for these
EM TEIA – Revista de Educação Matemática e Tecnológica Iberoamericana – vol. 2 - número 2 - 2011
11
students; it scaffolds their ongoing negotiations with data, statistical ideas, inferences and their meanings. Summary It is apparent that even an eager and enthusiastic teacher who wants to move from a more traditional approach to a more SRLE approach is faced with many challenges. These challenges include students, colleagues, and institution, as well as challenges inherent in teachers. These challenges are examined and addressed in Garfield and Ben-Zvi (2008). The first step in moving towards the SRLE is to see how one’s current course and materials align with the components of a SRLE and then pick a starting point. For some sample activities see the AIMS Website (http://www.tc.umn.edu/~aims). Careful and steady change over a period of time may lead to a successful implementation of a SRLE in a statistics course, rather than trying a radical, all at once change. A Statistical Reasoning Learning Environment is quite different than a traditional lecture-based classroom, but it may also be quite different from many statistics classes that use some activities, real data sets, and technology tools. The six principles of SRLE are key elements in developing a learning environment where students are engaged in making and testing conjectures using data, discussing and explaining statistical reasoning, and focusing on the important fundamental ideas of statistics.
References Ben-Zvi, D. (2006). Scaffolding students’ informal inference and argumentation. In A. Rossman, & B. Chance (Eds.), Proceedings of the Seventh International Conference on Teaching Statistics [CD]. Voorburg, The Netherlands: International Association for Statistics Education. Ben-Zvi, D., & Garfield, J. (Editors) (2004). The challenge of developing statistical literacy, reasoning, and thinking. Dordrecht, the Netherlands: Kluwer Academic Publishers. Ben-Zvi, D., Gil, E., & Apel, N. (2007). What is hidden beyond the data? Helping young students to reason and argue about some wider universe. In D. Pratt, & J. Ainley (Eds.), Reasoning about informal statistical inference: A collection of current
EM TEIA – Revista de Educação Matemática e Tecnológica Iberoamericana – vol. 2 - número 2 - 2011
12
research studies. Proceedings of the Fifth International Forum for Research on Statistical Reasoning, Thinking, and Literacy. Biehler, R., Ben-Zvi, D., Bakker, A., & Makar, K. (in press). Technological advances in developing statistical reasoning at the school level. In A.J. Bishop, M.A. Clement, C. Keitel, J. Kilpatrick and F.K.S. Leung, (Eds.), Third international handbook on mathematics education. New York: Springer. Bransford, J., Brown, A. L., & Cocking, R. R. (Eds.) (2000). How people learn: Brain, mind, experience, and school. Washington, DC: National Academy Press. Brown, A. L., & Campione, J. C. (1994). Guided discovery in a community of learners. In K. McGilly (Ed.), Classroom lessons: Integrating cognitive theory and classroom practice (pp. 229–270). Cambridge, MA: MIT Press. Burrill, G, & Biehler, R. (2011). Fundamental statistical ideas in the school curriculum and in training teachers. In C. Batanero, G. Burrill, and C. Reading (Eds.), Teaching statistics in school mathematics-challenges for teaching and teacher education (A Joint ICMI/IASE Study, The 18th ICMI Study) (pp. 57-69). Springer. Chance, B., Ben-Zvi, D., Garfield, J., & Medina, E. (2007, October). The role of technology in improving student learning of statistics. Technology Innovations in Statistics Education Journal, 1(1). Retrieved October 19, 2011, from http://repositories.cdlib.org/uclastat/cts/tise/vol1/iss1/art2/ Cobb, P. (1994). Where is the mind? Constructivist and sociocultural perspectives on mathematical development. Educational Researcher, 23(7), 13-20. Cobb, P., & McClain, K. (2004). Principles of instructional design for supporting the development of students’ statistical reasoning. In D. Ben-Zvi & J. Garfield (Eds.), The challenge of developing statistical literacy, reasoning, and thinking (pp. 375–396). Dordrecht, The Netherlands: Kluwer Academic Publishers. Cobb, P., & Yackel, E. (1996). Constructivist, emergent, and sociocultural perspectives in the context of developmental research. Educational Psychologist, 31(3/4), 175-190. Franklin, C., & Garfield, J. (2006). The Guidelines for Assessment and Instruction in Statistics Education (GAISE) project: Developing statistics education guidelines for pre K-12 and college courses. In G.F. Burrill, (Ed.), Thinking and reasoning about data and chance: Sixty-eighth NCTM Yearbook (pp. 345-375). Reston, VA: National Council of Teachers of Mathematics. Garfield, J., & Ben-Zvi, D. (2007). How students learn statistics revisited: A current review of research on teaching and learning statistics. International Statistical Review, 75(3), 372–396. Garfield, J., & Ben-Zvi, D. (2008). Developing Students’ Statistical Reasoning: Connecting Research and Teaching Practice. Dordrecht, The Netherlands: Springer. Garfield, J., & Franklin, C. (2011). Assessment of learning, for learning, and as learning in statistics education. In C. Batanero, G. Burrill, and C. Reading (Eds.), Teaching statistics in school mathematics-challenges for teaching and teacher education (A Joint ICMI/IASE Study, The 18th ICMI Study) (pp. 133–145). Springer.
EM TEIA – Revista de Educação Matemática e Tecnológica Iberoamericana – vol. 2 - número 2 - 2011
13
Gil, E., & Ben-Zvi, D. (2011). Explanations and context in the emergence of students' informal inferential reasoning. Mathematical Thinking and Learning, 13(1), 87-108. Hall, J. (2011). Engaging teachers and students with real data: Benefits and challenges. In C. Batanero, G. Burrill, and C. Reading (Eds.), Teaching statistics in school mathematics-challenges for teaching and teacher education (A Joint ICMI/IASE Study, The 18th ICMI Study) (pp. 335–346). Springer. Konold, C., & Miller, C. (2005). TinkerPlots. Data analysis software for middle school curricula. Emeryville, CA: Key Curriculum Press. Makar, K., Bakker, A., & Ben-Zvi, D. (2011). The reasoning behind informal statistical inference. Mathematical Thinking and Learning, 13(1), 152-173. McKeachie, W. J., & Svinicki, M. (2010). Teaching tips: Strategies, research, and theory for college and university teachers (13th Edition). Boston: Houghton Mifflin. Moore, D. (1990). Uncertainty. In L. Steen (Ed.) On the shoulders of giants: New approaches to numeracy (pp. 95–137). Washington, DC: National Academy Press. Pfannkuch, M., & Ben-Zvi, D. (2011). Developing teachers’ statistical thinking. In C. Batanero, G. Burrill, and C. Reading (Eds.), Teaching statistics in school mathematics-challenges for teaching and teacher education (A Joint ICMI/IASE Study, The 18th ICMI Study) (pp. 323–333). Springer. Piaget, J. (1972). Science of education and the psychology of the child. New York: The Viking Press. Piaget, J. (1978). Success and understanding. Cambridge MA: Harvard University Press. Roseth, C. J., Garfield, J. B., & Ben-Zvi, D. (2008). Collaboration in learning and teaching statistics. Journal of Statistics Education, 16(1). Retrieved October 19, 2011, from http://www.amstat.org/publications/jse/v16n1/roseth.pdf Vygotsky, L. (1978). Mind in society. Cambridge, MA: Harvard University Press. Wild, C. J., & Pfannkuch, M. (1999). Statistical thinking in empirical enquiry (with discussion). International Statistical Review, 67(3), 223-265. Yackel, E., & Cobb, P. (1996). Sociomathematical norms, argumentation, and autonomy in mathematics. Journal for Research in Mathematics Education, 27, 458477.
EM TEIA – Revista de Educação Matemática e Tecnológica Iberoamericana – vol. 2 - número 2 - 2011