Mar 27, 2006 - ... queries and peer properties of some widely applied P2P systems such as Gnutella and. Kazaa [6, 7, 8, 9]. It has also been reported that node.
[Phys. Rev. E 73, 036123 (2006)]
The Structure of Peer-to-Peer Social Networks Fang Wang 1 , Yamir Moreno 2 , Yaoru Sun
arXiv:physics/0603222v1 [physics.soc-ph] 27 Mar 2006
1
3
Pervasive ICT Research Center, British Telecom, Ipswich IP5 2TX, UK 2 Institute for Biocomputation and Physics of Complex Systems (BIFI), University of Zaragoza, Zaragoza 50009, Spain and 3 Behavioural and Brain Science Centre, School of Psychology, University of Birmingham, Birmingham B15 2TT, UK (Dated: February 2, 2008)
This paper presents a statistical analysis of the structure of Peer-to-Peer (P2P) social networks that captures social associations of distributed peers in resource sharing. Peer social networks appear to be mainly composed of pure resource providers that guarantee high resource availability and reliability of P2P systems. The major peers that both provide and request resources are only a small fraction. The connectivity between peers, including undirected, directed (out and in) and weighted connections, is scale-free and the social networks of all peers and major peers are small world networks. The analysis also confirms that peer social networks show in general disassortative correlations, except that active providers are connected between each other and by active requesters. The study presented in this paper gives a better understanding of peer relationships in resource sharing, which may help a better design of future P2P networks and open the path to the study of transport processes on top of real P2P topologies. PACS numbers: 89.75.Fb,89.20.Hh,89.20.-a
I.
INTRODUCTION
In the last several years, many systems have been analyzed unraveling the way in which their constituents interact which each other. Surprisingly, many seemingly diverse phenomena found in biological, social and technological systems [1, 2, 3, 4] share a complex interaction topology that is in most cases characterized by the existence of a few key nodes that participates in a large number of interactions [1, 2, 3, 4]. This observation is in sharp contrast to previous studies that in order to model the dynamical aspects of biological, social and technological processes assumed a regular or a random distribution of interactions for the system’s units. Obviously, the new approach to the topology of networked systems has important bearings on their dynamics and functioning as have been pointed out during the last few years [1, 2, 3, 4]. A first step is then the characterization of the topological properties in order to get better insights into the dynamics, functioning and new designs of natural and man-made networked systems. Peer-to-Peer (P2P) networks form a kind of open, decentralized overlay network on top of the Internet [2], on which distributed users communicate directly to find and share resources, often music and movie files. These networks may be one of the few largest distributed computing systems ever, and more surprisingly, they can run with great stability and resilient performance in face of possibly the most ferocious dynamics. The number of hosts running on Gnutella was reported to be 1,800,000 in August 2005 [5]. Recent studies have extensively investigated the traffic, shared files, queries and peer properties of some widely applied P2P systems such as Gnutella and Kazaa [6, 7, 8, 9]. It has also been reported that node
connectivity (the number of partners a node interacts with) in Gnutella follows a combination of a power-law distribution (usually for nodes with more than 10 connections) and a quasi-constant distribution (for nodes with fewer connections) [7]. This may be due to the arbitrarily created connections: peers establish connections to others by searching presently available peers on the overlay, in addition to a few links to well known hosts provided by the system. Peer connections in these systems only suggest routes of traffic and usually have no relation to peer properties, e.g., peer interests or resources held by peers. Recent literature proposed P2P social networks, to capture social associations of peers in resource sharing [10]. Similar to human social networks, a P2P social network is a collection of connected computing nodes (peers), each of which is acquainted with some subset of the others. The social connections of peers indicate that a peer is a resource provider or can provide information of resource providers to another peer. Connection strengths imply the acquaintenanceship or utility of a peer to another, i.e., how useful one peer is to another in resource sharing. Although P2P systems become more and more significant in distributed applications, there is little knowledge about how peers are socially connected to function together. Primitive investigation in [10] confirmed that when peers were organized according to their social relationships, (instead of arbitrarily connected links such as those created in Gnutella), the formed P2P networks had obviously improved search speed and success rate. Moreover, the structure of P2P social networks is shown to be directed, asymmetric and weighted. This paper will provide a more comprehensive analysis
TABLE I: Topological properties of three (out of six studied) original and major peer social networks.
N E hki kout kin hkw i kw−out kw−in hwi w Symmetric links hli lmax hci hbi/N
SN1 - original 42186 81083 3.84 0∼4588 0∼312 8.72 0∼28512 0∼7667 2.27 1∼1732 12 5.45 11 0.019
SN5 - original 112921 230500 4.56 0∼7543 0∼765 10.34 0∼22510 0∼20326 2.27 1∼1719 14 6.77 16 0.021
of peer social networks. In particular, we report on properties such as degree distribution, clustering coefficient, average path length, betweenness and degree-degree correlations. This analysis, on one hand, will give a better understanding of peer associations in resource sharing and provide hints for future P2P network design. On the other hand, simulations of transport and other processes relevant to this kind of network will be enabled from the detailed analysis of the structure of the networks addressed here.
II.
PEER-TO-PEER SOCIAL NETWORKS
Several P2P social networks were constructed based on real user information collected from the Gnutella system. An experimental machine running revised Gnucleus, a kind of Gnutella client, joined the Gnutella network as a super-node, so that it could be connected by more normal peers and many other super-nodes each of which was also connected by hundreds of normal peers. In order not to disturb the actual social links between peers, the experimental node did not provide any shared contents nor sent queries for resources. It acted as a pure monitor to record the traffic passing through it. In particular, it recorded information such as which peer answered a query of which other peer, indicating that the former may be a useful contact to the latter. The experimental Gnucleus node ran on the Gnutella network from 5 hours to 3 days. It usually connected 300 normal peers and 30 other super nodes. The traffic data it recorded involved 1,000 to 200,000 peers. These data, obviously, only reflected associations of a small group of peers in the Gnutella system within a limited period of time. The
SN6 - original 191679 415037 4.5 0∼33680 0∼1366 11.96 0∼168242 0∼54934 2.67 1∼13319 48 8.5 19 0.015
SN1 - major 221 666 6.02 0∼25 0∼50 13.24 0∼244 0∼114 2.2 1∼102 12 3.45 9 0.09 0.33
SN5 - major 459 1468 6.4 0∼60 0∼29 17.9 0∼755 0∼103 2.8 1∼81 14 4.77 14 0.092 0.41
SN6 - major 960 3177 6.6 0∼71 0∼44 15.1 0∼740 0∼152 2.28 1∼65 48 6.5 17 0.091 1.06
Gnutella system should be continuously sampled at multiple points in order to obtain a more accurate and global picture of peer associations. The possible social links between peers were discovered from the collected raw data to form corresponding P2P social networks. A directed connection was created from peer A to peer B if B was a query answerer of A. The strength or weight of this connection indicated how many queries B answered A. The stronger a connection strength is, the more important the end peer is to the other peer of the connection. A connection strength with value 1 suggests a single communication, and hence a weak association. Strength with a constantly high value suggests the end peer is a frequent resource provider of the start peer, and hence a long-term and possibly permanent social relation. The connection strength, however, may decay over time in the absence of any contribution from the end peer. This issue was further discussed in [10]. As P2P social networks are directed and the connection strengths indicate peer affinity, this paper will study P2P social networks in respect of their undirected, directed (including out and in) and weighted connections. Of particular interest are the results obtained when the edges are considered weighted. As most networks in real systems are weighted, it is expected that their full description will provide a better and more accurate scenario for their study and modeling. However, the investigation on weighted networks is still a new area in network modeling, including communication networks, and has only been addressed recently [11]. Table I lists the numbers of nodes (N) and edges (E) of three out of six P2P social networks studied (marked as SN1 original ∼ SN6 original) collected from Gnutella,
1 SN1 unweighted SN5 unweighted SN6 unweighted SN1 weighted SN5 weighted SN6 weighted
0.1
0.01 P(k>K)
both at a magnitude of 105 ∼ 106 . The other three are not shown for space reason, but exhibit the same statistics as of those discussed henceforth. Among tens or hundreds of thousands of peers, only a few of them acted as both requesters and providers. These peers play a major role in P2P social networks as they contribute essential links to the networks. These peers are hence called major peers. Table I also shows the information of the social networks of major peers (marked as SN1 major ∼ SN6 major), refined from the above original social networks, respectively. The number of major nodes and their edges is only of 102 ∼ 103 . For instance, the number of nodes in the major network obtained from SN1 drops from 42,186 to only 221. In the remaining of this paper, both original P2P social networks and major peers’ social networks will be investigated.
0.001
0.0001
1e−005 1
10
100
1000 K−undirected
10000
100000
1e+006
1 SN1 unweighted SN5 unweighted SN6 unweighted SN1 weighted SN5 weighted SN6 weighted
0.1
A.
STATISTICAL ANALYSIS
Table I gives a summarization of the average degree hki, range of out degrees kout and in degrees kin for the unweighted representations of P2P networks analyzed. In the case of weighted representations, the table shows theP average weighted degree or strength hkw i = P w + ij j wji and range of weighted out kw−out (the j first term in the sum) and in kw−in degrees (the second term in the sum) of the original and major P2P social networks studied. Here, wij is the weight of the ij link and means that j answered wij queries from i. The average connection weight hwi, the weight range w and the number of symmetric links are also listed in this table. Each peer in the original peer social networks has an average of 4.3±0.22 neighbors. This also means that on average a peer has 2.15 out degrees and in degrees. This number slightly increases with the number of peers, but is very small compared with a fully connected network of the same size hki = N −1 ∼ 105∼6 . Some peers, however, have up to nearly three thousands to tens of thousands out connections (i.e., resource providers), while the maximum connected resource requesters (i.e., in degree) of a peer is only hundreds up to one thousand. This suggests that there are generally more available providers, though a provider only serves a small fraction of peers in the network. The average weighted degree is around 9∼12 per node and the average connection weight is around 2.3. That is, the frequency of a peer to contact another is about 2.3 times, though in reality a peer can answer another peer’s requests as many as ten thousands times. Similar results have been shown in major peers’ social networks. The social networks of major peers are denser than the original ones, as the average connectivity is almost doubled among major peers. The average connection strength of major social networks is nearly the same as that of the original social networks, suggesting that the average level of peer acquaintance is independent from
0.001
0.0001
Connectivity properties
1e−005 0
1
10
100
1000
10000
100000
1e+006
K−out 1 SN1 unweighted SN5 unweighted SN6 unweighted SN1 weighted SN5 weighted SN6 weighted
0.1
0.01 P(k>K)
III.
P(k>K)
0.01
0.001
0.0001
1e−005 0
1
10
100 K−in
1000
10000
100000
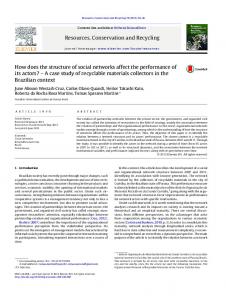
FIG. 1: Cumulative undirected, out and in degree distributions for three P2P networks and their weighted representations. Values of the exponents characterizing the (power-law) distributions are reported in Table III. Note that although SN1, SN5 and SN6 are different networks, they all fall in what seems to be a universal curve.
network sizes. While there are hundreds of connections present in the network, only few of them have symmetric links, less than 0.03% of the whole connections and all the symmetric connections are between major peers. This proves that real peer social networks are extremely asymmetric: while one peer presents a useful social contact to another, it is seldom the case in which the other deems that one as its useful supplier. Table II lists the percentage of peers that have no or 1, 2 and more out and in connections in both original and major social networks. Significantly, 98.5% of peers have no out neighbors at all. These peers are pure providers that never requested anything. Accordingly there are
TABLE II: Percentage of peers with null, 1, 2 and more out and in degrees. Note that there are much more resource providers than requesters. k= Out (original) In (original) Out (major) In (major)
0 98.5±0.02% 0.86±0.03% 42±2.6% 15±2.5%
1 0.16±0.04% 68.5±4.3% 17.7±1.6% 33±2.4%
only 0.86% peers that did not answer any request of others. 68.5% of the peers answered one query and more than 30% peers answered more. A similar phenomenon has also been found in major peers networks. The above result, namely, the fact that there are much more resource providers than requesters, points to an important structural property that may be at the root of the high reliability of Gnutella despite the system’s extreme dynamics and uncertainty. The degree distributions of undirected, out and in connections have also been investigated. Fig. 1 illustrates unweighted and weighted degree distributions of the original social networks SN1, SN5 and SN6 respectively. (Social networks of major peers present very similar degree distributions so they are not shown here due to the lack of space.) The results confirm that peer social networks follow power-law distributions and the exponents are summarized in Table III. It is worth noting that a universal exponent has been obtained for each group of networks (see Fig. 1), namely P2P social networks show the same exponent of the degree distribution for undirected connections no matter of their specific characteristics (e.g., size, number of edges, etc) and the same holds for directed and weighted distributions. Moreover, weighted networks exhibit similar degree distributions, though statistically different as far as the exponent of the power law distribution is concerned, to those of unweighted networks. For six peer social networks and corresponding major networks, their out degree distributions have an average exponent of γ ≈ 1 < 2, and both in and undirected degree distributions have an exponent γ > 2. This is an interesting feature as γ = 2 forms a dividing line between networks with two different dominating behaviors. Hence the different power-law distributions obtained here suggest that the average properties of peer social networks are dominated by (requesting) individuals that have a large number of providers, while providing peers with fewer connected requesters dominate the provision flow of resources. Recent studies reported that the underlying peer-topeer Gnutella network has degree exponent less than 2 [12][13], contrary to the undirected degree exponent of P2P social networks found in our work. While global information exchange mechanisms are closely related to networks with exponent γ < 2 [12], P2P social networks may involve more local interactions between associated peers. However, peer social networks won’t pre-
2 0.07±0.001% 14.6±1.7% 8.6±1.1% 15.2±1.2%
>2