Subsignal-based denoising from piecewise linear or constant signal Bushra Jalil Ouadi Beya Eric Fauvet Olivier Laligant
Optical Engineering 50(11), 117004 (November 2011)
Subsignal-based denoising from piecewise linear or constant signal Bushra Jalil Ouadi Beya Eric Fauvet Olivier Laligant University of Burgundy LE2I Laboratory UMR CNRS 5158 IUT Le Creusot 12 rue de la fonderie 71200 LE CREUSOT, France E-mail:
[email protected]
Abstract. In the present work, a novel signal denoising technique for piecewise constant or linear signals is presented termed as “signal split.” The proposed method separates the sharp edges or transitions from the noise elements by splitting the signal into different parts. Unlike many noise removal techniques, the method works only in the nonorthogonal domain. The new method utilizes Stein unbiased risk estimate (SURE) to split the signal, Lipschitz exponents to identify noise elements, and a polynomial fitting approach for the sub signal reconstruction. At the final stage, merging of all parts yield in the fully denoised signal at a very low computational cost. Statistical results are quite promising and performs better than the conventional shrinkage methods in the case of different types of noise, i.e., speckle, Poisson, and white Gaussian noise. The method has been compared with the state of the art SURE-linear expansion of thresholds denoising technique as well and performs equally well. The method has been extended to the multisplitting approach to identify small edges which are difficult to identify due to the mutual influence of their adC 2011 Society of Photo-Optical Instrumentation Engineers (SPIE). jacent strong edges. ! [DOI: 10.1117/1.3645091]
Subject terms: continuous wavelet transform; wavelet transform modulus maxima; split or segmentation; Stein unbiased risk estimate; thresholding; Lipschitz exponent. Paper 110373RR received Apr. 12, 2011; revised manuscript received Sep. 7, 2011; accepted for publication Sep. 12, 2011; published online Nov. 1, 2011.
1 Introduction In the previous 2 decades, wavelet transform has received significant attention as a tool to extract noise elements from the signals. In particular, the wavelet transform modulus maxima (WTMM) approach proposed by Mallat et al. has received the most attention due to its property of working in the continuous and nonorthogonal domain.1, 2 Several approaches have been proposed in the past to extract singular points from the signal by using WTMM,3–10 e.g., Hsung et al. replaced the maxima detection with the sum of the modulus of its wavelet coefficients inside the corresponding cones of influence.7 More recently, Ordenovic et al. used WTMM to estimate the holder component to identify the glitches present in the signal.8 Similarly, Brunia and Vitulanua used a model-based approach to identify these singular points in a signal.10 Another domain of denoising techniques works on the principle of shrinkage.11, 12 The shrinkage method uses a nonlinear thresholding approach to shrink the orthogonal wavelet coefficients as a denoising tool. This method relies on the idea that the energy of the function is often concentrated in a few wavelet coefficients while the energy of the noise is spread over all coefficients. Therefore, by selecting a suitable threshold value it is possible to reduce a significant amount of noise elements by using nonlinear thresholding in the wavelet domain.12 However, the denoised signal in this case may contain spurious oscillations due to the translation variant property of the discrete wavelet transform. Afterwards, several approaches were proposed to overcome these problems of shrinkage, but so far none of them guar-
antees the preservation of edges or sharp variations, possibly due to their working in an orthogonal basis.13–19 A brief survey of some of these approaches is given by Fodor and Kamath.17 The main motivation of the current work is to overcome the problems existing in the previously proposed methods and to preserve the transitions without introducing any oscillations at a relatively lower computational cost. The proposed approach segments the signal based on the sharpness of its transitions. This segmentation is performed by Stein’s unbiased risk estimate (SURE)-based nonlinear thresholding of WTMM. Once the signal has been split into different subsignals, Lipschitz exponents were computed for all the significant transitions present inside each subsignal individually. These Lipschitz exponents permit to separate the regular or smooth points from the noise elements. A polynomial function is then optimized between all regular points using the minimization approach to reconstruct each subsignal individually. At the end, all subsignals were merged together to reconstruct denoised signal. This paper is organized as follows. Section 2 reviews the wavelet transform modulus maxima approach and proposes a splitting method. Section 3 deals with the noise removal and reconstruction for subsignals. Results are given in Sec. 4. Section 5 presents an application and Sec. 6 concludes the work with some future prospects.
C 2011 SPIE 0091-3286/2011/$25.00 !
Y = F(ti ) + εi ,
Optical Engineering
1.1 Principle of the SSplit Method The proposed method can be divided into two main stages: signal splitting and reconstruction. Let us suppose we have a noisy function Y such that:
117004-1
where i = 1, . . . , N ,
(1)
November 2011/Vol. 50(11)
Jalil et al.: Subsignal-based denoising from piecewise linear or constant signal
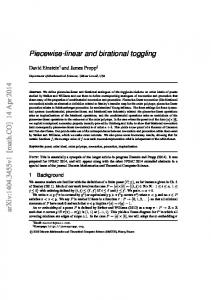
Fig. 1 (a) Block function and (b) block function with Gaussian white, with rescaling to have signal to noise ration, SD( f )/σ = 7.
F(ti ) is the deterministic function with ti = (i − 1)/N , N is the total number of samples, and εi is white Gaussian noise N (0, σ 2 ). The aim of the current work is to estimate the function F with the minimum mean square error (MSE). The MSE of an estimator Fˆ with respect to the estimated parameter F is defined as: MSE =
N −1
1 ˆ 1! ˆ || F − F||2 = ( Fi − F)2 . N N i=0
1. Initially, the selection of the subsets are defined on the basis of SURE-based nonlinear thresholding of WTMM . 2. Lipschitz exponents computed from each subset result in identifying the regular or smooth points in the respective subset. 3. The polynomial function is then optimized between all smooth points to restore each subset individually. 4. At the end, all subsets were merged together to reconstruct the fully denoised signal.
(2)
In order to estimate the function F, the method splits the function Y into its subsets in spatial domain on the basis of the sharpness of transitions or edges such that: (3)
Experimental results will be presented on the synthetic Block function proposed by Donoho (Fig. 1). In Sec. 2, a brief explanation of the signal splitting approach is given and Sec. 3 explains the reconstruction technique.
Y denotes the set of all samples and each subset Yi , and i = 1, . . . , J contains K i adjacent samples yi,l with l ε 1, . . . K i . J is the total number of subset and K i is the length of the respective subset. Piecewise analysis has been performed on each subset of the function Y individually by following the algorithm as follows:
2 Signal Splitting Approach Let us consider the step function given in Fig. 2. the Step function is considered to be discontinuous and hence nondifferentiable. During smoothing, it is of extreme importance not only to identify this property of step function but also to preserve the discontinuity of the respective edge point. These
Y ⊇ Yi=1,2...J .
Fig. 2 Synthetic step signal. Optical Engineering
117004-2
November 2011/Vol. 50(11)
Jalil et al.: Subsignal-based denoising from piecewise linear or constant signal
Fig. 3 Piecewise discontinuous signal.
edges actually separate two independent parts of the signal which are disconnected from each other at this point. Several denoising algorithms cannot preserve this property and end up in the smoothing of this point. In order to illustrate this phenomenon, we have added white Gaussian noise to the signal as shown in Fig. 2. Denoising with the shrinkage approach results in smoothing not only the noisy region but also the sharp transition. Hence, after denoising it is not possible to identify that the transition was actually a discontinuous point of the signal. Similarly, Fig. 3 presents another example of such cases: the piecewise signal with discontinuous transition in the middle. Smoothing with the shrinkage approach results in removing the noise elements but the edge has also been smoothed and, as a result, it is not possible to identify any discontinuous point present inside the signal, while these discontinuous points are considered as a disconnection between two parts of the signal. It is possible that the two parts are independent of each other. In this work we propose to study each disconnected part individually. The complete denoising on each part is performed individually and at the end all disconnected parts were merged together to reconstruct the complete denoised signal. Wavelet transform has been used as a significant tool to extract such discontinuity at coarser scales. It has been proved that the noise elements gradually disappear on coarser scales and only significant transitions are left inside the signal. We had utilized this property of wavelet transform to identify the significant transitions and possible split points. The splitting of the signal involves two steps: 1. Multiscale analysis and extraction of modulus maxima. 2. Stein’s unbiased estimate of risk-based thresholding. In Sec. 2.1, we will present the brief study of the multiscale analysis and thresholding-based technique to split the signal into subsets. Optical Engineering
2.1 Multiscale Analysis In order to split the signal, continuous wavelet transformbased multiscale analysis has been applied on a signal y(t) to compute the modulus maxima by using the integrable function:1, 2 # $ " +∞ (t − u) 1 dt, (4) W T (u, s) = √ y(t)# ∗ s s −∞ where W T (u, s) is the wavelet coefficient of the function y(t), #(t) is the analyzing wavelet, s(> 0) is the scale parameter, and u is the position parameter. While computing the WTMM, it is not guaranteed that the modulus maxima located at (u 0 , s0 ) will belong to a maxima line that propagates toward a finer line. Mallat highlighted that when the scale decreases, W f (u, s) may have no more maxima in the neighborhood of u = u 0 .1 Afterwards, he proved by using the heat diffusion equation that this lack of maxima would never be the case if wavelet function is the derivative of a Gaussian function. Therefore, the derivative of a Gaussian function is most often used to guarantee the propagation of maxima lines on finer scales.1 The Gaussian function [θ (t)] has an important property of continuous differentiability as well, which makes this function suitable for the analysis of most types of signals. 2.1.1 Modulus maxima extraction Continuous wavelet transform-based multiscale analysis results in the highlighting of modulus maxima across successive scales. These modulus maxima are defined as any point (u 0 , s0 ) such that |W f (u, s0 )| is locally maximum at u = u 0 and correspond to the significant edges and transitions present in the signal. Figure 4 shows the computation of modulus maxima across four different scales. It can be observed from the figure that the strong peaks preserved their maxima even on coarser scales. However, the maxima corresponding to the noise elements gradually disappear on coarser scales. It is therefore possible to locate the position
117004-3
November 2011/Vol. 50(11)
Jalil et al.: Subsignal-based denoising from piecewise linear or constant signal
Fig. 4 Modulus maxima of the synthetic block signal on multiscale analysis with ψ = −θ & , where θ is a Gaussian function. (a)–(d) correspond to the analysis on 1st, 3rd, 6th, and 10th scale.
of these singularities by tracing their corresponding maxima from coarser scales to finer scale. 2.2
Stein Unbiased Estimate of Risk-Based Thresholding for Signal Splitting In order to select the optimum threshold criteria for making the subsets, the level dependent thresholds are derived from modulus maxima by regarding the different scale levels as independent multivariate normal estimation problems. SURE gives an estimate of the risk for a particular threshold value t; minimizing this in t gives a selection of the threshold level for that level j ( j = 1, 2 . . . J ).20 SURE-based nonlinear soft thresholding on modulus maxima results in splitting the signal into subsets. Figure 5 shows the thresholding results and respective splitting points on a decomposed signal. The first derivative of a Gaussian function is used as a mother wavelet function on the block function with the sample size of 2048. Tracing these modulus maxima lines from a coarser scale to a finer scale results in giving the split edges at a convergence point on the finest scale. A nonlinear soft thresholding at the decomposition level J = 10 (where total signal size = 2 J ) results in giving all split points. Figure 6 shows the subsets along with the split points obtained in the original Block
signal by applying SURE-based nonlinear soft thresholding. It can be seen from the figure that it is possible to split the signal from the sharp transitions or edges by locating their modulus maxima on coarser scales. After splitting the signal into respective subsets, the next step is to identify the noise elements and to reconstruct the signal without taking into account noisy samples. We will explain the proposed noise extraction method and reconstruction technique in Sec. 3. 3 Piecewise Estimation of Singular Points and Reconstruction The second stage of the denoising algorithm deals with the extraction of noise elements from each subset individually. Mallat highlighted that the wavelet transform has a sequence of local maxima that converges to a point at a finer scale even though the function is regular at that point.1 Therefore, in order to detect the singularities it is not sufficient to follow the wavelet modulus maxima across scales. The Lipschitz exponents measure the regularity or singularity from the decay of these modulus maxima lines. A modulus maxima line is any connected curve S(u) in the scale-space plane (u, s) along which all points are modulus maxima. It is shown by Mallat
Fig. 5 The continuous wavelet transform (CWT)-based decomposition of the block function at scale J = 10 (with ψ = −θ & , first derivative of Gaussian function) is shown with the dotted lines (where total signal size = 2J ). The nonzero solid line point shows the proposed splitting points after applying nonlinear soft thresholding at scale J . It can be noted that the soft thresholding results in reducing the energy of the nonzero coefficients. After applying threshold, all the coefficients with nonzero energy are considered as split points. Optical Engineering
117004-4
November 2011/Vol. 50(11)
Jalil et al.: Subsignal-based denoising from piecewise linear or constant signal
Fig. 6 (a) Signal with Gaussian white noise σ = 1 addition with proposed split points and (b)–(m) subsets of noisy signal.
that point wise singularities can be computed by measuring the decay of slope of log2 |W f (u, s)| as a function of log2 (s) and is termed as the Lipschitz exponent.1, 2
results in giving M − 1 segments in a respective subset of the signal. The schematic diagram explaining the concept of reconstruction and notation is given in Fig. 7.
Definition 1 : Let n be a positive integer and n < α < n + 1. A function f (x) is said to be Lipschitz α, at x0 , if and only if there exists two constants A and h 0 > 0 and a polynomial of order n, Pn (x), such that for h < h 0 :1 f (x0 + h) − Pn (h) ≤ A|h|α .
(5)
Lipschitz exponents can be computed from the decaying slope of modulus maxima lines by using Eq. (5). If the Lipschitz value of the particular point is less than 1, then it corresponds to the singularity, as the signal is not differentiable. In the present work, by utilizing the property of Lipschitz exponents all the differentiable points (α > 1) are used in the reconstruction process. 3.1 Reconstruction Based on Minimization Technique The present method proposes to restore each subset individually by using regular points extracted on the basis of their Lipschitz exponent values. The reconstruction method utilizes all sampled points and used minimization-based polynomial functioning to restore the signal. Let us define all the differentiable points (α > 1) as regular points. In order to avoid the effect of discontinuity, the regular points itself were not included in the reconstruction process. The area between two regular points is termed a segment. Therefore, the subset containing M regular points Optical Engineering
Fig. 7 Schematic explanation of polynomial-based reconstruction.
117004-5
November 2011/Vol. 50(11)
Jalil et al.: Subsignal-based denoising from piecewise linear or constant signal
Fig. 8 (a) Signal with Gaussian white noise σ = 1 addition with proposed split points, (b)–(m) reconstructed subset of signal, and (n) reconstructed signal (RMSE = 0.13). 2 Suppose ym,l = ai,m + bi,m xm,l + ci,m xm,l represents the function between two regular points Oi,m and Oi,m+1 in subset i, where i = 1, . . . , J is the index of the respective subset with m = 1 , . . . , M regular points and contains ym,l sample points (l = 1 , . . . , K i ) in each subset. K i represents the total number of samples in the respective subset i. xm represents the data sample of segment m. As each segment is assumed to be at origin with the coordinate point at (0, 0), the respective offset will be added after the polynomial estimation for
Optical Engineering
all samples. Each segment is represented by the quadratic polynomial function. In order to solve the equation to find three coefficients, we assume each segment at origin, P(0) = 0 = ai,m ,
(6)
and 2 P(xm,K i ) = ym,K i = ai,m + bi,m xm,K i + ci,m xm,K , i
117004-6
(7)
November 2011/Vol. 50(11)
Jalil et al.: Subsignal-based denoising from piecewise linear or constant signal
Fig. 9 (a) Piecewise Linear noisy signal (SD ( f )/σ = 7), (b) SURE Shrink reconstruction [root-mean-square error (RMSE) = 0.36] and (c) SSplit reconstruction (RMSE = 0.16).
bi,m =
2 ym,K i − ai,m − ci,m xm,K i
xm,K i
.
(8)
By using the minimization technique ci,m =
K i −1 ! l=1
(P(xm,l ) − ym,l )2 ,
(9)
δci,m = 0. δxm,l
(10)
After solving these coefficients for each segment in the & & , ym,l ) in the subset i have been subset, all the points (xm,l reconstructed with the addition of offset values such that: & & (xi , yi ) = (xm,l + xi,m , ym,l + yi,m )
(11)
Fig. 10 (a) Noisy signal with 512 Samples, (b) SURE Shrink reconstruction (RMSE = 0.67), and (c) SSplit reconstruction (RMSE = 0.29). Optical Engineering
117004-7
November 2011/Vol. 50(11)
Jalil et al.: Subsignal-based denoising from piecewise linear or constant signal Table 1 Root-mean-square-errors estimation by using different sample size (Gaussian white noise σ = 1).
Table 2 Root-mean-square-errors of estimation by using different wavelets (Gaussian white noise σ = 1, sample = 2048).
Total sample
Visu shrink
Risk shrink
SURE shrink
SSplit
Mother wavelet
SURE shrink
SSplit
512
1.12
.80
0.67
0.29
Haar
0.41
0.153
1024
1.03
.72
0.6
0.23
Daubechies 4
0.5
0.179
2048
.85
.60
0.437
0.13
Coiflet 3
0.54
0.172
4096
.72
.50
0.369
0.08
Symmlet 8
0.56
0.126
8192
.59
.42
0.315
0.079
where (xi,m , yi,m ) represents the coordinates of regular points and (xi , yi ) represents the reconstructed points in the respective i subset. Final merging of all reconstructed subsets results in giving the complete denoised signal. 4 Results and Discussion Figure 8 shows the result on noisy Block function (sample size of 2048) along with the reconstructed subset. Final merging of all these subset results in giving the whole reconstructed signal [(Fig. 8(n)]. In some of the subsets [Figs. 8(c), 8(g), 8(m)] where there exist no regular points, the reconstruction process results in giving a straight line between control points. The proposed algorithm performs quite well with the mean square error of 0.13 for a 2048 sample size (Fig. 8). Furthermore, the method works equally well on piecewise linear functions as well as shown in Fig. 9. The comparative study with some of the previously proposed methods is given in Sec. 4.1.
4.1 Comparative Analysis with SURE Shrinkage Approach In this section, we present the comparative analysis of SSplit with the classical shrinkage methods (SURE shrink, risk shrink, and, visu shrink11, 12 ). The first criterion to analyze in this regard is the sample size. Sample size plays a critical role in most of the signal analysis techniques and the performance of most of the denoising methods is limited with the number of samples. Figure 10 shows the results of SURE shrink and SSplit method with the sample size of 512. It can be seen from the figure that reduction in sample size does not effect the performance of the SSplit method. Therefore, the SSplit method can give much better results in the cases where the efficiency of the system is dependent on the total number of sample size. Table 1 summarizes the comparison (in terms of root-mean-square error) of the SSplit method with the SURE shrink, risk shrink, and VISU shrink methods with different sample sizes. We have presented our findings by adding different variance of Gaussian white noise in Fig. 11. In order to evaluate the performance, the method has been tested with different wavelet functions, e.g., Haar, Daubechies 4,
Fig. 11 Comparison : SURE shrinkage and SSplit method in terms of root mean square error with the noise of different variance (0, σ ). Optical Engineering
117004-8
November 2011/Vol. 50(11)
Jalil et al.: Subsignal-based denoising from piecewise linear or constant signal
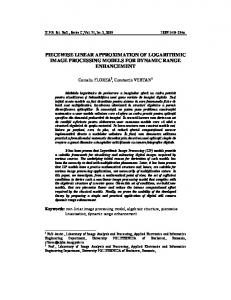
Fig. 12 (a) Signal with speckle noise addition SD( f )/σ = 7, (b) SURE shrink reconstruction (RMSE = 0.73), and (c) SSplit reconstruction (RMSE = 0.14).
Coiflet 3 and Symmlet 8. Table 2 concludes that the method worked equally well in this case and will result in giving better statistics as compared to the SURE shrink method. At the last stage, the method has also been checked with the different types of noise elements, e.g., speckle and Poisson noise. In the case of multiplicative noise, variance of the noise is a function of the signal and the noise variance is higher when amplitude of the signal is higher. It can be seen from Fig. 12 that the proposed method outperforms the SURE shrink method with the resulting root-mean-square error of 0.14. Table 3 summarizes the statistical results obtained with different types of noises. However, since the proposed method is presently restricted to only specific types of singularities (discontinuous signal), and in most of the cases the specialized algorithm works better than the general cases. 4.2 Comparative Analysis with the State-of-the-Art SURE-LET Denoising Approach In order to illustrate the performance of the method with the state–of–the–art denoising techniques, we had compared the results with the most recent ”SURE linear expansion Table 3 Root-mean-square errors of estimation by using different types of noise [SD( f )/σ = 7]. Noise type
SURE shrink
SSplit
Poisson noise
0.82
0.26
Speckle noise 4
0.73
0.14
White Gaussian noise
0.46
0.15
Optical Engineering
of thresholds (LET)” denoising approach proposed by Blu et al.21 The SURE-LET method is based on the minimization of an estimate of the mean squared error—SURE. Furthermore, in the case of SURE-LET, the denoising process can be expressed as a linear combination of elementary denoising processes—LET. Here, we are not presenting the theory and discussion of the method but for the interested readers, the complete details and explanation of the method is given by Blu et al. in Ref. 21. In this section, we will present the comparison of the stateof-the-art SURE-LET denoising method, classical SURE shrinkage methods with the proposed SSplit method. Figure 13 presents the results on a synthetic block signal with the three methods. The new method outperforms the SURE shrinkage method and gives very close statistical results to the SURE-LET denoising method. In terms of visual analysis, the SSplit method gives relatively better results as compared to SURE-LET, but due to very few noise artifacts near discontinuous edges the method gives little higher MSE as compared to the SURE-LET method. The more detailed comparison with different noise variance is given in the graphical form in Fig. 14. The obtained results of the SSplit method is approximately the same as the SURE-LET method. Table 4 presents the results in terms of signal-to-noise ratio (SNR) as well. The same trend is obtained in this case. The SNR from both recently proposed denoising methods, SURE-LET and SSplit, give higher and close SNR and outperforms the classical SURE shrinkage method. The comparative analysis of the proposed SSplit method with the most recent state-of-the-art method SURE-LET and classical SURE shrinkage method has been presented in this section. It has been observed that the method works equally
117004-9
November 2011/Vol. 50(11)
Jalil et al.: Subsignal-based denoising from piecewise linear or constant signal
Fig. 13 (a) Signal with Gaussian noise addition (input MSE = 0.476), (b) SURE shrink reconstruction (MSE = 0.094), (c) SSplit reconstruction (MSE = 0.009), and d) SURE-LET reconstruction (MSE = 0.0074). Table 4 Comparison: SURE-LET, SURE shrinkage, and SSplit methods in terms of SNR. SURE Shrink (SNR)
SURE-LET (SNR)
SSplit (SNR)
18.474
24.47
34.90
32.04
19.11
25.08
35.62
32.84
20.72
26.15
37.34
35.50
21.75
26.32
38.37
36.71
23.02
27.63
39.57
37.94
24.63
28.69
41.01
39.86
26.79
29.52
42.78
42.23
Input SNR
Fig. 14 Comparison: SURE-LET, SURE shrinkage, and SSplit methods in terms of mean square error with noise of different variance.
Fig. 15 (a) Synthetic block function with two discontinuities, A represents the strength in terms of an amplitude of the high step and (b) function with the white gaussian noise (0,1). Optical Engineering
117004-10
November 2011/Vol. 50(11)
Jalil et al.: Subsignal-based denoising from piecewise linear or constant signal
Fig. 18 (a) Noisy signal, (b) SURE shrink, and (c) SSplit with extended multisplitting approach (A = 0.8). Fig. 16 Evolution of maxima at position x by varying A amplitude, along with the probabilistic SURE threshold curve (dashed line). For each A value, edge at position x can only be detected at the scale where the deterministic value is higher than the probabilistic value.
Fig. 17 (a) First stage splitting and (b) and (c) second stage splitting of subset with multisplitting approach (A = 0.8). Optical Engineering
117004-11
November 2011/Vol. 50(11)
Jalil et al.: Subsignal-based denoising from piecewise linear or constant signal
Fig. 19 Root mean square error by varying A amplitude with N(0,1).
well as a SURE-LET denoising technique. Therefore, we conclude that if we split the signal then the denoising in spatial domain can work equally well as in the transform domain. 5 Application : Extraction of Small Singularities The initial denoising results are very encouraging to extend this approach for the identification of small singularities hidden inside the noisy signals. In contrast to the several proposed algorithms in the past, the SSplit method can detect small discontinuities or singularities hidden inside the signal. In several denoising methods, such small singularities are either suppressed during the denoising process or ignored due to their insignificance in most of the cases. Therefore, the efficiency of such denoising methods depends on the strength and significance of such small discontinuities. These small
but sharp singularities suffer due to the mutual influence of their adjacent high energy transitions,22 e.g., Fig. 15 explains this phenomenon, where small edges are suppressed due to the mutual influence of its adjacent sharp transition. In Fig. 15, “A” defines the strength in terms of an amplitude of the strong discontinuity, whose influence does not allow the detection of an adjacent small edge of an amplitude “1-A.” Since splitting is based on the SURE-based threshold criterion, the selection of the correct thresholding scale is crucial to the accurate splitting. Figure 16 shows the decay probabilistic curve of the SURE-based threshold across successive scales along with the deterministic curve of small edge at “x” position (shown in Figure 15) with different A values. For each A value, the edge at x can only be detected at the scale where the deterministic value is higher than the probabilistic value as Fig. 14 highlights the minimum scale required to identify the edge at position x with a particular A value. In order to identify such small edges, the SSplit method was extended to the multisplitting approach. It is possible to further split the subset by applying the same splitting technique on subsets. Figure 17 gives the explanation of the multisplitting approach. At the first stage of splitting, the small discontinuity hidden at the location of x can not be detected. Therefore, the SSplit method is again applied on subset C to identify the small edge. Subset C is further split into two more subsets by using the same SSplit approach, and finally the complete denoised signal can be reconstructed by using a total of 4 subsets. Figure 18 presents the results obtained with the SURE shrink and multiSSplit methods in the case of a small discontinuity (A = 0.8). It can be seen from the figure that the proposed method not only denoised the signal reasonably well but also preserved the small edges. The comparison graph of the SURE shrink and multiSSplit methods by varying amplitude A is given in Fig. 19. The graph shows the comparative analysis (in terms of root-meansquare error) of the SSplit method and classical SURE shrink method by varying A value.
Fig. 20 Comparison: (a) Original signal, (b) Signal with Gaussian noise addition (input SNR = 24.3 dB), (c) SURE-LET reconstruction (SNR = 32.11 dB), and (d) SSplit reconstruction (SNR = 40.5 dB). Optical Engineering
117004-12
November 2011/Vol. 50(11)
Jalil et al.: Subsignal-based denoising from piecewise linear or constant signal
Fig. 21 Comparison: (a) Original signal, (b) Signal with Gaussian noise addition (input MSE = 2.05), (c) SSplit reconstruction (MSE SSPLIT = 0.09), (d) SURE-LET reconstruction (MSE SURE-LET = 0.12).
5.1 Comparison with SURE-LET Denoising Approach for Small Edges For the present case, the method has been compared with the SURE-LET approach as well. It can be seen from Fig. 20 that the SSplit method not only kept the small singularity but also removed the noise elements better than the SURE-LET approach. SURE-LET removed the noise elements but kept some oscillations and failed in preserving a small edge after denoising. Since the proposed SSplit method is particularly addressed, such types of signal (piecewise linear or constant) therefore works better in both high variance of noise and preserves very small transitions as well. The proposed method (SSplit) particularly addressed the problem of preserving edges in the presence of noise elements. Several noise levels have been tested and the obtained results justified the main objective of the method. In the second stage, the method has been compared with a state-ofthe-art SURE-LET denoising approach. The results shown in the paper present the comparable performance of both methods. However, in the case of very high variance of noise (as shown below), the proposed SSplit method performed better than the SURE-LET approach. More importantly, the SSplit method preserved the sharpness of the edges or the discontinuity of the signal. In many practical applications (e.g., in medical applications), it is of extreme importance to localize these discontinuities present inside the signal. The SURE-LET method no doubt had removed the noise elements significantly and approximately the same statistical results in terms of MSE, but has smoothed the edges as well. This property is particularly observed in the case of high variance of noise as shown in Fig. 21. Again, our results are visually more satisfactory. 6 Conclusion In this paper, a novel approach for the removal of noise elements from piecewise linear or constant signals is presented. The foundation of this technique is based on the modulus Optical Engineering
maxima technique, shrinkage approach, and splitting concept. The most useful aspect of the proposed algorithm is the separation of sharp edges or transitions from noise elements. Based on SURE estimation, thresholding is performed on modulus maxima across a selected scale to split the signal from edges. The wavelet transform has proved to be a significant tool to extract noise elements by locating modulus maxima. Lipschitz exponents computed from the decaying slope of modulus maxima results in identifying the noise elements. By using these Lipschitz exponents, the signal was restored by using a polynomial fitting. Statistical results proved that the proposed method performs better than the conventional shrinkage methods with different types of noise. Unlike many shrinkage approaches, the efficiency of the method is not dependent on the sample size as well. The method has been compared with the most recent state-of-the-art method SURE-LET denoising approach. The SSplit method based in spatial domain works equally well as compared to the SURELET methodology. Another contribution of the present work is explained in Sec. 5. The proposed method can be used for the extraction of small singularities hidden inside the signal. Such small edges cannot be detected due to the mutual influence of their adjacent strong transitions. In order to detect such types of transitions, the SSplit method has been extended to the multisplitting approach. Statistical results showed that the method can efficiently identify such types of edges. In the present study, only specific discontinuous synthetic signals were addressed, but in future work the same splitting concept will be presented to remove the noise elements on other types of continuous signals with little or no discontinuity. We presently refine the reconstruction process by adding continuity conditions between segments and an adaptation in two dimension of a splitting principle is in progress.
Acknowledgments The authors would like to thank Region Bourgogne, France for providing financial support for this work. We are also
117004-13
November 2011/Vol. 50(11)
Jalil et al.: Subsignal-based denoising from piecewise linear or constant signal
thankful of Florian Luisier for his kind help in comparing SURE-LET denoising method with our approach.
References 1. S. Mallat, A Wavelet Tour of Signal Processing, 2nd Ed, Academic Press, California (1998). 2. S. Mallat and W. L. Huwag, “Singularity detection and processing with wavelets,” IEEE Trans. Inf. Theory 38, 617–643 (1992). 3. A. Liew and D. T. Nguyen, “Reconstruction from wavelet transform modulus maxima using nonexpansive projections,” Electron. Lett. 31, 1038–1039 (1995). 4. Z. Cvetkovic and M. Vetterli, “Wavelet extrema and zero-crossing representation: Properties and consistent reconstruction,” IEEE Trans. Signal Process. 6, 19–22 (1995). 5. C. J. Kicey and C. J. Lennard, “Unique reconstruction of band-limited signals by a Mallat-Zhong wavelet transform algorithm,” J. Fourier Anal. Appl. 3, 63–82 (1997). 6. B. Jalil, O. Beya, E. Fauvet, and O. Laligant, “Singularity detection by wavelet approach: application to electrocardiogram signal,” Wavelet Applications in Industrial Processing VII, Proc. SPIE 7535, 753506 (2010). 7. T. C. Hsung, D. P. Lun, and W. C. Siu, “Denoising by singularity detection,” IEEE Trans. Signal Process. 47, 3139–3144 (1999). 8. C. Ordenovica, C. Suracea, B. Torresani, and A. Llebaria, “Detection of glitches and signal reconstruction using Holder and wavelet analysis,” Stat. Methodol. 5, 373–386 (2008). 9. G. S. Shin and M. G. Kang, “Wavelet-based denoising considering interscale and intrascale dependences,” Opt. Eng. 44, 067002 (2005). 10. V. Brunia and D. Vitulanoa, “Wavelet-based signal de-noising via simple singularities approximation,” Signal Process. 86, 859–876 (2006). 11. D. L. Donoho and I. Johnstone, “Adapting to unknown smoothness via wavelet shrinkage,” J. Am. Stat. Assoc. 90, 1200–1224 (1995). 12. D. L. Donoho and I. Johnstone, “Ideal spatial adaptation via wavelet shrinkage,” Biometrika 81, 425–455 (1994). 13. R. R. Coifman and D. L. Donoho, “Translation-invariantdenoising,” Lecture Notes in Statistics, Springer Verlag, New York (1995). 14. M. Lang, H. Guo, J. E. Odegard, C. S. Burrus, and R. O. Wells, “Noise reduction using undecimated discrete wavelet transform,” IEEE Signal Process Lett. 3, 10–12 (1996). 15. A. Baussard, F. Nicolier, and F. Truchetet, “Rational multiresolution analysis and fast wavelet transform: application to wavelet shrinkage denoising,” Signal Process. 84, 1735–1747 (2004). 16. J. S. Walker and Y. J. Chen, “Image denoising using tree-based wavelet subband correlations and shrinkage,” Opt. Eng. 39, 2900–2908 (2000). 17. I. K. Fodor and C. Kamath, “Denoising through wavelet shrinkage: an empirical study,” J. Electron. Imaging 12, 151–160 (2003). 18. L. Tessens, A. Pizurica, A. Alecu, and A. Munteanu, “Context adaptive image denoising through modeling of curvelet domain statistics,” J. Electron. Imaging 17, 033021 (2008). 19. C. Chaux, L. Duval, A. Benazza-Benyahia, and J. C. Pesquet, “A nonlinear Stein based estimator for multichannel image Denoising,” IEEE Trans. Signal Process. 66, 3855–3870 (2008). 20. C. Stein, “Estimation of the mean of a multivariate normal distribution,” Ann. Stat. 9, 1135–1151 (1981). 21. T. Blu and F. Luisier, “The SURE-LET approach to image denoising,” IEEE Trans. on Image Process. 16, 2778–2786 (2007). 22. O. Laligant, F. Truchetet, and F. Meriaudeau, “Regularization preserving localization of close edges,” IEEE Signal Process Lett. 14, 185–188 (2007).
Optical Engineering
Bushra Jalil graduated in 2003 from National University of Science and Technology (NUST), Pakistan, in the field of mechatronics engineering. After completing her undergraduate course she worked as an assistant engineer in industrial setup in Pakistan for 3 years. Later in 2006 she joined a master course in the field of vision and robotics (Erasmus Mundus Programme) from Heriot Watt University Scotland, Universite´ de Bourgogne, France and Universitat de Girona, Spain. Currently she is working on her PhD at the Universite de Bourgogne in Le2i Laboratory Le Creusot, France in the field of nonlinear signal processing with an application to ECG signal with Dr. Olivier Laligant and Dr. Eric Fauvet.
117004-14
Ouadi Beya received his MS degree in computer and electronic of image processing in 1997. Currently he is working on his PhD in signal processing in the LE2I laboratory Burgundy University (France). His scientific research is oriented in processing and analyzing cardiac signals for help in medical diagnosis.
Eric Fauvet received his PhD degree in 1990 in electronic and image processing from the University of Burgundy, France. He is lecturer in the Le2i laboratory of the University of Burgundy since 1990. His research interests includes signal and image processing, stochastic optimization, and pattern recognition.
Olivier Laligant received his PhD degree from the Universite de Bourgogne, France, in 1995. He is a full professor in the computing, Electronic, Imaging Department (Le2i) at the Universite de Bourgogne, France. His research interests are focused on multiscale edge detection, nonlinear regularization, and noise estimation.
November 2011/Vol. 50(11)