Artificial Intelligence for Engineering Design, Analysis and Manufacturing ~2000!, 14, 163–176. Printed in the USA. Copyright © 2000 Cambridge University Press 0890-0604000 $12.50
Survey of life-cycle measures and metrics for concurrent product and process design
BIREN PRASAD Department of Knowledge-based Engineering ~KBE!, Unigraphics Solutions, P.O. Box 3882, Tustin, CA 92781-3882 (Received March 1, 1999; Revised August 20, 1999; Accepted August 31, 1999!
Abstract Concurrent Engineering needs a series of measures ~or measurement criteria! that are distinct to each process, and a set of metrics to check ~and validate! the outcome when two or more of the life-cycle processes are overlapped or required to be executed in parallel. Because product realization involves concurrent processes that occur across multiple disciplines and organizations, appropriate measures and the methods of qualifying metrics are essential. Inevitably, such concurrent processes generate design conflicts among multiple life-cycle concerns. Individual assurances of satisfying life-cycle design criterion ~one at a time! do not capture the most important aspect of Concurrent Engineering—the system perspective—meaning achieving a well-balanced trade-off among the different life-cycle design measures. While satisfying life-cycle design measures in a serial manner only those, which are not in conflict, are occasionally met. The paper first describes a set of life-cycle measures and metrics and explains how those could be used for gaining operational excellence. Second, this paper provides an insight into the mechanisms ~such as knowledge-based systems, rule-based simulation, and rule-based optimization! to ensure an effective trade-off across different life-cycle measures, customer requirements, and their inclusion into a product design, development, and delivery ~PD 3 ! process. Keywords: Concurrent Engineering; Life-cycle Measures and Metrics; Knowledge-based Systems; Rule-based Simulation; Rule-based Optimization
ber may not be able to improve its content. The truth is one cannot impact what one cannot measure. However, if a PDT member can measure steps, and would be able to express each in numbers or in sets ~limits!, he or she can improve it as well. Measurements are not new to product design and engineering. Traditionally, to ascertain confidence at an early ~life-cycle! design stage, automotive designers are accustomed to physical aids such as a hardware prototype, a wood0 clay model, a conceptual model, a model making, a mockup, drawings, etc. These physical aids measure the product’s compliance with respect to a stated set of product’s specifications. Furthermore, in traditional systems, designers have used documentation ~engineering drawings, sketches, prints, etc.! to manage the design creation process. They are quite familiar with the validation process of “design review” and “design revision” to improve its functionality. If the design revisions or changes were necessary, the PDT returned an annotated design to the drawing board and the iterative cycles of measurement and improvement were repeated. There were rules of thumb that the designers had, over time, be-
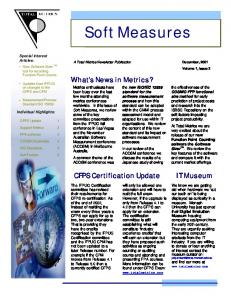
1. INTRODUCTION In Concurrent Engineering, although the process activities or steps run in parallel, the enrichment of information occurs in a traditional fashion, from conceptualization of a design r to engineering r to production and r to delivery in a single thread of continuity ~Fig. 1!. Such information enrichment continuum is often viewed as a collection of overlapping steps made out of many related cycles, including product and process realization loops. Many of these realization loops actually run in parallel, as discussed in Prasad ~1996!. Individual process activities and steps in such realization loops need to be measured, managed, and improved ~Prasad, 1996!. If a product development team ~PDT! member cannot measure what he or she is envisioning and could not express it in quantitative or qualitative terms, the PDT memReprint requests to: Biren Prasad, Department of Knowledge-based Engineering, Unigraphic Solutions, P.O. Box 3882, Tustin, CA 92781-3882, USA. E-mail:
[email protected]
163
164
B. Prasad
Fig. 1. Information enrichment spiral.
come accustomed to using while adding or selecting a design option or a feature. Today, drawing has been, or to a large extent, is in the process of being replaced by a 3-D computer-aided design ~CAD! system to manage the product design, development and delivery (PD 3 ) process. Most ad hoc metrics—known then as multitude of “best design practices”—is being formalized today as Design for X-ability ~DFX!. DFX includes things such as design for manufacturability, design for assemblability, design for maintainability, etc. X-ability is used here as a generic reference to a life-cycle measure or concern ~e.g., ease, econ-
omy, flexibility, efficiency, effectiveness, etc.! of a product. Ease refers to “ease in handling a product,” while in use, or during maintenance or while carrying, lifting or moving the product from one place to other. Economy refers to “economy of resources” when dealing with purchase or acquired items. Economy also refers to “economy in cost,” when developing new products including cost of repair and maintenance. Miles per gallon achieved from an automobile, for instance, refers to fuel economy. In computer software products, the term X-ability refers to things like usability, portability, scalability, interoperability, stability, etc.
Life-cycle measures and metrics for concurrent product and process design Selecting and satisfying a set of ad hoc DFX practices, called herein as life-cycle measures or criteria, could prevent a company from “reinventing the wheel.” With DFX, it has been possible for PDTs to make sure that a proposed candidate design contains what is considered a better set of the 3Ps ~policies, practices, and procedures! in each lifecycle domain ~e.g., design, engineering, prototyping, process planning, manufacturing, product support, etc.!. Most life-cycle metrics are based on heuristics ~e.g., rules of thumb!, or some type of scoring methods such as features coding in group technology, cost drivers, quality indexes, customer satisfaction index, technical importance rating ~as in Quality Function Deployment ~Hales et al., 1990!, etc. Such scoring methods provide a set of measurement criteria for judging the goodness of an artifact’s as being designed. If we are presented with a “virtual system” with a shallow knowledge of its life-cycle functions, we could begin to speculate on the resulting artifact, its morphology, and its functional behaviors ~Nevins & Whitney, 1989!. Given all life-cycle specifications, each of the PDT members ~say a life-cycle specialist! in a particular field ~e.g., a life-cycle domain like engineering! could come up with different speculative responses. Such responses will be based upon their understanding of the anticipated outcomes and their knowledge of the field or of life-cycle specialization. Each response may represent an acceptable design in its own right, meaning meeting most of the corresponding basic life-cycle specifications in a particular category. A synthesis of these speculative responses may yield some clues as to what a whole “real” artifact system is. The above resembles a story of seven blindfolded persons, who were asked to examine the morphology of an elephant. Six were allowed to touch and feel a portion of an elephant and the seventh person the whole elephant. Based upon their own individual experiences and observations, each person gave a correct narration of their findings. However, individually, their findings did not make much sense with respect to the elephant as an animal. Given the opportunity to examine all aspects of the elephant, the seventh person came up with an answer, which was quite different from the rest, but closer to how an elephant really looks. A measure on a single life-cycle metric is like examining a portion of the elephant’s morphology. Concurrent engineering views the industrial design as a part of a PD 3 process. It evaluates the artifact as a system that has a wider impact than just suboptimizing each subsystem within its own domain. Consequently, an approach to adequately measure these conflicts and a resolution methodology for making high-level design trade-off between the issues is required. For product development this may mean establishing metrics, and measuring scores of product values that are important for the customers, the company, or both. Such measures can focus on internal ~employees, product development teams! and0or on external customer requirements ~buyers of your own products, buyers of your competition’s products, vendors, and partners!. Monitoring and tracking progress against established targets results in
165
identification of product realization gaps. The gaps, in this context, are used here to signify the differences between the actual ~meaning what is realized during a life-cycle design improvement process! and the desired or the ideal product features. Gaps can also result from the existence of conflicts or conflicting design specifications. Metrics are measures that indicate ~in relative or absolute terms! where “gaps exist” in the product realization process. Thus, such metrics are closely associated with life-cycle assessments and evaluations ~Prasad, 1995!. Concurrent Engineering needs:
• •
A series of measures ~or measurement criteria! that are distinct to each process, and A set of metrics to check ~and validate! the outcome, when two or more of the processes are overlapped or required to be executed in parallel.
Because product realization involves concurrent processes that occur across multiple disciplines and organizations, appropriate metrics and the methods of qualifying them vary considerably. Choice of the appropriate metrics depends on the availability of data, its incompleteness, amount of overlap, ambiguity, etc. Metrics too change with time as new data or a new taxonomy or new picture for product realization emerges. This paper provides insight into mechanisms to ensure effective trade-off across conflicting lifecycle values, customer requirements, and their inclusion in the PD 3 process. Section 2 discusses possible range of lifecycle assessments, a PDT member or a designer may perform on a product depending upon the severity of its operations, its actual use in the field, and criticality of failures on safety and quality while designing and developing it. Section 3 describes possible categories of life-cycle measures and metrics that are needed from an initial conception to final delivery of a product. Section 4 describes the various types of life-cycle cost drivers that one may encounter during needs-to-delivery ~art-to-part! phase, during deliveryto-disposal phase and during disposal-to-recycling phase. Section 5 discusses metrics of measurements that one may use for assessing life-cycle performances, ease, economy, etc. Section 7 provides mechanisms ~how to perform or to ensure effective trade-off ! across conflicting life-cycle values that one may choose. Section 8 contains discussions of the advantages of developing knowledge-based predictions ~like value characteristic metrics! and their impact on improving product and process design. 2. ASSESSMENT OF LIFE-CYCLE VALUES The product realization process is not complete, until certain types of product and process life-cycle values are completely assessed and their results are satisfactory ~McNeill et al., 1989!. An assessment may be carried out in qualitative terms ~such as in design guidelines, heuristics, and rules of thumb! or in quantitative manners ~such as in terms of numbers, logic, limits, or sets!. Quantitative measures pro-
166
B. Prasad
vide a degree of objectivity in the range of assessments ~Deming, 1993!. This may also include existence of certain information that are essential for manufacturing, customer satisfaction, or for the company profitability. Performance assessment is just an example of life-cycle values that a product must be evaluated against. Even though performance is an important life-cycle value, it only represent a subset of what need to be satisfied in a product. The major types of life-cycle assessments for mechanical components fall into the following seven distinct categories see Table 1 ~Prasad, 1996!. Assessments on the life-cycle values range from measuring performance on the product on one end to maintaining logistics on another end. If we consider all possible assessments that are applicable during a life-cycle development process, the Total-body of assessments can be written as @see Eq. ~1!#: Total Body of Assessments 5 Union-of @Performance-set, System behavioral modeling-set, Manufacturing Precision or ~1! Quality-set, Robustness-set, Ownership Quality-set, Product Retirement-set, Logistics-set, etc.#
Each individual value-set ~such as performance-set, system behavioral modeling-set! represents a subset of the mea-
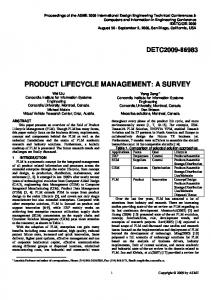
sures on each chosen value. As stated in the last column of the Table 1, some of the above measures are required for an organization to become lean, while others are to become agile. 3. ESTABLISHING LIFE-CYCLE MEASURES AND METRICS At the heart of any good PD 3 process, there lays a good life-cycle design focus on satisfying the interests of the customers and the company. The customer focus shows up in measures or measurement criteria ~such as market research targets, performance, field, or warranty measures! that a company imposes in response to what customers’ desire in a product. The company focus shows up in another set of measurement criteria or measures ~such as built-in prevention measures by design, on-line process measures, inspection measures, and diagnostic measures!. Both of these measures assess the company’s ability to manufacture a quality product that a customer would buy or like. Life-cycle measures generally fall into the following seven categories ~see Fig. 2!. It is assumed that the appropriate metrics and measures are used during product realization process as feedback ~Prasad, 1996!. Metrics provides answers to a broad range of life-cycle design questions related to the problem formulation, design, engineering, manufac-
Table 1. Major types of life-cycle assessments for mechanical components Types of Life-cycle Assessments Performance
System Behavioral Modeling
Manufacturing Precision or Quality
Robustness
Ownership Quality
Product Retirement
Logistics
Definitions
Typical Examples
What Does this Impact?
Performance is a class of measures that ensures product functions the way it was designed for. System behavioral modeling is a class of measures that ensure that all of its components in the set function as a whole. Ensures that revisions are maintained before, during and after manufacturing ~machining, forging, assembly, turning, etc.! Robustness ensures that the resulting design is insensitive to most process type variations.
Basic geometry design, functionality, performance design, component’s design Assembly modeling, Modularity, interchangeability, DFA0DFM assembly design ~Boothroyd & Dewhurst, 1988b! Detailed dimensions, roundness, eccentricity, surface finish, texture, quality control ~QC!, material and process selection, and tolerances Insensitivity to manufacturing variations, material types, environmental, and operational variations. ergonomics, reliability, diagnosability, testability, and serviceability
Leanness
Ownership quality ensures that the product functions0works the way it was intended to work and originally designed for. Product retirement deals with recycling aspect of product development, such as green engineering, waste management, etc. Logistics deal with considerations that are nonmanufacturing and nontechnical.
Agility
Agility
Agility
Leanness
disassembly, reuse, recycling, waste management
Leanness
Purchasing, inventory, international use, environmental standpoint, lead-time, supply chain scheduling, cost-drivers, product support, etc.
Agility
Life-cycle measures and metrics for concurrent product and process design
167
Table 2. Life-cycle measures, their descriptions and examples Life-Cycle Measures
Definitions0Descriptions
Examples or Usage
Market research targets
These determine the extent to which customer satisfaction prevails in product development. This is commonly listed in WHAT column of a QFD ~Hales et al., 1990! matrices. These are measures that are factored in when the parts were initially conceived ~way before design approval! to prevent any future mishaps.
Examples of market research targets are strategic planning, product plans, organizational goals, meeting goals, business objectives, market share projections, estimations, etc. Examples of built-in measures are error-proofing, kaizon, fail-safe design, design for consistency, design for insensitivity to parameter variations, and design for reliability, etc. Metrics is internally focused on machines, processes, and operators.
Built-in prevention measures (by design)
On-line process measures
Diagnostic measures
Inspection measures (on-line or off-line)
Performance measures
Field or warranty measures
These are metrics that determine the cause of a process malfunction, such as deterioration of product or process area manufacturing quality, machine failures, finish quality, tolerance variation, scale marks, etc. These are metrics that ascertain why a product or process is failing to perform as expected. Diagnostic measures determine which features of the structure part, or of the design prototype, are the cause of failures or introducing out of norm behavior. Inspection measures are less desirable because they commonly deal with fixing a problem. They do not eliminate the cause of the problems or detect and eliminate the source of the problems. Performance measures are high-level metrics that assess the overall performance of products or processes including team and the organization. Product performance are generally associated with performance measures in the field, or in customer use of the products compared to their competitors. These measures are customer focused and, therefore, are externally based. These are metrics that assess the product use in the field in terms of its maintenance, upkeep, and warranty costs. Most measures are customer focused.
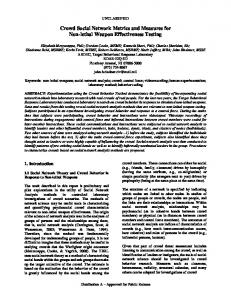
turing, assembly and operation. Such metrics must comprise of several life-cycle perspectives, each representing a supplement of or an add-on to this collection. Each must contribute to the overall effectiveness of the total product realization process. Eight performance indicators is shown in Figure 3 ~see Wilson & Greaves, 1990; Prasad, 1996!. An indicator represents a combined outcome of doing two major efforts in a company: “doing things right” and “doing the right things.” Doing things right is measured by the efficiency of doing 7Ts, 3Ps, 6Ms, and0or 7Cs ~Prasad, 1996!. Doing the right things is measured by the effectiveness of doing 7Ts, 3Ps, 6Ms, and0or 7Cs ~details are given in Table 3!. The desired result is the product of the two col-
In the product area, diagnostic measures might include test results, MTBF ~mean time between failures! analysis, FMEA ~failure mode and effect analysis!, reliability checks, quality indices, etc.
Because of these reasons, inspection measures are sparingly used in aggressive and agile corporations.
Examples of product performance include user productivity gains, response0turnaround time, selling price, perceived quality, etc. to the end-user. Process performance measures are often internal ~such as employee productivity, team responsiveness, cost of development, time-to-market, quality content of the manufactured product, and those measures that are relevant to manufacturers mostly. Examples include customer-found faults, maintenance costs, customer satisfaction index, etc.
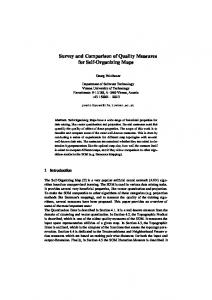
umns in Table 3. The items in each of the two categories and the desired result are outlined in Table 3. 4. LIFE-CYCLE COST DRIVERS There are three main cost drivers during an entire product life from its conception to grave: company costs, user costs, and society costs ~see Fig. 4!. The goal of the life-cycle design is to maximize the value of a product, while containing its impact on cost to manufacturer, the user and the society to a minimum. Cdrivers 5 f @Ccompany ,Cusers ,Csociety #
~2!
168
B. Prasad
Fig. 2. Common life-cycle measures and metrics.
where, Cdrivers stands for cost drivers;
penalties or taxes in terms of the use of freon in air conditioners, refrigerators, and freezers.
Ccompany , Cusers , and Csociety represent the cost contributions associated with the company, the user, and the society.
Cusers ' Cdelivery-to-disposal
Company costs are the costs of activities required in planning, design development, assembly, production, distribution, and servicing a quality product. It includes all costs that are incurred from needs-to-delivery until the product is shipped to the customer. Company costs are of two types: direct and indirect costs. Direct costs results from highly visible and documented costs of labor and material used on the factory floor. Indirect costs are everything other than labor and materials. Ccompany ' Cneeds-to-delivery
~3!
User costs are the costs to the users of those activities that are performed by the user from the time when the product is delivered or shipped, to its disposal when the ownership ends. User costs will begin to include the costs for recycling or disposal. As an example, in some U.S. states, consumers are now forced to pay a disposal fee for old tires when new tires are purchased. Consumers may begin to pay
~4!
The society costs are the expenses that are inflicted on the society from the time the product is in user custody until it is disposed of or recycled safely. The ability to recycle the material, or its impact on the environment, is the major contributing cost to society. These have already began to increase, even though, many of these costs are intangible and unable to be measured or quantified accurately. Csociety ' Cdisposal-to-absorption
~5!
Most engineering and design teams do not go far enough in reducing life-cycle driver costs. Most focus on the company costs and in a narrow sense just concentrate on the direct costs. Few teams attack the company’s greatest cost challenge—the indirect costs. It is interesting to note that indirect company costs can reach 4–5 times larger than the direct ~company! costs ~Hartley, 1992!. In spite of this, only a small portion of any engineering team consider reducing it during design and development phase. Most remaining
Life-cycle measures and metrics for concurrent product and process design
169
Fig. 3. Performance indicators for measuring an enterprise competitiveness.
Table 3. Measuring a performance indicator Desired Result Desired Result Less unscheduled changes More overall productivity Less time-to-market Less cost-to-quality More profitability Less inventory Better quality Great product Increased safety Increased stability Increased flexibility Increased market growth More customer satisfaction
5 Doing Things Right
3 Doing the Right Things
~is measured by the efficiency of doing the following:!
~is measured by the effectiveness of doing the following:!
Integrated Product Development ~IPD! Integrated Product and Process Organization ~PPO! 7Ts ~Talents, Tasks, Team, Time, Technique, Technology, and Tools!. 3Ps ~Practices, Procedures, and Policies! 6Ms ~Machine, Management, Manpower, Materials, Methods, and Money! 7Cs ~Collaboration, Commitment, Communication, Compromise, Consensus, Continuous Improvement, and Coordination! * * *
Total Value Management ~TVM! Concurrent Function Deployment ~CFD! QFD ~Quality Function Deployment!, TQM ~Total Quality Management!, C4 ~CAD0CAM0CAE0CIM!, etc. 7Ts 3Ps 6Ms 7Cs * * *
170
Fig. 4. Life-cycle cost drivers.
B. Prasad
Life-cycle measures and metrics for concurrent product and process design product design teams believe indirect costs can only be attacked either at the management level or during production, or manufacturing assembly phase of its life cycle. Japanese have shown that it pays off to deal with such costs early in the design process ~Wilson & Greaves, 1990!. 5. METRICS OF MEASUREMENTS The success or failure of CE, to a large extent, depends on the team’s ability to define useful metrics of measurements ~MOMs!. Most MOMs include many of the so-called 7Ts ~talents, tasks, teamwork, techniques, technology, time, and tools! characteristics. They measure things that are related to state of completeness of specifications, such as transformation feasibility, efficiency, performance, effectiveness or goodness ~a fitness function! of outputs. If ( denotes a union-sum of metrics of X-ability measurements, its magnitude will equal one when the artifact is complete ~contentwise! and the constraint space is empty. IF: THEN:
~6! ( [ ø @ $MOMs% # ( 5 1, if artifact is complete ~content-wise! and
the corresponding constraint space is empty ~Prasad, 1997!.
171
In Eq. ~6!, it is assumed that each MOM is a normalized set.
6. COUPLING OF VALUE CHARACTERISTIC METRICS (VCM) WITH AI OR RULES INFERENCING OF A KNOWLEDGE-BASED SYSTEM The first step in CE is to develop predictors ~metrics for the object systems! and the supporting analysis, tools or concepts for assessing product, process, and system behaviors. Types of analysis, tools, or concepts required to assess the value characteristics are contained in Figure 5. They are categorized according to the level of analysis details required: identify, analyze, plan, evaluate, and performance-to-plan. Many of them are off-the-self tools, which a company can buy and integrate. Some are “product specific”; others are “process specific.” The required analysis tools are categorized in accordance with the needs and purpose—where during the PD 3 process such tools are used and the purpose of using them. The six needs identified during a PD 3 process are business, design, supportability, production, operation, and decision support ~Gladman, 1969!. The purposes of using
Fig. 5. Types of analysis tools or concepts required.
172 the tools have been categorized in accordance with the types of actions taken—to identify, to analyze, to plan, to evaluate, to validate or check performance-to-plan. Four types of CE metrics and measures are contained in Figure 6. They are arranged in four file drawers of a file cabinet. PDTs can draw upon these metrics to influence PD 3 process. Metrics and measures are categorized into four groups. For example, metrics for X-ability assessment, such as design for manufacturability ~DFM! ~Boothroyd, 1988! or design for assembly ~DFA! ~Boothroyd & Dewhurst, 1988b!, design for flexibility can be effective in reducing the number of parts or processes. Metrics for modular design for subassembly, design for interchangeability, and design for flexibility can be effective for reducing cost. Product quality and feasibility assessment matrices are used to incorporate voice of customers into products, such as features assessment, minimum materials usage, etc. Metrics for process quality assessment can be effective for ensuring the product’s agility, such as gathering data pertaining to a specification history, performance, precision, tolerances, etc. Simulation and analysis ~S&A! are also MOMs for driving corrective action, such as material features substitutions or selections, assembly variational analysis, finite element analysis ~FEA!, factory simulation, Numerical Control tool-path, failure mode and effect analysis, risk assessment, etc. The second step is to use the aforementioned predictors ~metrics for the object systems! and the supporting analysis, tools or concepts for optimizing or balancing the product and process behaviors. The life-cycle value characteristics metrics ~VCM! discussed earlier, by itself, are useful for predicting systematic behaviors when subjected to an appropriate analysis or simulation. Users are left with making hard decisions as to what changes in the product or process would be more appropriate. However, such decisions are not algorithmic ~meaning purely heuristics or analytical! and do not carry the product design to its next stage that is to synthesize the design so that most of the VCM measures are not conflicting. An artificial intelligence ~AI!-based methodology or an inferencing ~decision-support! method as in an expert system or a Knowledge-based systems ~KBS! could be used to keep these metrics, measures of merits, and analyses tasks in balance and to provide a feasible design whose characteristic behaviors are within its bounds ~specified limits!. Most of the analysis tasks or concepts, contained in the MOM file cabinet ~see Fig. 6! and of quantitative types can be easily computerized into a KBS. A few analysis tasks or concepts, which are not included in the file cabinet, could be a part of a heuristic-type conceptual library ~similar to what is shown in Fig. 5!. A VCM can be implemented as checking rules of a knowledge-based PD 3 process or a system, which continually monitors CAD progress relative to its specifications. An Expert system or KBS could incorporate warnings for getting the attention of designers or process planners when checking rules are unsatisfied, when parameters appear “outof-bounds,” or when processes ~e.g., cutting too-path! appear “out-of-control.”
B. Prasad A primary advantage of combining VCM with a KBS, rather than its ad hoc use through primitive behavioral modeling, is that it captures the rules for changing the behaviors along with the stated ~most desirable! behavioral limits themselves. The two together formalize the original product development process into an iterative design optimization process supported by predictive engineering rules and supporting analyses. Such a coupling of VCM with KBS exposes errors and inefficiencies that are often overlooked by an interactive CAD designer. It is difficult for a designer to remember and apply all checks while creating the design because design is often intertwined with the complexity of the product realization process. 7. MAKING TRADE-OFF WITH KNOWLEDGE-BASED VCM Take for example a unit case of design for reliability ~DFR!. Implementing DFR during a design phase requires that tolerance limits on the design be specified as large as possible. This increases the domain of operability of the designed parts in various functional modes. However, during a manufacturing phase, design for manufacturability and assemblability ~DFMA! implementation requires that tight tolerance limits be imposed to control or reduce the variability of the manufactured parts. The conflicting requirements of the design specifications in DFR and the manufacturing specifications in DFMA on parts are pictorially shown in Figure 7. Now take for example a unit case of Design for robustness ~DFRo!. DFRo is based on a third set of criteria. It does not relate to either maximizing or minimizing the tolerances. DFRo relates to desensitizing the uncontrolling parameters so that their effects on tolerance variations are nullified ~Table 4!. DFRo is a measure of insensitivity to variations in design due to factors such as manufacturing processes, environmental factors, operations, and deterioration through use. Robust design is a process of product design that is tolerant of uncontrolled variation, that is, which consistently conforms to the original design intent in spite of external and internal noises that may be present. Such product designs are classified as more reliable or robust than those that are sensitive to such variations. In a broader sense, robustness has also been defined as insensitivity to variation in product performance and behavior with respect to one or more of the items in Table 5. 8. GAINING OPERATIONAL EXCELLENCE WITH VCM AND KBS Decisions made in early stages of design processes have profound effects on later stages as explained in Prasad ~1996!. Right decisions, if timely folded in, can produce tremendous savings in the life-cycle cost of a product. Conversely, the price paid for late or wrong decisions can be devastating. Early right decisions can ensure business success by enabling the production of better performing, more robust,
Life-cycle measures and metrics for concurrent product and process design
Fig. 6. File cabinet of CE metrics and measures.
173
174
B. Prasad
Fig. 7. Tolerance—Maximize or minimize?
and more reliable products. This requires determination of some key VCM that make a product robust and reliable. In traditional organization, however, information on such behavior characteristics ~VCMs! is obtained only after a great
delay, by which time the product concept is mostly frozen. It is too late then to make any major product design modification decisions. The development of VCM—as contained in Figure 6—depends upon the 3Ps, 6Ms, 7Ts, and
Table 4. Examples of what to maximize, minimize and desensitize? Minimize Lead Times Time-to-market ~Responsiveness! Design changes during downstream operations Number of revisions Unscheduled changes Use of Critical Processes
Unit costs, cost-to-quality Material removal Obsolete technology Disjoint systems Defects per million Controversy
Inventory Wastes and reworks
Maximize
Desensitize
Fast Delivery Standardization CALS, PDES, EXPRESS, CE
Variations
Design simplicity Design intent capture Life-cycle capture Process reliability and predictability Manufacturing strategies and standards ~DFA, DFM, RMS, DFQ, etc.! Profitability ~ROI! performance Advanced technology Use of CAD0CAM, CAX, EDI, etc. Use of KBE, AI, Fuzzy logic Quality Cooperation Supplier involvement, teamwork management involvement Customer satisfaction productivity Throughput agility
Design variations, Tolerances Schedule changes Process variations Process variations Material properties variations Cost variations Variation in common systems
Variation in quality Human factors variations
Change in partners in a supply-chain loop Variation in throughput
Life-cycle measures and metrics for concurrent product and process design
175
Table 5. Possible triggers that impact product and process robustness Triggers that Impact Robustness Change in market and customer needs Change in process plan, machine, and production technology Evolution path of the product developed over time Current and future model variation Piece-to-piece variation due to manufacturing, imperfection, etc. Future change in manufacturing conditions Functional variation due to changes in the inner inherent properties of the system Variation between subunits External noise
7Cs prevalent in an enterprise. However, their successful use requires their integration into a KBS. The two ~KBS 1 VCM! together can serve as a process map for checking a variety of DFX compliance, for validating engineering designs, and for satisfying the desired requirements at the appropriate places in the life-cycle design. Compliance can be checked for robust design, design optimization, collaborative work, design for manufacture, and design for assembly, to name a few. VCM with automatic rules checking ~of an AI or an expert system! can be used for risk reduction, allowing new product concepts to be investigated earlier in their design cycle by all members of an integrated PDT. The clear advantage of developing predictions ~such as metrics, computer models, or simulations! and developing feasible solutions ~functional alternatives, designs with satisfying behaviors, balancing of constraints! is that changes or improvements to the total product and process design can be made earlier, when costs of such changes are less. X-ability measures can be extracted and captured as a part of such KBS or smart ~rule-based simulation, rule-based optimization! models. This enables strategic use of KBS models at an early stage of design, rather than being forced to use operational or tactical use of DFX tools to track or fix the local problems. Such tactical use of DFX limits them to be used mostly for handling problems discovered later in the life cycle or when design is relatively set. The coupling of KBS with VCM, on the other hand, enables the various designs for X-abilities to be incorporated in the PD 3 process at an early life-cycle stage. The applied and theoretical AI researchers and engineers could use some of the metrics in Figure 6—possibly as an evaluation criteria for a specific KBS application such as CAD adviser, as done to some extent with simple matrices ~Joshi, 1991!. In addition to their use in the product realization situations, effective use of value characteristic metrics in a KBS framework shall do the following:
Examples Parts recall, price drop, safety considerations, out-of-fashion Machining vs. stamping; forging vs. molding, material substitutions Off-the-self, shrink-wrap, new technology, new trend, new focus, new way, etc. Front drive vs. rear drive; automatic vs. stick drive, gasoline vs. diesel fuel, etc. Flaws, cracks, wrinkles, cut, warpage, dent, oil canning, etc. Springback, shrinkage, draft, cooling and heating, material hardening, etc. Include deterioration, wear, tear, flaws, cracks, fatigue, corrosion, etc. Fits and clearances, texture, color, etc. Such as environmental conditions ~temperature, humidity, and dust! and other customer usage conditions.
• • • • • • • • • •
Identify process bottlenecks, flag them or could outrightly eliminate root causes of failures or defects. Serve as an intelligent tool for assessing, evaluating, and improving performance and efficiency. Help teams capture and retain the best practices and manage the engineering processes better. Determine when and where to apply 7Ts ~talents, tasks, teamwork, techniques, technology, time, and tools!. Monitor progress and take corrective actions during product realization. Identify conflicting behaviors and minimize PPO ~product, process, and organization! complexity. Increase multicriterion objectivity and improve overall system productivity. Identify best product features and practices and to determine what matters the most. Reorganize the engineering tasks and make critical decisions earlier in the life cycle. Grade performance, categorize changes and move toward trade-off or optimization.
One way to achieve effective integration of measures and metrics into the product development process is to perform knowledge-based product mock-ups or intelligent demonstrations. Intelligent demonstration techniques are needed at all levels of an enterprise—beginning with the strategic enterprise level and the product and process realization cycles, to the factory floor where real-time performance measurement is done ~Dika & Begley, 1991!. Intelligent demonstrations provide methods of proving that a planned system is working and of establishing what corrective actions may be needed. 9. CONCLUDING REMARKS The paper describes a coupling between a large suit of lifecycle measures and metrics ~called VCM! and a knowledge-
176 based system so that VCM predictions can be used to balance product behaviors or to reach, a balanced life-cycle design. The VCM, described in this paper, in its own right, provides a tool for the designers to assess the company’s ability to manufacture a quality product in less time and cost. Life-cycle knowledge management encompasses integrating all metric activities under a unified view of the entire product realization objectives. Life-cycle knowledge management provides a measure of estimating fielded ~system level! performances through examining the interactions among the life-cycle metrics such as DFR, DFM, and design for supportability ~DFS!. The coupling of VCM and a KBS tool provides an inferencing method for balancing the life-cycle predictions for satisfying the applicable behavioral constraints, and for realizing an optimized life-cycle design. A knowledge-based checker system is an example of a KBS, which uses analytical and simulation modeling techniques to predict fielded system performance, and uses the results to influence customer satisfaction and company profitability. This coupling of KBS with VCM could give rise to a more satisfied customer with a realized product that is more likely to function free of fault, and a product easier to restore to full term and functionality at a lower production cost and scheduled time. REFERENCES Boothroyd, G. ~1988!. Making it simple: Design for assembly. Mechanical Engineering 110(2), 28–31. Boothroyd, G., & Dewhurst, P. ~1988a!. Production design for manufacture and assembly. Manufacturing Engineering, April, 42– 46. Boothroyd, G., & Dewhurst, P. ~1988b!. Design for assembly: Handbook. University of Massachusetts, Amherst, MA. Carter, D., & Baker, B. ~1992!. Concurrent engineering: The product development environment for the 1990s. Addison Wesley Publishing Company, Cambridge, Massachusetts. Deming, W.E. ~1993!. The new economics, MIT Center for Advanced Engineering Study, Cambridge, MA. Dika, R.J., & Begley, R.L. ~1991!. Concept development through teamwork—Working for quality, cost, weight and investment. SAE Paper #910212, Proc. SAE Int. Congress and Exposition, pp. 1–12. SAE Press, Detroit, MI. Green, N., & Reder, M. ~1993!. DFM boosts U.S. car quality. Machine Design 65(9), 61– 64. Gladman, C.A. ~1969!. Design for production. Annals of the CIRP XVII, 5–12. Hales, R., Lyman, D., & Norman, R. ~1990!. Quality function deployment and the expanded house of quality. Technical Report, International TechneGroup Inc., Ohio. Hartley, J.R. ~1992!. Concurrent engineering: Shortening lead times, raising quality, and lowering costs. Productivity Press, Cambridge, MA. Joshi, S.P. ~1991!. Decision making in preliminary engineering design. AI EDAM 5(1), 21–30. Makino, A., Barkan, P., Reynolds, L., & Pfaff, E. ~1989!. A design-forserviceability expert system. Proc. ASME Winter Annual Meeting, pp. 213–218. San Francisco, California. McNeill, B.W., Bridenstine, D.R., Hirleman, E.D., & Davis, F. ~1989!. Design process test bed. Proc. Winter Annual Meeting of the ASME, pp. 117–120. ASME, San Francisco, California.
B. Prasad Nevins, J.L., & Whitney, D.E. ~1989! Concurrent design of products and processes. McGraw-Hill, New York. Parsaei, H.R., & Sullivan, W.G. ~eds.! ~1993!. Concurrent engineering: Contemporary issues and modern design tools. Chapman and Hall, London. Patton, J. ~1980!. Maintainability and maintenance management. Instrument Society of America, Research Triangle Park, NC. Prasad, B. ~1995!. JIT quality metrics for strategic planning and implementation. Int. J. Operations and Production Management 15(9), 116–142. Prasad, B. ~1996!. Concurrent engineering fundamentals: Integrated product and process organization, Vol. I. Prentice Hall, Saddle River, New Jersey. Prasad, B. ~1997!. Concurrent engineering fundamentals: Integrated product development, Vol. II. Prentice Hall, Saddle River, New Jersey. Shina, S.G. ~1991!. Concurrent engineering and design for manufacture of electronics products. New York, Van Nostrand Reinhold. Wilson, P.M., & Greaves, J.G. ~1990!. Forward engineering—A strategic link between design and profit. Mechatronic Systems Engineering I, 53– 64.
Dr. Biren Prasad earned his Ph.D. from Illinois Institute of Technology, Chicago, a Degree of Engineer from Stanford University, California. He received a Master ~M.S.! degree from Indian Institute of Technology, Kanpur and a B.E. Degree from Bihar College of Engineering, Patna, both in India. While completing studies for his “D’Engineer”, he worked at Xerox Research Center, and Failure Analysis Associates, both at Palo Alto, California. Dr. Prasad is the Director, Knowledge-based Engineering Product Business Unit at Unigraphics Solutions ~UGS!. Before joining UGS in 1998, he was the Principal Consultant and Director of Concurrent Engineering Services at Electronic Data Systems ~EDS! ~an ex-subsidiary of General Motors!, where he was in charge of Automated Concurrent Engineering consulting Group since 1985. Dr. Prasad has written or co-authored over 100 technical publications. He served as the General Chairperson on two International Conferences: ISPE’s CARS & FOF ’88 Conference held in Detroit, MI ~1988! and 31st, AIAA0ASME0 ASCE0AHS0ASC Structural, Structural Dynamics and Materials Conference ~SDM’90!, held in Long Beach, CA ~1990!. He was the President of the International Society for Productivity Enhancement ~ISPE!. He has received three awards: ~1! AIAA’s Survey Paper Citation Plaque & Award ~1982!, ~2! a NASA Award and a Certificate for Creative Development of a Technical Innovation on “ PARS”— Programs for Analysis and Resizing of Structures ~1981!, and ~3! the ABI ~American Biographical Institute! Commemorative Medal of Honor ~1987!. Dr. Prasad is the Managing Editor for the International Journal of Concurrent Engineering: Research & Applications (CERA). His professional honors include: Associate Fellow of AIAA, Fellow of ASME, ASCE, SAE, AAAI, and fellow and life member of ISPE.