Genomics Data 12 (2017) 28–37
Contents lists available at ScienceDirect
Genomics Data journal homepage: www.elsevier.com/locate/gdata
SVMRFE based approach for prediction of most discriminatory gene target for type II diabetes Atul Kumar a,⁎, D. Jeya Sundara Sharmila b, Sachidanand Singh a a b
Department of Biotechnology and Health Sciences, Karunya University, Coimbatore, Tamil Nadu, India Department of Nanosciences and Technology, Tamil Nadu Agriculture University, Coimbatore, Tamil Nadu, India
a r t i c l e
i n f o
Article history: Received 29 November 2016 Received in revised form 7 February 2017 Accepted 15 February 2017 Available online 17 February 2017 Keywords: Type II diabetes SVMRFE Microarray Protein-protein interaction t-test
a b s t r a c t Type II diabetes is a chronic condition that affects the way our body metabolizes sugar. The body's important source of fuel is now becoming a chronic disease all over the world. It is now very necessary to identify the new potential targets for the drugs which not only control the disease but also can treat it. Support vector machines are the classifier which has a potential to make a classification of the discriminatory genes and non-discriminatory genes. SVMRFE a modification of SVM ranks the genes based on their discriminatory power and eliminate the genes which are not involved in causing the disease. A gene regulatory network has been formed with the top ranked coding genes to identify their role in causing diabetes. To further validate the results pathway study was performed to identify the involvement of the coding genes in type II diabetes. The genes obtained from this study showed a significant involvement in causing the disease, which may be used as a potential drug target. © 2017 The Authors. Published by Elsevier Inc. This is an open access article under the CC BY-NC-ND license (http://creativecommons.org/licenses/by-nc-nd/4.0/).
1. Introduction Support Vector Machine (SVM), a machine learning technique implied in the area of time series prediction and classification [31,36] has widely been applied in the life science fields, especially in Bioinformatics. It can handle nonlinear classification tasks efficiently by mapping the samples into a higher dimensional feature space by using a nonlinear kernel function. Since the SVM approach is data-driven and modelfree, it has important discriminating power for classification. This characteristic of SVM is obvious in cases where the sample sizes are negligible and numerous variables are involved (high-dimensional space). Expression profile come under such a category, which contain a large number of attributes (genes). This type of expression data is used to predict the type and occurrence of the disease in a patient [39]. An important aspect while analyzing such type of expression data is the feature selection or dimensionality reduction. Most algorithms lose their potency when genes are large in number with different time series data or dimensionality [7]. To accomplish the task of dimensionality reduction a modified version of SVM known as SVMRFE (Support Vector Machine Recursive Feature Elimination) has been used in this work. SVMRFE was used to identify the most discriminatory target gene in four different microarray
⁎ Corresponding author. E-mail address:
[email protected] (A. Kumar).
data samples of type II diabetes. These samples have been taken from the Gene Expression Omnibus database (GEO) [13] and Diabetes Genome Anatomy Project (DGAP) (http://www.diabetesgenome.org/). The idea was to build a model wherein the least important features (genes) can be eliminated at each iterative step based on the weight assigned to each gene through SVM. The genes identified through this approach were then classified as essential and non-essential genes. The protein-protein interaction of these non-essential genes revealed vital information regarding interacting proteins. Functional enrichment about these proteins shed a light on their regulatory pathways associated with type II diabetes which can be further explored and confirmed using experimental approach. 2. Materials and methods 2.1. Collection of data sample 71 samples from Pancreatic Islet and Skeletal muscle of Homo sapiens were collected from the GEO and DGAP. Out of these 37 samples are of normal human beings and 34 are of diabetic humans. Table 1 shows the detail description of each of the data sets which were undertaken for studies. Fisher linear discriminant was applied to all the above-mentioned data sets to rank them based on the Fischer score [21] which was continued with a redundancy reduction step to reduce the redundant data in the microarray dataset [22]. The gene number present in each data set
http://dx.doi.org/10.1016/j.gdata.2017.02.008 2213-5960/© 2017 The Authors. Published by Elsevier Inc. This is an open access article under the CC BY-NC-ND license (http://creativecommons.org/licenses/by-nc-nd/4.0/).
A. Kumar et al. / Genomics Data 12 (2017) 28–37
29
Table 1 Microarray dataset undertaken for studies. Source
GEO DGAP DGAP DGAP
Data
No. of samples
Effect of insulin infusion on human skeletal muscle [33] Human pancreatic islets from normal and Type 2 diabetic subjects (A) [18] Human pancreatic islets from normal and Type 2 diabetic subjects (B) [18] Human skeletal muscle - type 2 diabetes [29]
Normal
Diabetic
6 7 7 17
6 5 5 18
No. of genes
Country
22,215 22,191 22,550 22,177
Sweden Caucasian and Asian Sweden
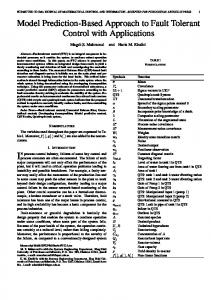
Fig. 1. Flow chart of the analysis.
was still high. A t-test [3] with a significance level of 0.05 was applied to the datasets to filter out the genes which are not involved in causing type II diabetes. After this reduction step SVMRFE approach (with linear kernel function and 6 subsets of the training data) [24] was applied to train the data samples for 5 iterations. As a result, discriminatory genes based on the weighted ranking were obtained. The identified genes were identified as being essential and non-essential using the database of essential genes. A gene interaction and pathway analysis of the potential non-essential genes was performed to identify the novel targets for type II diabetes (Fig. 1) 3. Result and discussion 3.1. t-test analysis For each of the T2D datasets, a t-test analysis was performed with a significance level of 0.05. As a result, there was a high dimensionality Table 2 Number of input and output genes from each dataset for t-test analysis. Name of dataset
No of inputted genes
No of genes rejecting the null hypothesis
Effect of insulin infusion on human skeletal muscle Human pancreatic islets from normal and type II diabetic subjects (A) Human pancreatic islets from normal and type II diabetic subjects (B) Human skeletal muscle-type II diabetes
1223 1210
24 17
803
21
1238
28
Table 3 p-value of genes following the alternative hypothesis for the dataset “GSE7146”. Probe id
Gene
213524_s_at G0/G1switch 2 216599_x_at Solute carrier family 22 (organic anion transporter), member 6 207295_at Sodium channel, non-voltage-gated 1, gamma 218409_s_at DnaJ (Hsp40) homolog, subfamily C, member 1 203221_at Transducin-like enhancer of split 1 (E (sp1) homolog, (Drosophila) 210452_x_at Cytochrome P450, family 4, subfamily F, polypeptide 2 201630_s_at Acid phosphatase 1, soluble 207955_at Chemokine (C-C motif) ligand 27 208507_at Olfactory receptor, family 7, subfamily C, member 2 210889_s_at Fc fragment of IgG, low affinity IIb, receptor (CD32) 207732_s_at Discs, large homolog 3 (neuroendocrine-dlg, Drosophila) 220636_at Dynein, axonemal, intermediate polypeptide 2 205863_at S100 calcium binding protein A12 205603_s_at Diaphanous homolog 2 (Drosophila) 220979_s_at ST6 (alpha-N-acetyl-neuraminy l-2, 3-beta-galactosy l-1, 3) -N-acetylgalactosaminide alpha-2, 6-sialyltransferase 5 206310_at Serine peptidase inhibitor, Kazal Type II (acrosin-trypsin inhibitor) 210442_at Interleukin 1 receptor-like 1 201214_s_at Protein phosphatase 1, regulatory subunit 7 220385_at Junctophilin 2 205490_x_at Gap junction protein, beta 3, 31 kDa (connexin 31) 213772_s_at Golgi-associated, gamma adaptin ear containing, ARF binding protein 2 213950_s_at Protein phosphatase 3 (formerly 2B), catalytic subunit, gamma isoform (calcineurin A gamma) 201681_s_at Discs, large homolog 5 (Drosophila) 220782_x_at Kallikrein-related peptidase 12
p-Value 0.00001 0.00005 0.0001 0.0003 0.0004 0.001 0.001 0.002 0.002 0.002 0.002 0.002 0.002 0.003 0.003 0.004 0.004 0.004 0.004 0.004 0.004 0.004 0.004 0.004
30
A. Kumar et al. / Genomics Data 12 (2017) 28–37
Table 4 p-Value of genes following the alternative hypothesis for the dataset “human pancreatic islets from normal and type II diabetic subjects (A)”. Probe id
Gene
207406_at 214046_at 213980_s_at 202854_at 215300_s_at 212894_at 202605_at 203196_at 205633_s_at 207673_at 209759_s_at 208926_at 205627_at 210284_s_at 213931_at
Cytochrome P450, family 7, subfamily A, polypeptide 1 Fucosyltransferase 9 (alpha (1,3) fucosyltransferase) C-terminal binding protein 1 Hypoxanthine phosphoribosyltransferase 1 Flavin containing monooxygenase 5 Suppressor of var1, 3-like 1 (S. cerevisiae) Glucuronidase, beta ATP-binding cassette, sub-family C (CFTR/MRP), member 4 Aminolevulinate, delta-, synthase 1 Nephrosis 1, congenital, Finnish type (nephrin) Enoyl-CoA delta isomerase 1 Sialidase 1 (lysosomal sialidase) Cytidine deaminase TGF-beta activated kinase 1/MAP3K7 binding protein 2 Inhibitor of DNA binding 2, dominant negative helix-loop-helix protein 213426_s_at Caveolin 2 221572_s_at Solute carrier family 26, member 6
Table 6 p-Value of genes following the alternative hypothesis for the dataset “human skeletal muscle-type II diabetes”.
p-Value
Probe id
Gene
p-Value
0.0003 0.0004 0.0005 0.0005 0.0007 0.0012 0.0017 0.0021 0.0022 0.0027 0.003 0.003 0.004 0.004 0.0043
219572_at 204447_at
0.0002 0.0002
0.0047 0.0049
201262_s_at 203171_s_at
Ca++-dependent secretion activator 2 Leucine zipper, putative tumor suppressor family member 3 Protocadherin beta 3 Transmembrane protein 106C Ribosomal protein L37a USP6 N-terminal like Peroxisomal biogenesis factor 5-like Cat eye syndrome chromosome region, candidate 5 C-terminal binding protein 2 Tankyrase, TRF1-interacting ankyrin-related ADP-ribose polymerase Ubiquitously transcribed tetratricopeptide repeat containing, Y-linked Solute carrier family 12 (potassium/chloride transporters), member 4 Biglycan Ribosomal RNA processing 8, methyltransferase, homolog (yeast) Gamma-glutamyltransferase 1 Carbonic anhydrase XIV Paraoxonase 1 Programmed cell death 10 ADP-ribosylation factor-like 3 Radixin Potassium voltage-gated channel, Shaw-related subfamily, member 2 Retinol binding protein 3, interstitial Contactin associated protein-like 2 Ferrochelatase Glutamate receptor, ionotropic, kainate 1 Gamma-glutamyl carboxylase DIP2 disco-interacting protein 2 homolog A (Drosophila)
reduction in each dataset (Table 2). The genes rejecting the null hypothesis were obtained for each of the data samples. Tables 3–6 show the corresponding p-values of all the genes which have rejected the null hypothesis at significance level of 0.05. The Figs. 2–5 represent graphically the p-value of all the genes in the four datasets under consideration. The p-value for most of the genes was above the significance level value of 0.05. This represents that these genes have almost the same expression value in the normal and diseased and may not be involved in causing the disease.
221410_x_at 201764_at 201429_s_at 204761_at 219642_s_at 218592_s_at 210835_s_at 216695_s_at 208067_x_at 209400_at
207131_x_at 219464_at 206345_s_at 210907_s_at 202641_at 204969_s_at 222289_at 210318_at 219301_s_at 203116_s_at 207242_s_at 214005_at 215529_x_at
0.0003 0.0005 0.0008 0.001 0.001 0.001 0.001 0.001 0.001 0.001 0.001 0.002 0.002 0.002 0.002 0.002 0.002 0.003 0.003 0.003 0.004 0.004 0.004 0.004 0.004
3.2. Identification of best-ranked genes from SVMRFE The subsets of genes based on the p-value were given as an input to the support vector machine. Recursive Feature Elimination (RFE) is an
Table 5 p-Value of genes following the alternative hypothesis for the dataset “human pancreatic islets from normal and type II diabetic subjects (B)”. Probe id
Gene
227787_s_at Thyroid hormone receptor-associated protein 6 222478_at Vacuolar protein sorting 36 (yeast) 230329_s_at Nudix (nucleoside diphosphate linked moiety X) -type motif 6 226424_at Calcyphosine 225491_at Solute carrier family 1 (glial high affinity glutamate transporter), member 2 225016_at Adenomatosis polyposis coli down-regulated 1 243043_at RAD50 interactor 1 224573_at Ribonuclease, RNase K 228133_s_at Myosin, heavy polypeptide 11, smooth muscle 225108_at Alkylglycerone phosphate synthase 224865_at Male sterility domain containing 2 231880_at Family with sequence similarity 40, member B 241739_at 2-oxoglutarate and iron-dependent oxygenase domain containing 1 228036_s_at F-box protein 2 223978_s_at Cardiolipin synthase 1 244706_at Protein-L-isoaspartate (D-aspartate) O-methyltransferase domain containing 1 237718_at Eukaryotic translation initiation factor 4E 222999_s_at Cyclin L2 230318_at Serpin peptidase inhibitor, clade A (alpha-1 antiproteinase, antitrypsin), member 1 222408_s_at Yippee-like 5 (Drosophila) 224954_at Serine hydroxymethyltransferase 1 (soluble)
p-Value 0.0001 0.0002 0.0003 0.0003 0.0004 0.0005 0.0008 0.0012 0.0013 0.0013 0.0024 0.0026 0.003 0.0031 0.0032 0.0033 0.0033 0.0038 0.0039 0.004 0.0046
iterative procedure for SVM classifier. The recursive feature elimination algorithm of the support vector machine assigns a weight to each gene. The weight was calculated based on the expression value of genes in the disease and the normal sample for all the dataset. The algorithm classified the genes (with a classification accuracy of 83.9%) based on the descending order of the weight. Then it generated the list of genes which were found to be the most discriminatory in the normal and disease samples (Tables 7–10). The outline for SVMRFE in the linear kernel is presented below: Inputs: Training samples X0 = [x1, x2,…, xn]T Class labels (1 for normal or 0 for diseased) y = [y1, y2,…, yn]T Initialize: Surviving genes s = [1, 2,…n] Gene-ranking list r = [] Limit training samples to good genes X = ×0 (:, s) Train the classifier α = SVM-train (X, y) Compute the weight from each selected gene: w = ∑ α k yk xk where k indicates the kth training pattern k
Compute the ranking criterion for the ith gene R (i) = (wi) [2] Mark the gene with the lowest ranking g = arg min (R) Renew the gene-ranking list r = [s (g), r]
A. Kumar et al. / Genomics Data 12 (2017) 28–37
31
Fig. 2. p-Value corresponding to all the genes in the training set for dataset “GSE7146”.
Eliminate the gene with the lowest ranking s = s (1: g − 1, g + 1: length (s)) Repeat until s = [] Output: A gene-ranking list r
3.3. Identification of degree of essentiality and non-essentiality of genes To identify significant and reliable targets, the work was concentrated on non-essential genes. Essential genes were ruled out based on the hits obtained from the Database of Essential Genes (DEG 10.9) (http:// tubic.tju.edu.cn/deg/) [46]. Essential genes sustain an organism. Therefore, having them as a potential gene target may induce side effects of the drugs. Hence, it is important to identify only the non-essential genes which may be used as a potential drug target. Tables 11–14 show the non-essential genes from the microarray dataset which is under study
3.4. Gene interaction studies After obtaining the non-essential genes from the top ranked coding genes for each of the datasets, gene regulatory network was constructed using STRING (Search Tool for the Retrieval of Interacting Genes/Proteins) database [40]. The study was mainly done to observe the interaction between non-essential protein-coding genes with other proteins which are a result of biochemical events and/or electrostatic forces [23]. The function and activity of a protein are often modulated by other proteins with which it interacts. 3.4.1. Gene regulatory network of dataset “GSE7146” In this dataset, out of the ten best coding genes obtained through the SVMRFE approach, only 5 genes (ACP1, FCGR2B, SCNN1G, CCL27, and DLG3) showed interaction with other protein coding genes (Fig. 6). The ACP1 showed a direct interaction with EPHA2, which is reported to increase the chance of myocardial infarction and reduce the survival
Fig. 3. p-Value corresponding to all the genes in the training set for dataset “human pancreatic islets from normal and type II diabetic subjects (A)”.
32
A. Kumar et al. / Genomics Data 12 (2017) 28–37
Fig. 4. p-Value corresponding to all the genes in the training set for dataset “human pancreatic islets from normal and type II diabetic subjects (B)”.
rate of hyperglycemic mice [12]. LYN showed indirect interaction with ACP1 via EPHA2 and direct interaction with FCGR2B. Its kinase activation modulation has been reported to be a novel insulin receptor-potentiating agent. This potentiating agent produces a rapid-onset and a durable blood glucose-lowering activity in diabetic animals [32]. FCGR2B also showed direct interaction with PTPN6 which is been reported to negatively regulate insulin action on glucose homeostasis in the liver and muscle [44]. An analysis of DLG3 has shown its direct interaction with GRIN2A and GRIN2B. Both these genes have been reported to play a potential role in diabetes [11,37,42]. UBC has been reported to play a major role in the diabetes pathway [8,16,26] and its direct interaction with SCNN1G shows that SCNN1G may also play a role in diabetes pathway. CCL27 interacts with CCL25, a protein whose expression was shown to decrease significantly in diabetes [30]. 3.4.2. Gene regulatory network of dataset “human pancreatic islets from normal and type II diabetic subjects (A)” Except for ABCC4 and FMO5, all the other four proteins showed a significant and strong interaction with other neighboring proteins (Fig. 7).
Purine Nucleoside Phosphorylase (PNP) and Nucleoside Phosphate Kinase (NPK) have reportedly played a major role in diabetes either by positive or negative metabolic regulation [9]. These two molecules also showed interaction with the HPRT1 and the CDA. Caveolin has already been reported to mediate insulin signaling thereby affecting the glucose uptake [6]. In the other subgroup network FUT3 has three direct neighbors: FUT1, FUT2, and B4GALT1 of which the B4GALT1 expression level has been shown to be affected by hyperglycemia [25]. 3.4.3. Gene regulatory network of the dataset “human pancreatic islets from normal and type II diabetic subjects (B)” Both the protein coding genes in this dataset (RNASEK and APCDD1) have shown a significant interaction with the neighboring proteins (Fig. 8). The involvement of RNASEK in diabetes is still an unanswered question, but APCDD1 interaction with its neighbors shows that it may be involved in the pathophysiology of diabetes. LPAR6 (Lysophosphatidic Acid Receptor 6) interacting directly with APCCD1 has shown its activity with PPARγ which is a potential target for diabetes [38]. Aranda et al., in 2012 also showed that the DM/HG (Diabetes mellitus/High Glucose)
Fig. 5. p-Value corresponding to all the genes in the training set for dataset “human skeletal muscle-type II diabetes”.
A. Kumar et al. / Genomics Data 12 (2017) 28–37 Table 7 Best ranked genes for dataset “GSE7146”.
Table 9 Best ranked genes for dataset “human pancreatic islets from normal and type II diabetic subjects (B)”.
Gene name G0/G1switch 2 Transducin-like enhancer of split 1 (E (sp1) homolog, Drosophila) Acid phosphatase 1, soluble DnaJ (Hsp40) homolog, subfamily C, member 1 Golgi-associated, gamma adaptin ear containing, ARF binding protein 2 Protein phosphatase 1, regulatory subunit 7 Interleukin 1 receptor-like 1 Discs, large homolog 5 (Drosophila) Cytochrome P450, family 4, subfamily F, polypeptide 2 Protein phosphatase 3 (formerly 2B), catalytic subunit, gamma isoform (calcineurin A gamma) Gap junction protein, beta 3, 31 kDa (connexin 31) Diaphanous homolog 2 (Drosophila) Olfactory receptor, family 7, subfamily C, member 2 Solute carrier family 22 (organic anion transporter), member 6 Serine peptidase inhibitor, Kazal Type II (acrosin-trypsin inhibitor) Chemokine (C-C motif) ligand 27 Dynein, axonemal, intermediate chain 2 Junctophilin 2 Kallikrein-related peptidase 12 S100 calcium binding protein A12 Discs, large homolog 3 (neuroendocrine-dlg, Drosophila) Sodium channel, non-voltage-gated 1, gamma subunit ST6 (alpha-N-acetyl-neuraminyl-2, 3-beta-galactosyl-1, 3) -N- acetylgalactosaminide alpha-2, 6-sialyltransferase 5 Fc fragment of IgG, low affinity IIb, receptor (CD32)
reprograms signaling pathways in RECs (Retinal Endothelial Cells) to induce a state of LPA (Lysophosphatidic Acid) resistance. In the year 2000, Figueroa et al. [14] showed that alterations in LRP5 expression may be responsible for diabetes susceptibility. Therefore it may be a potential target for therapeutic intervention. It has been reported that Wnt/ LRP5 (lipoprotein receptor-related protein 5) signaling contributes to the glucose-induced insulin secretion in the islets [15].
3.4.4. Gene regulatory network of dataset “human skeletal muscle-type II diabetes” The two prominent protein coding genes (USP6NL and ProSAPiP1) as per SVMRFE analysis showed interaction with a different set of genes (Fig. 9). This selective network of ProSAPiP1 has not been reported till now, for diabetes. The three genes (SOS1, EGFR, and EGF) in the interaction network of USP6NL have shown its significance in connection with diabetes. SOS1 has shown its association with reference to the insulin action [4], in differential expression of EGFR which is a
Table 8 Best ranked genes for dataset “human pancreatic islets from normal and type II diabetic subjects (A)”. Gene name Glucuronidase, beta Enoyl-CoA delta isomerase 1 C-terminal binding protein 1 Inhibitor of DNA binding 2, dominant negative helix-loop-helix protein Hypoxanthine phosphoribosyltransferase 1 Sialidase 1 (lysosomal sialidase) ATP-binding cassette, sub-family C (CFTR/MRP), member 4 Aminolevulinate, delta-, synthase 1 Suppressor of var1, 3-like 1 (S. cerevisiae) Flavin-containing monooxygenase 5 Solute carrier family 26, member 6 TGF-beta activated kinase 1/MAP3K7 binding protein 2 Caveolin 2 Nephrosis 1, congenital, Finnish type (nephrin) Fucosyltransferase 9 (alpha (1,3) fucosyltransferase) Cytidine deaminase Cytochrome P450, family 7, subfamily A, polypeptide 1
33
Gene name Adenomatosis polyposis coli down-regulated 1 Ribonuclease, RNase K
Table 10 Best ranked genes for dataset “human skeletal muscle-type II diabetes”. Gene name Protocadherin beta 3 Leucine zipper, putative tumor suppressor family member 3 USP6 N-terminal like Ubiquitously transcribed tetratricopeptide repeat containing, Y-linked
major impact on diabetes and associated diseases [1,5,27,28,41,45]. Kasayama et al. [19] long back in 1989 reported that EGF deficiency occurs in diabetes mellitus hence insulin may be important in maintaining the normal level of EGF in the submandibular gland and plasma. 3.5. Functional enrichment of significant genes implying pathway analysis To further validate the involvement of the identified genes in type II diabetes, pathway enrichment was considered. This was solely meant for all the interacting proteins with the identified significant protein(s). The study was carried out using Biointerpreter, a web-based biological interpretation tool for Microarray data analysis (Genotypic Technology Pvt. Ltd., Bangalore, India). The pathway analysis showed that some of the interacting proteins were involved in pathways which were directly or indirectly associated with type II diabetes. 3.5.1. Pathway enrichment for the interacting proteins of the dataset “effect of insulin infusion on human skeletal muscle” GRIN2A (Glutamate [NMDA] receptor subunit epsilon-1) and GRIN2B (Glutamate [NMDA] receptor subunit epsilon-2), the two
Table 11 Non-essential genes for dataset “GSE7146”. Gene symbol
Gene name
G0S2 ACP1 CCL27 JPH2 KLK12 S100A12 DLG3 SCNN1G ST6GALNAC5
G0/G1switch 2 Acid phosphatase 1, soluble Chemokine (C-C motif) ligand 27 Junctophilin 2 Kallikrein-related peptidase 12 S100 calcium binding protein A12 Discs, large homolog 3 (neuroendocrine-dlg, Drosophila) Sodium channel, non-voltage-gated 1, gamma subunit ST6 (alpha-N-acetyl-neuraminyl-2, 3-beta-galactosyl-1, 3) -N-acetylgalactosaminide alpha-2, 6-sialyltransferase 5 Fc fragment of IgG, low-affinity IIb, receptor (CD32)
FCGR2B
Table 12 Non-essential genes for dataset “human pancreatic islets from normal and type II diabetic subjects (A)”. Gene symbol
Gene name
HPRT1 ABCC4 FMO5 CAV2 FUT3 CDA
Hypoxanthine phosphoribosyltransferase 1 ATP-binding cassette, sub-family C (CFTR/MRP), member 4 Flavin-containing monooxygenase 5 Caveolin 2 Fucosyltransferase 9 (alpha (1, 3) fucosyltransferase) Cytidine deaminase
34
A. Kumar et al. / Genomics Data 12 (2017) 28–37
Table 13 Non-essential genes for dataset “human pancreatic islets from normal and type II diabetic subjects (B)”. Gene symbol
Gene name
APCDD1 RNASEK
Adenomatosis polyposis coli down-regulated 1 Ribonuclease, RNase K
Table 14 Non-essential genes for dataset “human skeletal muscle-type II diabetes”. Gene symbol
Gene name
USP6NL PROSAPIP1
Leucine zipper, putative tumor suppressor family member 3 USP6 N-terminal like
proteins interacting mainly with the identified protein DLG3 have been shown to be involved in 3 different pathways viz. Neuroactive ligandreceptor interaction, circadian entrainment and Long-term potentiation (Fig. 10). The proteins present in the Neuroactive ligand-receptor interaction have shown a significant role in the pathobiology of obesity and type II diabetes [10]. The second pathway, circadian entrainment is the biological process that displays an endogenous oscillation of about 24 h. Studies show that exposure to light at night lowers glucose-stimulated insulin secretion due to a decrease in insulin secretory pulse mass. Potential mechanisms have been identified by which disturbances in the circadian rhythms due to modern lifestyle can lead to islet failure in the type II diabetes [35]. It has also been reported that the impaired energy utilization from insulin deficiency impairs a longterm potentiation in diabetes [47].
Fig. 6. Gene regulatory network of dataset “GSE7146”.
Fig. 7. Gene regulatory network of dataset “human pancreatic islets from normal and type II diabetic subjects (A)”.
A. Kumar et al. / Genomics Data 12 (2017) 28–37
35
Fig. 8. Gene regulatory network of dataset “human pancreatic islets from normal and type II diabetic subjects (B)”.
3.5.2. Pathway enrichment for the interacting proteins of the dataset “human pancreatic islets from normal and type II diabetic subjects (A)” The protein B4GALT1, interacting with the identified protein FUT3 is involved in several metabolic pathways, connected to type II diabetes (Fig. 11). The protein B4GALT1 participates both in glycoconjugate and lactose biosynthesis. It has shown to be a biomarker in hepatocellular carcinoma, mainly caused due to the insulin resistance syndrome. Finally, the ailment manifests as obesity and later as diabetes [17].
3.5.3. Pathway enrichment for the interacting proteins of the dataset “human pancreatic islets from normal and type II diabetic subjects (B)” The protein PNPT1 interacting with the RNASEK is reported to be involved in pyrimidine and purine metabolism and the RNA degradation (Fig. 12). Effects of the insulin regulation of purine and pyrimidine
metabolism had shown to cause some late complications of the diabetic disease [34]. In 2009, Kocic et al. [20] reported that an impaired dsRNA metabolism may lead to increased levels of different sized RNAs in type II diabetic patients and may have an influence on further ineffective response against the different pathogens.
3.5.4. Pathway enrichment for the interacting proteins of dataset “human skeletal muscle-type II diabetes” EGFR protein interacting with the identified protein USP6NL has already been reported by many researchers to be involved in diabetes [1, 5,27,28,41,45]. With the pathway studies, it was identified that the main pathways in which EGFR is involved, is also leading directly to or indirectly to diabetes (Fig. 13). Hypoxia-inducible factor 1 alpha (HIF-1α) is regulated precisely by hypoxia and hyperglycemia. It had also been
Fig. 9. Gene regulatory network of dataset “human skeletal muscle-type II diabetes”.
36
A. Kumar et al. / Genomics Data 12 (2017) 28–37
Fig. 10. Involvement of GRIN2A and GRIN2B in different pathways.
Fig. 13. Involvement of EGFR in different pathways.
permits physiological adjustment of insulin sensitivity and the subsequent maintenance of the circulating glucose at appropriate levels [48]. MAPK and GnRh-Glp-1 pathways in the ileum have also been reported to be involved in the improvement of the blood glucose level [45]. 4. Conclusion
Fig. 11. Involvement of B4GALT1 in different pathways
shown that the HIF-1α and glucose can sometimes influence each other [43]. It has been reported that the components of the MAPK/ERK pathway act as modifiers of the cellular insulin responsiveness. The insulin resistance was due to downregulation of the insulin-like receptor gene expression following persistent MAPK/ERK inhibition. The mechanism
Analysis of type II diabetes expression data from two different tissue samples i.e. skeletal muscle and pancreatic islet has given a deep insight into genes which may be possibly involved in the pathophysiology of the disease. The most discriminatory genes obtained in each dataset after complete analysis, have been found to be associated with diabetes either directly or indirectly. However, the majority of the genes have not been previously reported in association with diabetes. The genes identified in the current study viz. FCGR2B, DLG3, SCNN1G, FUT3, HPRT1, APCDD1, USP6NL, ProSAPiP1 and RNASEK may act as a potential drug target. The significant pathways identified through the overall approach were Neuroactive ligand-receptor interaction, circadian entrainment, Long-term potentiation, pyrimidine and purine metabolism, dsRNA metabolism, MAPK/ERK pathway, and GnRh-Glp-1. This study gave the insight to focus on these associated pathways with the above-reported proteins to study in pathway models or mouse model to elucidate them as drug targets or markers for type II diabetes. Conflict of interest The authors declare that there is no conflict of interest in the present work. Appendix A. Supplementary data Supplementary data to this article can be found online at http://dx. doi.org/10.1016/j.gdata.2017.02.008. References
Fig. 12. Involvement of PNPT1 in different pathways.
[1] A. Advani, K.J. Wiggins, A.J. Cox, Y. Zhang, R.E. Gilbert, D.J. Kelly, Inhibition of the epidermal growth factor receptor preserves podocytes and attenuates albuminuria in experimental diabetic nephropathy. Nephrology 16 (6) (2011 Aug 1) 573–581. [2] J. Aranda, R. Motiejunaite, E. Im, A. Kazlauskas, Diabetes disrupts the response of retinal endothelial cells to the angiomodulator lysophosphatidic acid. Diabetes 61 (5) (2012 May 1) 1225–1233. [3] P. Baldi, A.D. Long, A Bayesian framework for the analysis of microarray expression data: regularized t-test and statistical inferences of gene changes. Bioinformatics 17 (6) (2001 Jun 1) 509–519.
A. Kumar et al. / Genomics Data 12 (2017) 28–37 [4] I. Barroso, J.A. Luan, R.P. Middelberg, A.H. Harding, P.W. Franks, R.W. Jakes, D. Clayton, A.J. Schafer, S. O'Rahilly, N.J. Wareham, Candidate gene association study in type 2 diabetes indicates a role for genes involved in β-cell function as well as insulin action. PLoS Biol. 1 (1) (2003 Oct 13), e20. [5] S. Belmadani, D.I. Palen, R.A. Gonzalez-Villalobos, H.A. Boulares, K. Matrougui, Elevated epidermal growth factor receptor phosphorylation induces resistance artery dysfunction in diabetic db/db mice. Diabetes 57 (2008) 1629–1637. [6] A.W. Cohen, T.P. Combs, P.E. Scherer, M.P. Lisanti, Role of caveolin and caveolae in insulin signaling and diabetes. Am. J. Physiol. Endocrinol. Metab. 285 (6) (2003 Dec 1) E1151–E1160. [7] F. Cordero, M. Botta, R.A. Calogero, Microarray data analysis and mining approaches. Brief. Funct. Genomic. Proteomic. 6 (4) (2007 Dec 1) 265–281. [8] S. Costes, C.J. Huang, T. Gurlo, M. Daval, A.V. Matveyenko, R.A. Rizza, A.E. Butler, P.C. Butler, β-cell dysfunctional ERAD/ubiquitin/proteasome system in type 2 diabetes mediated by islet amyloid polypeptide–induced UCH-L1 deficiency. Diabetes 60 (1) (2011 Jan 1) 227–238. [9] P.A. Craven, R.K. Studer, F.R. DeRubertis, Impaired nitric oxide-dependent cyclic guanosine monophosphate generation in glomeruli from diabetic rats. Evidence for protein kinase C-mediated suppression of the cholinergic response. J. Clin. Investig. 93 (1) (1994 Jan) 311. [10] U.N. Das, A.A. Rao, Gene expression profile in obesity and type 2 diabetes mellitus. Lipids Health Dis. 6 (1) (2007 Dec 14) 1. [11] A.M. Davalli, C. Perego, F.B. Folli, The potential role of glutamate in the current diabetes epidemic. Acta Diabetol. 49 (3) (2012 Jun 1) 167–183. [12] A. DuSablon, S. Kent, A. Coburn, J. Virag, EphA2-receptor deficiency exacerbates myocardial infarction and reduces survival in hyperglycemic mice. Cardiovasc. Diabetol. 13 (1) (2014 Aug 13) 1. [13] R. Edgar, M. Domrachev, A.E. Lash, Gene Expression Omnibus: NCBI gene expression and hybridization array data repository. Nucleic Acids Res. 30 (1) (2002 Jan 1) 207–210. [14] D.J. Figueroa, J.F. Hess, B. Ky, S.D. Brown, V. Sandig, A. Hermanowski-Vosatka, R.C. Twells, J.A. Todd, C.P. Austin, Expression of the type I diabetes-associated gene LRP5 in macrophages, vitamin A system cells, and the Islets of Langerhans suggests multiple potential roles in diabetes. J. Histochem. Cytochem. 48 (10) (2000 Oct 1) 1357–1368. [15] T. Fujino, H. Asaba, M.J. Kang, Y. Ikeda, H. Sone, S. Takada, D.H. Kim, R.X. Ioka, M. Ono, H. Tomoyori, M. Okubo, Low-density lipoprotein receptor-related protein 5 (LRP5) is essential for normal cholesterol metabolism and glucose-induced insulin secretion. Proc. Natl. Acad. Sci. 100 (1) (2003 Jan 7) 229–234. [16] C. Gao, W. Huang, K. Kanasaki, Y. Xu, The role of ubiquitination and sumoylation in diabetic nephropathy. Biomed. Res. Int. (2014 Jun 4) 2014. [17] R. Guerrero-Preston, M. Kim, A. Blanco, C. LeBron, R. Santella, M. Berdasco, M. Fraga, M. Esteller, D. Sidransky, B4GALT1 as a potential epigenetic marker of metabolic disruptions associated with Non-Alcoholic Fatty Liver Disease. Cancer Res. 68 (9 Supplement) (2008 May 1) (3827-). [18] J.E. Gunton, R.N. Kulkarni, S. Yim, T. Okada, W.J. Hawthorne, Y.H. Tseng, R.S. Roberson, C. Ricordi, P.J. O'Connell, F.J. Gonzalez, C.R. Kahn, Loss of ARNT/HIF1β mediates altered gene expression and pancreatic-islet dysfunction in human type 2 diabetes. Cell 122 (3) (2005 Aug 12) 337–349. [19] S. Kasayama, Y. Ohba, T. Oka, Epidermal growth factor deficiency associated with diabetes mellitus. Proc. Natl. Acad. Sci. 86 (19) (1989 Oct 1) 7644–7648. [20] G.M. Kocic, R. Kocic, R. Pavlovic, T. Jevtovic-Stoimenov, D. Sokolovic, G. Nikolic, V. Pavlovic, S. Stojanovic, J. Basic, A. Veljkovic, D. Pavlovic, Possible impact of impaired double-stranded RNA degradation and nitrosative stress on immuno-inflammatory cascade in type 2 diabetes. Exp. Clin. Endocrinol. Diabetes 117 (09) (2009 Oct) 480–485. [21] A. Kumar, D.J. Sharmila, R. Kant, Selection of discriminatory gene set for type II diabetes using fisher linear discriminant. Int J Adv Comput Mathe Sci. 5 (2) (2014) 36–42. [22] A. Kumar, D.J. Sharmila, Algorithmic approach for removing the redundancy in diabetic gene categories based on semantic similarity and gene expression data. Interdisciplinary Sciences: Computational Life Sciences 17 (2015 Mar) 1–7. [23] J. Li, A. Mahajan, M.D. Tsai, Ankyrin repeat: a unique motif mediating protein-protein interactions. Biochemistry 45 (51) (2006 Dec 26) 15168–15178. [24] Y. Liang, F. Zhang, J. Wang, T. Joshi, Y. Wang, D. Xu, Prediction of drought-resistant genes in Arabidopsis thaliana using SVM-RFE. PLoS One 6 (7) (2011 Jul 15), e21750. [25] K. Liu, H.Y. Liu, W. Ye, J.H. Jiang, X. Xu, The initial investigation of the expression of glycosyltransferases in the retina of streptomycin diabetic rats. [Zhonghua Yan Ke Za Zhi] Chinese Journal of Ophthalmology 46 (7) (2010 Jul) 580–584. [26] M.D. López-Avalos, V.F. Duvivier-Kali, G. Xu, S. Bonner-Weir, A. Sharma, G.C. Weir, Evidence for a role of the ubiquitin-proteasome pathway in pancreatic islets. Diabetes 55 (5) (2006 May 1) 1223–1231.
37
[27] K. Matrougui, Diabetes and microvascular pathophysiology: role of epidermal growth factor receptor tyrosine kinase. Diabetes Metab. Res. Rev. 26 (1) (2010 Jan 1) 13–16. [28] P.J. Miettinen, J. Ustinov, P. Ormio, R. Gao, J. Palgi, E. Hakonen, L. Juntti-Berggren, P.O. Berggren, T. Otonkoski, Downregulation of EGF receptor signaling in pancreatic islets causes diabetes due to impaired postnatal β-cell growth. Diabetes 55 (12) (2006 Dec 1) 3299–3308. [29] V.K. Mootha, C.M. Lindgren, K.F. Eriksson, A. Subramanian, S. Sihag, J. Lehar, P. Puigserver, E. Carlsson, M. Ridderstråle, E. Laurila, N. Houstis, PGC-1α-responsive genes involved in oxidative phosphorylation are coordinately downregulated in human diabetes. Nat. Genet. 34 (3) (2003 Jul 1) 267–273. [30] P.R. Nagib, J. Gameiro, L.G. Stivanin-Silva, M.S. de Arruda, D.M. Villa-Verde, W. Savino, L. Verinaud, Thymic microenvironmental alterations in experimentally induced diabetes. Immunobiology 215 (12) (2010 Dec 31) 971–979. [31] K.L. Ng, S.K. Mishra, De novo SVM classification of precursor microRNAs from genomic pseudo hairpins using global and intrinsic folding measures. Bioinformatics 23 (11) (2007 Jun 1) 1321–1330. [32] A.R. Ochman, C.A. Lipinski, J.A. Handler, A.G. Reaume, M.S. Saporito, The Lyn kinase activator MLR-1023 is a novel insulin receptor potentiator that elicits a rapid-onset and durable improvement in glucose homeostasis in animal models of type 2 diabetes. J. Pharmacol. Exp. Ther. 342 (1) (2012 Jul 1) 23–32. [33] H. Parikh, E. Carlsson, W.A. Chutkow, L.E. Johansson, H. Storgaard, P. Poulsen, R. Saxena, C. Ladd, P.C. Schulze, M.J. Mazzini, C.B. Jensen, TXNIP regulates peripheral glucose metabolism in humans. PLoS Med. 4 (5) (2007 May 1), e158. [34] K. Pillwein, M.A. Reardon, H.N. Jayaram, Y. Natsumeda, W.L. Elliott, M.A. Faderan, N. Prajda, W. Sperl, G. Weber, Insulin regulatory effects on purine-and pyrimidine metabolism in alloxan diabetic rat liver. Padiatr. Padol. 23 (2) (1987 Dec) 135–144. [35] J. Qian, G.D. Block, C.S. Colwell, A.V. Matveyenko, Consequences of exposure to light at night on the pancreatic islet circadian clock and function in rats. Diabetes 62 (10) (2013 Oct 1) 3469–3478. [36] S.B. Rice, G. Nenadic, B.J. Stapley, Mining protein function from text using termbased support vector machines. BMC Bioinformatics 6 (1) (2005 May 24) 1. [37] A.R. Santiago, J.M. Gaspar, F.I. Baptista, A.J. Cristóvão, P.F. Santos, W. Kamphuis, A.F. Ambrósio, Diabetes changes the levels of ionotropic glutamate receptors in the rat retina. Mol. Vis. 15 (2009) 1620–1630. [38] C.M. Stapleton, D.G. Mashek, S. Wang, C.A. Nagle, G.W. Cline, P. Thuillier, L.M. Leesnitzer, L.O. Li, J.B. Stimmel, G.I. Shulman, R.A. Coleman, Lysophosphatidic acid activates peroxisome proliferator activated receptor-γ in CHO cells that over-express glycerol 3-phosphate acyltransferase-1. PLoS One 6 (4) (2011 Apr 20), e18932. [39] S. Van Dieren, J.W. Beulens, A.P. Kengne, L.M. Peelen, G.E. Rutten, M. Woodward, Y.T. Van der Schouw, K.G. Moons, Prediction models for the risk of cardiovascular disease in patients with type 2 diabetes: a systematic review. Heart 98 (5) (2012 Mar 1) 360–369. [40] C. Von Mering, M. Huynen, D. Jaeggi, S. Schmidt, P. Bork, B. Snel, STRING: a database of predicted functional associations between proteins. Nucleic Acids Res. 31 (1) (2003 Jan 1) 258–261. [41] L. Wassef, D.J. Kelly, R.E. Gilbert, Epidermal growth factor receptor inhibition attenuates early kidney enlargement in experimental diabetes. Kidney Int. 66 (5) (2004 Nov 1) 1805–1814. [42] C. Wilson, Diabetes: pathogenesis of diabetes mellitus: does glutamate have a role? Nat. Rev. Endocrinol. 7 (5) (2011 May 1) 248. [43] H. Xiao, Z. Gu, G. Wang, T. Zhao, The possible mechanisms underlying the impairment of HIF-1α pathway signaling in hyperglycemia and the beneficial effects of certain therapies. Int. J. Med. Sci. 10 (10) (2013 Jan 1) 1412–1421. [44] E. Xu, A. Charbonneau, Y. Rolland, K. Bellmann, L. Pao, K.A. Siminovitch, B.G. Neel, N. Beauchemin, A. Marette, Hepatocyte-specific Ptpn6 deletion protects from obesitylinked hepatic insulin resistance. Diabetes 61 (8) (2012 Aug 1) 1949–1958. [45] M.Z. Zhang, Y. Wang, P. Paueksakon, R.C. Harris, Epidermal growth factor receptor inhibition slows progression of diabetic nephropathy in association with a decrease in endoplasmic reticulum stress and an increase in autophagy. Diabetes 63 (6) (2014 Jun 1) 2063–2072. [46] R. Zhang, H.Y. Ou, C.T. Zhang, DEG: a database of essential genes. Nucleic Acids Res. 32 (Suppl. 1) (2004 Jan 1) D271–D272. [47] Y. Izumi, K.A. Yamada, M. Matsukawa, C.F. Zorumski, Effects of insulin on long-term potentiation in hippocampal slices from diabetic rats. Diabetologia 46 (7) (2003) 1007–1012. [48] W. Zhang, B.J. Thompson, V. Hietakangas, S.M. Cohen, MAPK/ERK signaling regulates insulin sensitivity to control glucose metabolism in Drosophila. PLoS Genetics 7 (12) (2011), e1002429.