MARINE ECOLOGY PROGRESS SERIES Mar Ecol Prog Ser
Vol. 459: 293–302, 2012 doi: 10.3354/meps09829
Contribution to the Theme Section ‘Comparative analysis of marine fisheries production’
Published July 12
OPEN ACCESS
Synthesizing lessons learned from comparing fisheries production in 13 northern hemisphere ecosystems: emergent fundamental features Jason S. Link1,*, Sarah Gaichas2, Thomas J. Miller3, Tim Essington4, Alida Bundy5, Jennifer Boldt6, Ken F. Drinkwater7, Erlend Moksness8 1
National Atmospheric and Oceanic Administration, National Marine Fisheries Service, Northeast Fisheries Science Center, Woods Hole, Massachusetts 02543, USA 2 National Atmospheric and Oceanic Administration, National Marine Fisheries Service, Alaska Fisheries Science Center, Seattle, Washington 98115, USA 3 Chesapeake Biological Laboratory, University of Maryland Center for Environmental Science, Solomons, Maryland 20688, USA 4 School of Fisheries and Aquatic Sciences, University of Washington, Seattle, Washington 98195, USA 5 Department of Fisheries and Oceans, Bedford Institute of Oceanography, Halifax, Nova Scotia B2Y 4A2, Canada 6 Department of Fisheries and Oceans, Pacific Biological Station, Nanaimo, British Columbia V9T 6N7, Canada 7 Institute of Marine Research and Bjerknes Centre for Climate Research, Bergen 5817, Norway 8 Institute of Marine Research, Flødevigen Marine Research Station, His 4817, Norway
ABSTRACT: Understanding the drivers of the productivity of marine ecosystems continues to be a globally important issue. A vast body of literature identifies 3 main processes that regulate the production dynamics of fisheries: biophysical, exploitative, and trophodynamic. Here, we synthesize results from international workshops in which surplus production models were applied to 13 northern hemisphere ecosystems that support notable fisheries. The results are compared across systems, levels of species aggregation, and drivers. By applying surplus production models at single-species (SS), multi-species (MS), aggregated group, and full-system levels across ecosystems, we find that the different levels of aggregation provide distinct, but complementary, information. Further, it is clear that the triad of drivers contributes to fisheries productivity in each ecosystem, but the key drivers are system-specific. Our results also confirm that full-system yield is less than the sum of SS yields and that some MS and aggregate yields may lead to overharvest of some stocks if species groups are constructed without considering common productivity, inter-species, and environmental interactions. Several fundamental features emerge from this Theme Section including sigmoidal biomass accumulation curves across trophic levels, improvement of model fits by inclusion of environmental or ecological covariates, the inequality of system maximum sustainable yield (MSY) versus aggregated sums and SS sums of MSY, a 1 to 5 t km−2 fishery yield rule of thumb, and the finding that tradeoffs among ocean use objectives may not be as harsh as originally thought. These emergent features have the potential to alter our understanding of marine ecosystem dynamics and improve how we manage fisheries production. KEY WORDS: Ecosystem comparison · Surplus production · Multispecies models · Aggregate biomass estimates · Environmental covariates · Fisheries management · Hierarchical analysis Resale or republication not permitted without written consent of the publisher
INTRODUCTION Ecosystem-based fisheries management (EBFM) has become a dominant paradigm of fisheries science and management, with calls and justifications for *Email:
[email protected]
EBFM (Link 2002a,b, Garcia et al. 2003, Pikitch et al. 2004) being increasingly replaced by evaluations of and practical suggestions for its implementation (Link 2010, Ellis et al. 2011, Essington & Punt 2011, Hilborn 2011, Rice 2011). It is now clearly recognized that the © Inter-Research and Fisheries and Oceans Canada 2012 · www.int-res.com
Mar Ecol Prog Ser 459: 293–302, 2012
294
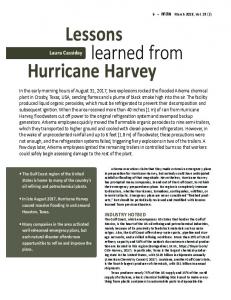
sound management of fisheries requires a consideration of broader factors that influence marine ecosystems. As such, an improved understanding of the drivers of ecosystem dynamics that can influence fisheries resources is required. Although there are multiple drivers that can influence ecosystem dynamics, we focus here on 3 main processes that affect marine fish productivity: biophysical (environmental), exploitative (fisheries), and trophodynamic (species interactions) factors (Link et al. 2010a). We refer to these as the production ‘triad’ of drivers because they represent dominant themes of research to understand variation in productivity within and across ecosystems (Fig. 1). Although each is clearly important individually, rarely has the impact of these multiple drivers been assessed simultaneously. The work synthesized here results from several workshops (Link et al. 2010a, Gaichas et al. 2012a, this Theme Section [TS]), all of which used the triad as a central, operating hypothesis questioning how ecosystem dynamics influence fisheries production. Fisheries production is an important marine ‘ecosystem service’ worldwide, with economies and social fabrics constructed around that production (Holmlund & Hammer 1999, Allison et al. 2009, Barange et al. 2010, Garcia & Rosenberg 2010, Coulthard et al. 2011, Longhurst 2010). Estimating the productivity of fish populations is an important step in the sound management of fisheries targeting those species. Integrating information on key covariates of production and how production scales across different levels of biological information are therefore key steps toward implementing EBFM. Several studies have
Exploitation
Fisheries production
Trophodynamics
Biophysical
Fig. 1. The triad of drivers that can affect fisheries production
already explored those features that can influence fisheries production individually (e.g. Beaugrand et al. 2003, Platt et al. 2003, Koen-Alonso & Yodzis 2005, Lehodey et al. 2006, Chassot et al. 2007, Mueter et al. 2009, Steele et al. 2011). We suggest that extending these approaches to compare the impact of multiple factors simultaneously is one way to improve our understanding of such production. An essential element of comparative ecosystem analysis is the development of a common analytic platform that produces a standardized measure to enable adequate comparisons across ecosystems. The need for such a standardized method precludes the application of complex, detailed models tailored to the specifics of any particular ecosystem and instead favors simpler, abstract representations of key ecological processes. In ecology, simple densitydependent population models have commonly proved to be useful in this type of application; in fisheries ecology, these approaches are easily adapted to also account for removals from fisheries, using models commonly called surplus production models (SPMs). These models relate the production of a population to the current population size, intrinsic rates of productivity, and density-dependent effects. Although there has been debate about the applications of such modeling approaches, particularly regarding assumptions or perceptions of equilibrium and lack of agestructured dynamics (Mohn 1980, Ludwig & Walters 1985, 1989, Punt 2003), there is consensus that they play a useful and important role in ecology in general (Mangel et al. 2006) and fisheries science in particular (Ludwig & Walters 1985, 1989, National Research Council 1998). Other benefits of SPMs are noted by Gaichas et al. (2012a). Importantly for this application, the data inputs to conduct SPM are relatively simple and often readily available across ecosystems. Moreover, SPMs are often used to derive common biological reference points (BRPs); classic examples include maximum sustainable yield (MSY) and the biomass or fishing rates at MSY (BMSY and FMSY respectively), which are used to assess the status of exploited stocks. Thus, the reference points generated by these models provide familiar outputs that serve as a consistent platform for comparison of fisheries production across ecosystems and at different levels of ecosystem aggregation (e.g. species, aggregated foraging guild or habitat group, or full system). Marine ecosystems are complex and respond to external drivers at multiple temporal, spatial, and organizational scales. This inherent complexity precludes an experimental approach at appropriate spatio-temporal scales; thus, to explore the questions addressed
Link et al.: Synthesis of fisheries production comparative studies
here, a comparative approach is required (Murawski et al. 2010). Placing ecosystem responses into a broader context enables the elucidation of both common, generic patterns and processes that are unique to particular ecosystems. Our objectives here are to highlight the fundamental features of marine ecosystems that emerged from the comparative analyses presented in this TS. Here, we synthesize that body of work, highlighted as major themes in the sections below, to emphasize major findings that are apt to be valuable and informative for EBFM and may indeed be fundamental features of marine ecosystems.
PATTERNS IN EMPIRICAL INFORMATION In compiling the database of catch, biomass, and environmental time series for this comparative work (for data descriptions, see Bundy et al. 2012, Fu et al. 2012, Pranovi et al. 2012, Gaichas et al. 2012a, all in this TS) (Table 1 lists the main species considered), several key empirical relationships were identified across the ecosystems (Fig. 2) prior to the application of production models. Fu et al. (2012) compared the relative importance and effect of fisheries, trophodynamic, and biophysical drivers on a range of metrics across ecosystems. The results indicate that each component of the triad of drivers was important for all of the studied ecosystems, as found in other studies (e.g. Coll et al. 2010, Link et al. 2010a,b); however, the relative importance of each driver and the indicators they most affected varied among ecosystems, suggesting that an examination of a suite of indicators and drivers is required. Temporal variability in derived metrics of fish biomass and fisheries catches across ecosystems indicated distinct differences between the Pacific and Atlantic Ocean basins for many but not all ecosystem indicators (Fu et al. 2012). Some similarity among these and related ecosystems within an ocean basin has been shown before, with coherency in basic biological responses readily and repeatedly observed (e.g. Link et al. 2009, Megrey et al. 2009, Nye et al. 2010). A fundamental feature derived from these data is the sigmoidal relationship of cumulative biomass curves across trophic levels (Pranovi et al. 2012). It appears from the generality of the patterns observed that biomass tends to accumulate, either proportionally or in absolute magnitude, at middle trophic levels; this is apt to be a common feature in most marine ecosystems. As biomass accumulates across trophic levels, the sigmoidal shape appears to be robust across ecosystems, time, and many very distinct
295
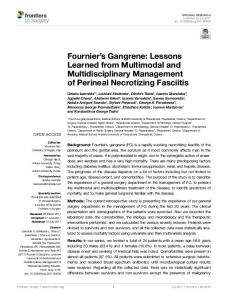
types of taxa. This common feature could potentially be used as a system-level BRP. For instance, as perturbations occur in a given ecosystem, the inflection point and steepness parameters reflect such changes by flattening out the curve (Fig. 3) (Pranovi et al. 2012), indicative of a potential system-level threshold similar to that presented in other attempts to define ecosystem overfishing (e.g. Gascuel et al. 2005, Link 2005, Tudela et al. 2005, Coll et al. 2008, Libralato et al. 2008). The value of modelling sigmoidal biomass accumulation curves is that it is a simple derivation of readily extant data, not requiring involved multi-species, food web, or ecosystem models. As such, this might be an important fundamental feature that could be useful for fisheries management, especially EBFM.
PROMINENCE AMONG DRIVERS No single driver emerged as consistently dominant across all ecosystems, based on both direct empirical descriptions (Fu et al. 2012, Pranovi et al. 2012) and statistical modeling (Bundy et al. 2012, Holsman et al. 2012, this TS). Measures of exploitation and broadscale climate indices were some of the more consistently prominent drivers that emerged across all ecosystems, but no single factor was the most dominant across all ecosystems. However, while not the dominant signal, temperature affected production in nearly all systems based on both empirical and fullsystem SPM approaches (Bundy et al. 2012, Fu et al. 2012). These observations are consistent with similar empirical studies of some of these and other ecosystems (Coll et al. 2010, Link et al. 2010b). Including environmental covariates in the SPM similarly exhibited no obvious pattern indicating the major driver influencing fisheries production (Bundy et al. 2012, Holsman et al. 2012). The prominence among environmental, trophic, and fishing metrics all varied across the ecosystems, levels of aggregation, and type of model fitting. However, inclusion of such covariates almost always lowered estimates of key BRPs, especially MSY (e.g. Bundy et al. 2012, Holsman et al. 2012). Simulation studies (Gaichas et al. 2012b, Gamble & Link 2012, both in this TS) also exhibited lower MSY and associated BRP estimates, albeit with higher variances about them, when environmental or ecological factors were included. Furthermore, simulations showed that climate change can have larger effects than species interactions, which can have larger effects than fisheries removals (Gaichas et al. 2012b, Gamble & Link 2012).
Mar Ecol Prog Ser 459: 293–302, 2012
296
Table 1. Species list for each ecosystem used in the sum of the single-species (SS) maximum sustainable yield (MSY) analysis shown in Fig. 4 (cf. Bundy et al. 2012, their Table A1 and Pranovi et al. 2012, their Table 2 for more details). EBS: Eastern Bering Sea; GOA: Gulf of Alaska; HS: Hecate Strait; NL: Newfoundland; SGOSL: southern Gulf of St. Lawrence; E/WSS: eastern/western Scotian Shelf; GOM: Gulf of Maine; GB: Georges Bank; North: North Sea; BS: Barents Sea; Norw.: Norwegian Sea. NS: species not specified EBS Pacific Ocean Alaska plaice Arrowtooth flounder Curlfin sole Dover sole Dusky rockfish English sole Flathead sole King crab Lingcod Northern rock sole Northern rockfish Pacific cod Pacific halibut Pacific herring Pacific ocean perch Pacific salmon Pacific sanddab Petrale sole Quillback rockfish Rex sole Rougheye rockfish Sablefish Sand sole Silvergray rockfish Slender sole Southern rock sole Spotted ratfish Tanner crab Walleye pollock Yellowfin sole Yellowtail rockfish
Both oceans Butter sole Skates (NS) Snow crab Spiny dogfish
X X
GOA
X X X
HS
X X X X X
X X
X X X X X
X
X X X
X X X X X X
X X X
X X
X X X X X X X X X X X X X X X
X X X X
NL Atlantic/Arctic Ocean Aesop shrimp Alewife American lobster American plaice Atlantic argentine Atlantic butterfish Atlantic cod Atlantic hagfish Atlantic halibut Atlantic herring Atlantic mackerel Atlantic redfishes (NS) Atlantic wolffish Beaked redfish Blue hake Blue whiting Capelin Common sole Cusk Eelpouts (NS) European plaice Fourspot flounder Golden redfish Goosefish Greenland cod Greenland halibut Haddock Jonah crab Lesser sandeel Longfin squid Longhorn sculpin Lumpfish Northern prawn Norway pout Ocean pout Pandalid shrimps (NS) Pollock Rainbow smelt Red hake Rock crab Roughhead grenadier Roundnose grenadier Saithe Scup Sea scallop Sea raven Shad Shortfin squid Silver hake Smooth dogfish Spotted wolffish Squids (NS) Summer flounder Toad crabs (NS) White hake Whiting Windowpane Winter flounder Witch flounder Wolffishes (NS) Yellowtail flounder Both oceans Butter sole Skates (NS) Snow crab Spiny dogfish
SGOSL ESS WSS GOM GB
North BS
Norw.
X X
X X X
X X X X
X
X
X X
X X
X X X
X X X
X X
X
X X
X
X
X
X X
X X X
X X X X X
X X X X X
X
X
X
X
X X
X X
X
X
X X X
X
X X X X X X
X X X
X
X
X
X
X X X
X
X
X
X
X
X
X
X
X
X
X
X
X
X
X X
X X X
X X
X X
X X X
X
X X
X X
X X
X X X X X
X
X X
X X
X X X
X
X
X
X
X X X
X X X
X
X
X
X
X
X
X
X
X
X
X
X
X
X
X X
X
X X X
X
X
X
X
X X X X X
X
X X
X
X X X
Link et al.: Synthesis of fisheries production comparative studies
297
Cumulative biomass
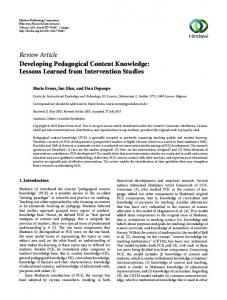
Fig. 2. Locations of the ecosystems included in the present comparative analyses
1985
1986
1987
1988
1989
1990
1991
1992
1993
1994
1995
1996
1997
1998
1999
2000
2001
2002
2003
2004
2005
2006
2007
2008
2009
Trophic level Fig. 3. Example of changes to the biomass accumulation curves across trophic levels over time for the Gulf of St. Lawrence ecosystem (adapted from Pranovi et al. 2012). Vertical dotted (green) line: trophic level intercept, or inflection point; horizontal dotted (orange) line: biomass intercept or starting biomass level; diagonal dotted (red) line: tangent of the curve through the inflection point
298
Mar Ecol Prog Ser 459: 293–302, 2012
One fundamental feature that did emerge from this work is that, despite the lack of a consistent dominant driver across all ecosystems, the addition of biophysical or ecological covariates often improved the fit of SPMs (Bundy et al. 2012, Holsman et al. 2012). This implies that multiple factors, in addition to fishing, can influence fisheries production, and those factors should no longer be omitted from exploration, modeling, and provision of fisheries management advice, consistent with calls for EBFM. Moreover, although the inclusion of the covariates improved model fits, they also altered estimated reference points. This suggests not only that environmental variability can be an important source of observation error affecting survey data, but also that failure to include biophysical and trophodynamic covariates can be an important source of process error in assessments. Clearly, further work is warranted to determine if there are major, dominant, consistent drivers as a fundamental feature of all marine ecosystems (Longhurst 2010). It may very well be that all facets of the triad can be important under any given situation, that they have different time scales, that they all have the potential to be dominant at any given time, and that all are occurring at various levels of magnitude within an ecosystem (Hunt & McKinnell 2006). However, determining what conditions make one set of drivers more prominent than others, and why, remains to be more fully elucidated. For now, the present work clearly indicates that including covariates in investigations of fishery production is important, but that the covariates must be tailored to individual systems. Temperature data in particular are widely available and have improved fits in many situations across systems; thus, perhaps future investigations could include a thermally related and relevant covariate as a matter of course.
AGGREGATION OF FISHERIES PRODUCTION This TS is some of the first work to systematically examine production at intermediate levels of aggregation between single species (SS) and full systems using a comparative approach. Using both simulation and SPM fitting approaches, the relative productivity of aggregated groups becomes apparent. For example, aggregate pelagic habitat groups nearly always had higher MSYs than the aggregate demersal groups (Gaichas et al. 2012b, Lucey et al. 2012, this TS). Similarly and not surprisingly, planktivores were nearly always the most productive feeding aggregate. However, the size-based groups performed
counter-intuitively, with aggregates of small species showing generally higher productivity than large species, but with medium species less productive than larger sizes. Similarly, simulation results based on parameters for Georges Bank showed large species as the most productive. Overall, habitat-based groups had the most consistent production patterns in the SPM fitting study (Lucey et al. 2012), while taxonomic aggregates appeared to perform well to balance dual management objectives of maximal yield and minimal depletion (Gaichas et al. 2012b; see next section). Aggregate groups at intermediate levels of organization may also provide effective ecosystem indicators. Changes in aggregate biomass for particular groups (gadoids or clupeids) were more indicative of ecosystem or fishery change than total system biomass in empirical studies (Fu et al. 2012). This information on the productivity of aggregate groups may be useful in setting BRPs in areas or for groups where information is limited; the patterns in relative productivity reported here could generally inform such data-poor situations.
IMPLICATIONS FOR ECOSYSTEM-BASED FISHERIES MANAGEMENT An emergent fundamental feature from simulation modeling is that enforcing tradeoffs across ecosystem-use objectives may not be as bad as was once thought. Management strategy evaluation simulations demonstrate that the loss in yield required to maintain conservation objectives is usually small, on the order of EcosystemMSY to support fisheries production in these 14 mid- to higher latitude systems generally falls within a similarly limited Total System 12 range and, although variable, has not Sum Dem-Pel fundamentally changed (orders of) Sum Guild 10 magnitude over time. We do not know Sum SS whether this observation will hold for 8 other types of marine ecosystems; this finding clearly merits further examina6 tion. Additionally, the spatial extent of the ecosystems examined here was 4 generally quite large; whether these patterns would be retained in smaller 2 ecosystems similarly merits examination, particularly to ensure that major 0 production features or locales are not Barents Eastern Eastern Georges Gulf of Gulf of Hecate Norwegian Western Alaska Maine Sea Scotian Sea Bering Scotian Bank Strait omitted. Given these caveats, if this Shelf Shelf Sea pattern holds, it represents a signifiFig. 4. Contrasts of maximum sustainable yield (MSY) estimates for the studcant basis for developing limits to fishied systems, summed functional guild aggregation, summed habitat aggregaery removals from ecosystems, even if tion (Dem: demersal; Pel: pelagic), and summed single species (SS) for several only for the northern ecosystems innorthern hemisphere ecosystems
Mar Ecol Prog Ser 459: 293–302, 2012
300
We recognize that from an energetics perspective this is not surprising, as the more aggregated levels already account for species and technical interactions (Brown et al. 1976, May et al. 1979, Tyrrell et al. 2011). However, we assert that further empirical demonstration of the robustness of this pattern should reinforce to both managers and stakeholders that ecosystem-based approaches to management will inevitably involve addressing trade-offs (Link 2010). Moreover, this fundamental feature also represents a way to further augment and refine systemlevel BRPs for a specific ecosystem beyond the 1 to 5 t yr−1 km−2 rule of thumb noted above. Applying this approach would require consideration of the species mixes involved, such that managers are cognizant of the level of fishing those species and the system had already experienced, and of the need for any particular tradeoffs or compensation among species and aggregate groups. This would need to be done to ensure functional redundancies as well as affording specific stocks or aggregate groups adequate protection, particularly if the stocks were fished at low levels of abundance or productivity or otherwise warranted special consideration (Gaichas et al. 2012b). This inequality is one of the most consistent emergent features synthesized from these studies, as estimating total system-level yields is now demonstrated to be quite feasible, consistent with calls for EBFM. Continuing to estimate SS yields still has its place, but doing so without recognizing the system-level limitations and aggregated properties of a fished community is no longer defensible. A final key finding from comparing the results of production models to other models in the Gulf of Maine is that production models can give similar results as more complex age-structured models (Fogarty et al. 2012, this TS). This suggests that applying the SPM approach to data-poor species or entire ecosystems with limited sampling resources can give reasonable advice for ecosystem-based fishery management.
SUMMARY We reiterate the value of comparative studies (Murawski et al. 2010), as few marine ecosystems at these scales are amenable to experimental work, and even ecosystem modeling has its limitations, especially regarding the copious data required to validate a wide set of scenarios. We also note the value of simpler, integrative approaches, such as SPM. Keeping comparison platforms to approaches that are rela-
tively simple and feasible and that leverage extant data are critical for conducting ecosystem comparisons. Here, the features that emerged from the contrasts and comparisons across the studied ecosystems shed insight into some common patterns and processes of marine ecosystems but would likely have not emerged from examination of those systems in isolation, via process-oriented studies or similar methods. We note that all parts of the triad of drivers (environment, fisheries, and trophodynamics) (Fig. 1) can be important. Clearly, all have the potential to be important, and all operate to some degree in each system. Which drivers dominate under which conditions is still undetermined. Further work to elucidate a set of ‘assembly rules’ under which specific drivers are most prominent is warranted. Several fundamental features emerge from this TS and related works. We particularly note the sigmoidal biomass accumulation curves across trophic levels, the improvement of model fits by inclusion of environmental or ecological covariates, the inequality of system MSY versus aggregated sums and SS sums of MSY, the 1 to 5 t yr−1 km−2 yield rule of thumb, and that tradeoffs among fishery-sector and protected-resources objectives may not be as harsh as was originally thought. Certainly, there may be other features that will emerge from future comparative ecosystem studies, and the ones noted here merit continued examination. Yet, we assert that these emergent features have the potential to alter our understanding of marine ecosystem dynamics and improve how we manage fisheries production therein. As practitioners continue to implement EBFM (Pitcher et al. 2009, Link 2010, Essington & Punt 2011), a robust data set of the features and properties of ecosystems and how they influence fisheries production shall be increasingly important. We trust that what we have synthesized here represents one step toward that goal. Acknowledgements. This collaborative, multilateral work was funded through the US Comparative Analysis of Marine Ecosystem Organization (CAMEO), the Norwegian Research Council (NRC), and Canada’s Ecosystem Research Initiative (ERI). Major national institutes (Fisheries and Oceans Canada, Institute of Marine Research, and National Marine Fisheries Service) also contributed significant inkind and directed resources to this project. This work was also endorsed by the Ecosystem Studies of Sub-Arctic Seas program. The present work resulted from several joint meetings, particularly the Surplus Production Modeling Workshop (SPMW 1 & 2) and associated intersessional efforts, representing an extension of other joint workshops, including Canadian and US Ecosystems (CANUSE I & II), Marine
Link et al.: Synthesis of fisheries production comparative studies
Ecosystems of Norway and the US (MENU I & II), and Norwegian-Canadian Collaborations (NORCAN). We also thank the anonymous reviewers who provided some excellent advice, resulting in an improved manuscript. Finally, we dedicate this work to the memory of Bern Megrey, who was an integral part of these efforts and whose untimely death was unfortunate but whose enthusiasm for this work was invaluable.
➤ Gaichas S, Gamble R, Fogarty M, Benoît H and others
➤
➤ LITERATURE CITED
➤ Allison EH, Perry AL, Badjeck MC, Adger WN and others
➤
➤
➤ ➤ ➤ ➤ ➤
➤ ➤
➤ ➤ ➤
➤
(2009) Vulnerability of national economies to the impacts of climate change on fisheries. Fish Fish 10:173−196 Barange M, Field JG, Harris RP, Hofmann EE, Perry RI, Werner F (eds) (2010) Marine ecosystems and global change. Oxford University Press, New York, NY Beaugrand G, Brander KM, Lindley JA, Souissi S, Reid PC (2003) Plankton effect on cod recruitment in the North Sea. Nature 426:661−664 Brown B, Breenan J, Grosslein M, Heyerdahl E, Hennemuth R (1976) The effect of fishing on the marine finfish biomass in the northwest Atlantic from the Gulf of Maine to Cape Hatteras. ICNAF Res Bull 12:49−68 Bundy A, Bohaboy EC, Hjermann DO, Mueter FJ, Fu C, Link JS (2012) Common patterns, common drivers: comparative analysis of aggregate surplus production across ecosystems. Mar Ecol Prog Ser 459:203–218 Chassot E, Mélin F, Le Pape O, Gascuel D (2007) Bottom-up control regulates fisheries production at the scale of ecoregions in European seas. Mar Ecol Prog Ser 343:45−55 Chassot E, Bonhommeau S, Dulvy NK, Melin F, Watson R, Gascuel D, Le Pape O (2010) Global marine primary production constrains fisheries catches. Ecol Lett 13:495−505 Coll M, Libralato S, Tudela S, Palomera I, Pranovi F (2008) Ecosystem overfishing in the ocean. PLoS ONE 3:e3881 Coll M, Shannon LJ, Yemane D, Link JS and others (2010) Ranking the ecological relative status of exploited marine ecosystems. ICES J Mar Sci 67:769−786 Coulthard S, Johnson D, McGregor JA (2011) Poverty, sustainability and human wellbeing: a social wellbeing approach to the global fisheries crisis. Global Environ Change 21:453−463 Edwards SF, Link JS, Rountree BP (2004) Portfolio management of wild fish stocks. Ecol Econ 49:317−329 Ellis SL, Incze LS, Lawton P, Ojaveer H and others (2011) Four regional marine biodiversity studies: approaches and contributions to ecosystem-based management. PLoS ONE 6:e18997 Essington TE, Punt AE (2011) Implementing ecosystembased fisheries management: advances, challenges and emerging tools. Fish Fish 12:123−124 Fogarty MJ, Overholtz WJ, Link JS (2012) Aggregate surplus production models for demersal fishery resources of the Gulf of Maine. Mar Ecol Prog Ser 459:247–258 Fu C, Gaichas S, Link JS, Bundy A and others (2012) Relative importance of fisheries, trophodynamic and environmental drivers in a series of marine ecosystems. Mar Ecol Prog Ser 459:169–184 Fukuda Y (1976) A note on yield allocation in multi-species fisheries. ICNAF Res Bull 12:83−87 Gaichas S, Bundy A, Miller TJ, Moksness E, Stergiou K (2012a) What drives marine fisheries production? Mar Ecol Prog Ser 459:159–163
301
➤
➤ ➤ ➤
➤ ➤
➤ ➤
➤
➤
➤
➤
➤
(2012b) Assembly rules for aggregate-species production models: simulations in support of management strategy evaluation. Mar Ecol Prog Ser 459:275–292 Gamble RJ, Link JS (2012) Using an aggregate production simulation model with ecological interactions to explore effects of fishing and climate on a fish community. Mar Ecol Prog Ser 459:259–274 Garcia SM, Rosenberg AA (2010) Food security and marine capture fisheries: characteristics, trends, drivers and future perspectives. Philos Trans R Soc Lond B Biol Sci 365:2869−2880 Garcia SM, Zerbi A, Aliaume C, Do Chi T, Lasserre G (2003) The ecosystem approach to fisheries: issues, terminology, principles, institutional foundations, implementation and outlook. UN Food and Agriculture Organization, Rome Gascuel D, Bozec Y, Chassot E, Colomb A, Laurans M (2005) The trophic spectrum: theory and application as an ecosystem indicator. ICES J Mar Sci 62:443−452 Hilborn R (2011) Future directions in ecosystem based fisheries management: a personal perspective. Fish Res 108: 235−239 Holmlund CM, Hammer M (1999) Ecosystem services generated by fish populations. Ecol Econ 29:253−268 Holsman KK, Essington TE, Miller TJ, Koen-Alonso M, Stockhausen WJ (2012) Comparative analysis of cod and herring production dynamics across 13 northern hemisphere marine ecosystems. Mar Ecol Prog Ser 459:231–246 Hunt GL, McKinnell S (2006) Interplay between top-down, bottom-up, and wasp-waist control in marine ecosystems. Prog Oceanogr 68:115−124 Koen-Alonso M, Yodzis P (2005) Multispecies modelling of some components of the marine community of northern and central Patagonia, Argentina. Can J Fish Aquat Sci 62:1490−1512 Lehodey P, Alheit J, Barange M, Baumgartner T and others (2006) Climate variability, fish, and fisheries. J Clim 19: 5009−5030 Libralato S, Coll M, Tudela S, Palomera I, Pranovi F (2008) Quantifying ecosystem overfishing: theoretical development and application of a new index of fisheries’ impact on marine trophic webs. Mar Ecol Prog Ser 355:107−129 Link JS (2002a) Ecological considerations in fisheries management: When does it matter? Fisheries (Bethesda) 27: 10−17 Link JS (2002b) What does ecosystem-based fisheries management mean? Fisheries (Bethesda) 27:18−21 Link JS (2005) Translating ecosystem indicators into decision criteria. ICES J Mar Sci 62:569−576 Link JS (2010) Ecosystem-based fisheries management: confronting tradeoffs. Cambridge University Press, Cambridge Link JS, Stockhausen WT, Skaret G, Overholtz WJ and others (2009) A comparison of biological trends of four marine ecosystems: synchronies, differences and commonalities. Prog Oceanogr 81:29−46 Link JS, Megrey BA, Miller TJ, Essington TE and others (2010a) Comparative analysis of marine ecosystems: international production modeling workshop. Biol Lett 6: 723−726 Link JS, Yemane D, Shannon LJ, Coll M and others (2010b) Relating marine ecosystem indicators to fishing and environmental drivers: an elucidation of contrasting responses. ICES J Mar Sci 67:787−795
302
➤
➤ ➤ ➤
➤ ➤
➤ ➤
➤
➤
➤ ➤
Mar Ecol Prog Ser 459: 293–302, 2012
Longhurst AR (2010) Mismanagement of marine fisheries. Cambridge University Press, Cambridge Lucey SM, Cook AM, Boldt JL, Link JS, Essington TE, Miller TJ (2012) Comparative analyses of surplus production dynamics of functional feeding groups across 12 northern hemisphere marine ecosystems. Mar Ecol Prog Ser 459:219–229 Ludwig D, Walters CI (1985) Are age-structured models appropriate for catch-effort data? Can J Fish Aquat Sci 42:1066−1072 Ludwig D, Walters CJ (1989) A robust method for parameter-estimation from catch and effort data. Can J Fish Aquat Sci 46:137−144 Mangel M, Levin P, Patil A (2006) Using life history and persistence criteria to prioritize habitats for management and conservation. Ecol Appl 16:797−806 May AW (1975) Report of standing committee on research and statistics. ICNAF Seventh Spec Comm Meet, September 1975. ICNAF, Dartmouth, NS May RM, Beddington JR, Clark CW, Holt SJ, Laws RM (1979) Management of multispecies fisheries. Science 205:267−277 Megrey BA, Hare JA, Stockhausen WT, Dommasnes A and others (2009) A cross-ecosystem comparison of spatial and temporal patterns of covariation in recruitment of functionally analogous fish stocks. Prog Oceanogr 81: 63−92 Mohn RK (1980) Bias and error propagation in logistic production models. Can J Fish Aquat Sci 37:1276−1283 Mueter FJ, Broms C, Drinkwater KF, Friedland KD and others (2009) Ecosystem responses to recent oceanographic variability in high-latitude northern hemisphere ecosystems. Prog Oceanogr 81:93−110 Murawski SA, Steele JH, Taylor P, Fogarty MJ, Sissenwine MP, Ford M, Suchman C (2010) Why compare marine ecosystems? ICES J Mar Sci 67:1−9 National Research Council (1998) Improving fish stock assessment. National Academy Press, Washington, DC Nye JA, Bundy A, Shackell N, Friedland KD, Link JS (2010) Coherent trends in contiguous survey time-series of major ecological and commercial fish species in the gulf of maine ecosystem. ICES J Mar Sci 67:26−40 Pauly D, Christensen V (1995) Primary production required to sustain global fisheries. Nature 374:255−257 Pikitch EK, Santora C, Babcock EA, Bakun A and others Submitted: October 25, 2011; Accepted: May 21, 2012
➤
➤
➤ ➤ ➤ ➤ ➤ ➤
➤ ➤
➤ ➤
(2004) Ecosystem-based fishery management. Science 305:346−347 Pitcher TJ, Kalikoski D, Short K, Varkey D, Pramoda G (2009) An evaluation of progress in implementing ecosystem-based management of fisheries in 33 countries. Mar Policy 33:223−232 Platt T, Fuentes-Yaco T, Frank KT (2003) Spring algal bloom and larval fish survival. Nature 423:398−399 Pope JG (1975) The application of mixed fisheries theory to the cod and redfish stocks of subarea 2 and division 3K. Research Document 75/IX/126, International Commission for the Northwest Atlantic Fisheries, Dartmouth, NS Pope J (1979) Stock assessment in multistock fisheries, with special reference to the trawl fishery in the Gulf of Thailand. SCS/DEV/79/19, UN Food and Agriculture Organization, Rome Pranovi F, Link J, Fu C, Cook AM and others (2012) Trophiclevel determinants of biomass accumulation in marine ecosystems. Mar Ecol Prog Ser 459:185–201 Punt AE (2003) Extending production models to include process error in the population dynamics. Can J Fish Aquat Sci 60:1217−1228 Rice J (2011) Managing fisheries well: delivering the promises of an ecosystem approach. Fish Fish 12:209−231 Ryther JH (1969) Photosynthesis and fish production in the sea. Science 166:72−76 Steele JH, Gifford DJ, Collie JS (2011) Comparing species and ecosystem-based estimates of fisheries yields. Fish Res 111:139−144 Tudela S, Coll M, Palomera I (2005) Developing an operational reference framework for fisheries management based on a two-dimensional index of ecosystem impact. ICES J Mar Sci 62:585−591 Tyrrell MC, Link JS, Moustahfid H (2011) The importance of including predation in fish population models: implications for biological reference points. Fish Res 108:1−8 Walters CJ, Christensen V, Martell SJ, Kitchell JF (2005) Possible ecosystem impacts of applying MSY policies from single-species assessment. ICES J Mar Sci 62: 558−568 Ware DM, Thomson RE (2005) Bottom-up ecosystem trophic dynamics determine fish production in the northeast pacific. Science 308:1280−1284 Worm B, Hilborn R, Baum JK, Branch TA and others (2009) Rebuilding global fisheries. Science 325:578−585 Proofs received from author(s): July 2, 2012