Accurate dynamic modeling and control of this class of UAV is an enabling technology and crucial for ... modeling, analysis of handling qualities, flight controller.
System Identification and Controller Optimization of a Quadrotor UAV Wei Wei Kelly Cohen Department of Aerospace Engineering & Engineering Mechanics, University of Cincinnati Cincinnati, OH, USA
Mark B. Tischler Aviation Development Directorate – AFDD US Army Research, Development and Engineering Command (AMRDEC) Moffett Field, CA, USA ABSTRACT
Multi-rotor aircraft, such as the quadrotor, are increasingly popular for small-scaled VTOL UAVs. In order to develop an effective control system through simulation techniques, obtaining an accurate dynamic model of a given quadrotor is crucial. Moreover, given the anticipated stringent safety requirements, fault tolerance will be a crucial component of UAV certification. Accurate dynamic modeling and control of this class of UAV is an enabling technology and crucial for future commercial applications. In this paper, the extraction of the bare-airframe dynamic model of a quadrotor UAV in hover condition using frequency-domain system identification techniques and its simulation is presented. The model is verified in the time-domain using dissimilar flight test data not used in the identification. The dynamic model and onboard PID controller are simulated and verified in Simulink®. Then, the controller is optimized to achieve significantly improved performance in both simulation analysis and flight tests. This paper presents details of the quadrotor system design, model extraction techniques, dynamic model verifications, controller optimization and flight test results. dramatically increased as witnessed by publications and mushrooming research and educational programs. Recently, multi-rotor aircraft have been chosen as a viable configuration for small-scaled VTOL UAVs. Compared to the single main rotor configuration such as the conventional helicopter, multi-rotor airframes require a simpler feedback control system and fewer mechanical parts. These characteristics make these UAV platforms, such as quadrotors, a rugged and competitive candidate for many applications in both military and civil areas. Due to its configuration and relative size, the small quadrotor UAV system is inherently very unstable. In order to develop an effective control system through simulation techniques, obtaining an accurate dynamic model of a given quadrotor is crucial.
NOTATION 𝑎𝑎𝑥𝑥 = acceleration component along the longitudinal axis 𝑎𝑎𝑦𝑦 = acceleration component along the lateral axis 𝑎𝑎𝑧𝑧 = acceleration component along the vertical axis 𝑝𝑝 = vehicle roll rate 𝑞𝑞 = vehicle pitch rate 𝑟𝑟 = vehicle yaw rate 𝛿𝛿𝑎𝑎𝑎𝑎𝑎𝑎 = roll control input 𝛿𝛿𝑑𝑑𝑑𝑑𝑑𝑑 = pilot directional input 𝛿𝛿𝑒𝑒𝑒𝑒𝑒𝑒 = pitch control input 𝛿𝛿𝑙𝑙𝑙𝑙𝑙𝑙 = pilot lateral input 𝛿𝛿𝑙𝑙𝑙𝑙𝑙𝑙 = pilot longitudinal input 𝛿𝛿𝑟𝑟𝑟𝑟𝑟𝑟 = yaw control input 𝛿𝛿𝑡𝑡ℎ𝑟𝑟 = vertical control input 𝛿𝛿𝑣𝑣𝑣𝑣𝑣𝑣 = pilot vertical input 𝜃𝜃 = pitch Euler angle 𝜏𝜏 = time delay 𝜓𝜓 = yaw Euler angle 𝜙𝜙 = roll Euler angle
In the aerospace industry, there is a major focus on highfidelity aircraft and rotorcraft simulation. Utilizing accurate simulations greatly reduce cost in regards to both pilot training and control system development. Having access to accurate dynamic models of aircraft or rotorcraft configurations allows flight control engineers to efficiently develop control systems for their particular configuration. In order to utilize this capability, however, it is crucial to obtain and develop an accurate dynamic model of the system being analyzed. Though there are many methods available to model a given system, frequency-domain system identification techniques (Ref. 1) have been proven to produce accurate models of various rotorcrafts, such as in Ref. 2. In these methods the Comprehensive Identification from Frequency Responses (CIFER®) software package was utilized (Ref. 1), analyzing the input and output data gathered during flight tests to develop a
INTRODUCTION
With the promise of extensive commercial applications, the popularity of Unmanned Aerial Vehicles (UAVs) has Presented at the AHS 71st Annual Forum, Virginia Beach, Virginia, May 5–7, 2015. Copyright © 2015 by the American Helicopter Society International, Inc. All rights reserved. Distribution statement A: Approved for public release. 1
dynamic model of the given systems.
Attached at the end of each motor arm is one A2217 950KV motor powered by a 30-amp electric speed controller (ESC). These four motors directly drive APC 12 x 3.8 propellers, which control the quadrotor.
The scope of this research involves experimental system hardware and software development, flight instrumentation, flight testing, dynamics modeling, system identification, dynamic model validation, control system modeling, analysis of handling qualities, flight controller optimization and validation. In earlier work, the closedloop system was identified and the controller response was analyzed in Ref. 3. It was desired to apply the method of system identification using CIFER® to develop a bareairframe dynamic model of this configuration in hover flight condition. The extracted model was then validated and simulated along with the controller in Simulink®. The PID controller is also optimized in the CONDUIT® environment and flight testing was conducted to verify the improved dynamic response.
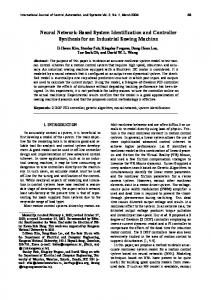
Figure 1. AeroQuad Cyclone quadrotor in flight. The hardware layout of quadrotor system is outlined in Figure 2. The sensors onboard the AeroQuad include an ITG-3200 gyroscope, ADXL345 accelerometer, HMC5883L magnetometer, BMP085 barometer, and MaxSonars EZ0 ultrasonic sensor. This sensor suite provides adequate data-collection capability and records the necessary parameters required for system identification at a rate of 40 Hz. Additionally, flight data from these sensors are recorded in real time on the ground station.
SYSTEM OVERVIEW In this effort, an AeroQuad Cyclone quadrotor frame (Figure 1) was chosen as the test platform. The AeroQuad frame is constructed with aluminum plates in the center, which houses most of the electrical components. Four hollow aluminum square tubes make up the motor arms, each having dimensions of 5/8 in. * 5/8 in. * 13 in.
Quadrotor MOTOR1
ESC1
MOTOR2
ESC2
GPIO
GPIO
CPU MOTOR3
ESC3
MOTOR4
ESC4
GPIO
GPIO
RS-232
XBEE
GPIO
IMU
A/D
ULTRASONIC
IIC
BAROMETER
GPIO
RECEIVER
900 MHz
2.4 GHz
Figure 2. System layout of quadrotor control.
Figure 3. Schematic diagram of the quadrotor control system. 2
The onboard controller consists of an ATmega2560 Arduino™-based platform. The Arduino platform was suitable for our project, as it is one that is open-source. This feature made the data collection process simple over that of closed software implementations. The Arduino board works hand-in-hand with an onboard PID controller, which used the sensors described above to help stabilize the quadrotor in flight. A Futaba® T12MZ 2.4 GHz radio transmitter coupled with a R6008HS receiver was used to control the quadrotor during all phases of flight testing. The R6008HS receiver was connected to the onboard PID controller, whose gains were set for good controllability during the project’s initial phase. After the PID gains were set, they were not altered throughout the entire system identification process, so that no discrepancies would be present in the identified model.
transmission, a pair of Digi® XBee-PRO 900MHz modules was utilized: one onboard the quadrotor and the other on a ground station computer. The XBee protocol allows accurate and fast data transmission over a large range, ideal for our setup.
BARE-AIRFRAME MODEL IDENTIFICATION AND VERIFICATION System identification is a process that can obtain the dynamic model in a fraction of the time when compared to traditional methods. Rather than estimating and fine-tuning a dynamic model before and during flight testing, system identification utilizes the flight testing data to develop the dynamic model. In this process, the system’s input and output time histories are measured during flight and are used to develop the dynamic model. Additionally, the system identification process is both timesaving and produces a more accurate model when compared to simulation methods. Moreover, system identification begins with the actual measured aircraft data and builds the model from the data itself. In addition, a major convenience of using system identification is that the structural and inertial characteristics of the system do not need to be precisely estimated. By measuring the inputs and outputs of the aircraft configuration, the state-space representation of the aircraft system can be computed, which inherently includes all of the inertial characteristics of the system.
A great amount of vibration on the quadrotor existed due to the rotating propellers. To suppress vibration noise and not compromise onboard sensor performance, each of the four motor mounts and the electronic bay were all isolated from the main frame using rubber vibration insulators. The schematic diagram of the quadrotor control system is presented in Figure 3. The control system combines the piloted control (𝛿𝛿𝑙𝑙𝑙𝑙𝑙𝑙 , 𝛿𝛿𝑙𝑙𝑙𝑙𝑙𝑙 , 𝛿𝛿𝑑𝑑𝑑𝑑𝑑𝑑 , and 𝛿𝛿𝑣𝑣𝑣𝑣𝑣𝑣 ) with the aircraft measurements to provide commands to the 4 axes: roll (𝛿𝛿𝑎𝑎𝑎𝑎𝑎𝑎 ), pitch (𝛿𝛿𝑒𝑒𝑒𝑒𝑒𝑒 ), yaw (𝛿𝛿𝑟𝑟𝑟𝑟𝑟𝑟 ), and heave (𝛿𝛿𝑡𝑡ℎ𝑟𝑟 ). The control command for each individual motor is acquired by taking summation of the 4 axes and distributing the total command to the 4 motors based on their positions in the configuration. The motor response transfers to the quadrotor maneuver and the on-board instrument captures the movements.
In this effort, the Comprehensive Identification from FrEquency Response (CIFER®) program was utilized to extract the bare-airframe dynamic model of the quadrotor in hover condition. Since its development in the early 1990’s, US Army Aviation Development Directorate – AFDD has successfully utilized CIFER® to extract dynamic models of many commercial and military aircraft and rotorcraft configurations, such as the XV-15, Bell214ST, BO-105, AH-64, UH-60, V-22, AV-8 Harrier, and OH-58D. In addition, there have also been studies carried out where the dynamic models of scaled down miniature aircraft and single-rotor model helicopter configurations have been successfully extracted using CIFER®.
With the instrumentation onboard, the pilot inputs (𝛿𝛿𝑙𝑙𝑙𝑙𝑙𝑙 , 𝛿𝛿𝑙𝑙𝑙𝑙𝑙𝑙 , 𝛿𝛿𝑑𝑑𝑑𝑑𝑑𝑑 , 𝛿𝛿𝑣𝑣𝑣𝑣𝑣𝑣 ), motor commands (𝛿𝛿𝑎𝑎𝑎𝑎𝑎𝑎 , 𝛿𝛿𝑒𝑒𝑒𝑒𝑒𝑒 , 𝛿𝛿𝑟𝑟𝑟𝑟𝑟𝑟 , 𝛿𝛿𝑡𝑡ℎ𝑟𝑟 ), Euler angles (ϕ, θ, 𝜓𝜓 ), angular rates (p, q, r), linear accelerations ( 𝑎𝑎𝑥𝑥 , 𝑎𝑎𝑦𝑦 , 𝑎𝑎𝑧𝑧 ), altitude, battery level, and elapsed time were directly measured during flight testing. These parameters were satisfactory to extract bare-airframe models using system identification and for validating the flight controller models. For wireless flight data
Figure 4. Lateral axis frequency sweep example. 3
Following the choice of using CIFER®, a flight testing procedure was devised based on given frequency-domain system identification guidelines. Frequency-domain analyses minimize errors associated with bias effects and processing noise when compared to time-domain analyses. In addition, the bare-airframe dynamics of the rotorcraft are unstable (very unstable for the small-sized quadrotor), and so the time-domain integration of the equations of motion will diverge. These problems are avoided when using frequency-domain system identification methods. As a result, the dynamic model of the quadrotor was extracted herein using the frequency-domain system identification process. Individual axes of the quadrotor were excited using frequency sweep maneuvers. Frequency-responses of different channels are used for the identification of each axis.
indicating excellent signal-to-noise and a very linear system (Ref. 1). The solid line represents flight data and dashed line is the model. It can be seen that the frequency response of the extracted model fits the flight data very well, which indicates that an accurate model is obtained. The time delay of 91 ms and 75 ms, respectively in roll and pitch (Table 1), reflect the total effective lag associated with the measurement and motor dynamics. The low Cramer-Rao bounds and insensitivity numbers indicated in Table 1 show that the pitch and roll parameters are identified with high confidence (Ref. 1).The eigenvalues of the bare-airframe angular responses are shown in Table 2. These constitute the unstable hovering cubics for the lateral and longitudinal angular dynamics that are common to all hovering vehicles. These unstable responses are also seen in the phase rise of all of the of frequency responses at the modal natural frequency of about 2.5 rad/sec. In the case of the small quadrotor, the associated average time-to-double 0.693 ≅ 0.55 𝑠𝑠𝑠𝑠𝑠𝑠 amplitude in pitch and roll 𝜏𝜏𝑑𝑑𝑑𝑑𝑑𝑑𝑑𝑑𝑑𝑑𝑑𝑑𝑑𝑑 =
Figure 4 shows part of the lateral axis input and output data gathered during flight test. The maneuver starts with about five seconds in trim condition, followed by two long period sweeps (about 15 s). Then the sweep frequency is increased gradually until to about three Hz. Five more seconds of trim condition is maintained in the end.
−𝜁𝜁𝜁𝜁
renders the bare-airframe essentially un-flyable without a feedback control system. There is also a high degree of symmetry between the pitch and roll derivatives and associated eigenvalues, as expected for this symmetrical configuration of the quadrotor.
The lateral and longitudinal dynamics of the quadrotor can be taken from the linearized state-space representation and written in the following form 𝑣𝑣̇ 𝑌𝑌𝑣𝑣 � 𝑝𝑝̇ � = �𝐿𝐿𝑣𝑣 𝜙𝜙̇ 0
𝑢𝑢̇ 𝑋𝑋𝑢𝑢 �𝑞𝑞̇ � = �𝑀𝑀𝑢𝑢 0 𝜃𝜃̇
0 0 1
0 0 1
𝑌𝑌𝛿𝛿𝑎𝑎𝑎𝑎𝑎𝑎 32.17 𝑣𝑣 0 � � 𝑝𝑝 � + �𝐿𝐿𝛿𝛿𝑎𝑎𝑎𝑎𝑎𝑎 � 𝛿𝛿𝑎𝑎𝑎𝑎𝑎𝑎 (𝑡𝑡 − 𝜏𝜏𝛿𝛿𝛿𝛿𝛿𝛿𝛿𝛿 ) 𝜙𝜙 0 0
Table 1. Identified Parameters for Lateral and Longitudinal Bare-airframe Model. (1)
𝑌𝑌𝑣𝑣 𝐿𝐿𝑣𝑣 𝑌𝑌𝛿𝛿𝑎𝑎𝑎𝑎𝑎𝑎 𝐿𝐿𝛿𝛿𝑎𝑎𝑎𝑎𝑎𝑎 𝑋𝑋𝑢𝑢 𝑀𝑀𝑢𝑢 𝑋𝑋𝛿𝛿𝑒𝑒𝑒𝑒𝑒𝑒 𝑀𝑀𝛿𝛿𝑒𝑒𝑒𝑒𝑒𝑒 𝜏𝜏𝛿𝛿𝛿𝛿𝛿𝛿𝛿𝛿 𝜏𝜏𝛿𝛿𝛿𝛿𝛿𝛿𝛿𝛿
𝑋𝑋𝛿𝛿𝑒𝑒𝑒𝑒𝑒𝑒 −32.17 𝑢𝑢 0 � �𝑞𝑞 � + �𝑀𝑀𝛿𝛿𝑒𝑒𝑒𝑒𝑒𝑒 � 𝛿𝛿𝑒𝑒𝑒𝑒𝑒𝑒 (𝑡𝑡 − 𝜏𝜏𝛿𝛿𝛿𝛿𝛿𝛿𝛿𝛿 ) (2) 𝜃𝜃 0 0
Value -0.0429 -0.4376 -0.2016 0.7066 -0.0429 0.5241 0.2269 0.6662 0.09077 0.07460
CR% 53.75 5.969 18.34 4.64 53.75 6.02 13.21 4.751 5.487 6.713
Insens. % 6.009 1.797 2.52 1.38 6.009 1.819 2.341 1.421 2.722 3.328
Table 2. Lateral and Longitudinal Model Eigenvalues. λ# 1-2 3 4-5 6
Eigenvalue Location 1.1931±2.0911i(ζ=-0.4956; ω=2.4075) -2.4291 1.2679±2.2206i(ζ=-0.4958; ω=2.5571) -2.5786
The bare-airframe directional model is a simple damped first order system shown below. 𝑟𝑟̇ 𝑁𝑁 � ̇ � = � 𝑟𝑟 𝜓𝜓 1
Figure 5. Lateral frequency response (p/%ail) in CIFER®.
𝑁𝑁 0 𝑟𝑟 � � � + � 𝛿𝛿𝑟𝑟𝑟𝑟𝑟𝑟 � 𝛿𝛿𝑟𝑟𝑟𝑟𝑟𝑟 (𝑡𝑡 − 𝜏𝜏𝛿𝛿𝑟𝑟𝑟𝑟𝑟𝑟 ) 0 𝜓𝜓 0
(3)
The directional axis parameters are shown in Table 3.
Figure 5 displays the frequency response of the lateral axis bare-airframe dynamics. Notice the very high coherence 4
vehicle are zero ( 𝐿𝐿𝑝𝑝 , 𝑀𝑀𝑞𝑞 , and 𝑍𝑍𝑤𝑤 ≈ 0) , due to the negligible effect of these derivatives for the quadrotor. The identification costs are summarized in Table 5. They are all within or near the cost guidelines for identification (𝐽𝐽𝑎𝑎𝑎𝑎𝑎𝑎 ≤ 100) indicating that the model identification accuracy is adequate. Improved model accuracy would require a higher-fidelity instrumentation system and/or increased model complexity, which is not deemed warranted.
Table 3. Identified Parameters for Directional Bareairframe Model. Value -0.5231 0.1306 0.02295
𝑁𝑁𝑟𝑟 𝑁𝑁𝛿𝛿𝑟𝑟𝑟𝑟𝑟𝑟 𝜏𝜏𝛿𝛿𝑟𝑟𝑟𝑟𝑟𝑟
CR% 14.42 3.954 14.86
Insens. % 6.750 1.864 7.372
The heave model is also a simple damped first order system.
Table 5. Cost Summary. 𝑤𝑤̇ = 𝑍𝑍𝛿𝛿𝑡𝑡ℎ𝑟𝑟 𝛿𝛿𝑡𝑡ℎ𝑟𝑟 (𝑡𝑡 − 𝜏𝜏𝛿𝛿𝑡𝑡ℎ𝑟𝑟 )
(4) Identification Verification
The heave axis parameters are shown in Table 4. The first order dynamics for yaw and heave complete the state-space representation of the quadrotor (6DOF) dynamics.
𝜏𝜏𝛿𝛿𝑡𝑡ℎ𝑟𝑟
Value 0.7414
CR% 3.961
Insens. % 1.980
0.2884
3.393
1.697
The resulting states-space model is presented below in eqn. 5. Note that the heave and angular rate damping of the 𝑢𝑢̇ ⎡ 𝑣𝑣̇ ⎤ ⎡−0.0429 0 ⎢ ⎥ ⎢ 0 ⎢𝑤𝑤̇ ⎥ ⎢ ⎢ 𝑝𝑝̇ ⎥ ⎢ 0 ⎢ 𝑞𝑞̇ ⎥ = ⎢ 0.5241 ⎢ 𝑟𝑟̇ ⎥ 0 ⎢ 𝜙𝜙̇ ⎥ ⎢ 0 ⎢ ⎥ ⎢ 0 ⎢ 𝜃𝜃̇ ⎥ ⎢ 0 ⎣𝜓𝜓̇ ⎦ ⎣
0 −0.0429 0 −0.4376 0 0 0 0 0
0 0 0 0 0 0 0 0 0
0 0 0 0 0 0 1 0 0
0 0 0 0 0 0 0 1 0
0 0 0 0 0 −0.5231 0 0 1
0 𝑔𝑔 0 0 0 0 0 0 0
−𝑔𝑔 0 0 0 0 0 0 0 0
Lon 120.8 0.378
Dir 15.8 1.165
Ver 54.41 0.157
Because frequency-domain system identification was used, verification of the extracted model was performed in timedomain. Time history not used in the system identification process was used for verification. In Figure 6, the recorded 𝑎𝑎𝑦𝑦 , 𝑝𝑝, 𝜙𝜙, and 𝑣𝑣, from the quadrotor (solid line) is compared to the output of the extracted lateral state-space model (dashed line). It is seen that the outputs in each channel are in good agreement, which validates the lateral dynamics model. The same verification process was carried out for all axes and models were all verified. All scaled verification costs were below 2, which is the guideline listed in Ref. 1.
Table 4. Identified Parameters for Bare-airframe Heave Model. 𝑍𝑍𝛿𝛿𝑡𝑡ℎ𝑟𝑟
Lat 120.8 0.437
0 𝑢𝑢 0 0⎤ ⎡ 𝑣𝑣 ⎤ ⎡ 0 ⎥⎢ ⎥ ⎢ −0.7414 0⎥ 𝑤𝑤 ⎢ ⎥ ⎢ 0 0⎥ ⎢ 𝑝𝑝 ⎥ ⎢ 0 0⎥ ⎢ 𝑞𝑞 ⎥ + ⎢ 0 0⎥ ⎢ 𝑟𝑟 ⎥ ⎢ 0 0⎥ ⎢𝜙𝜙 ⎥ ⎢ 0 0⎥ ⎢ 𝜃𝜃 ⎥ ⎢ 0 0⎦ ⎣𝜓𝜓⎦ ⎣
Figure 6. Lateral axis model verification. 5
0 −0.2016 0 0.7066 0 0 0 0 0
0.2269 0 0 0 0.6662 0 0 0 0
0 0 ⎤ 0 ⎥ 𝛿𝛿 ⎥ 𝑡𝑡ℎ𝑟𝑟 0 ⎥ 𝛿𝛿 𝑎𝑎𝑎𝑎𝑎𝑎 � 0 ⎥� 𝛿𝛿𝑒𝑒𝑒𝑒𝑒𝑒 0.1306⎥ 𝛿𝛿 0 ⎥ 𝑟𝑟𝑟𝑟𝑟𝑟 0 ⎥ 0 ⎦
(5)
Figure 7. Quadrotor dual PID controller. process establishes the anchor point for control system optimization and stability analysis. This process is detailed in the primary author’s PhD dissertation (Ref. 6).
CONTROLLER OPTIMIZATION The dynamic model of the quadrotor derived from system identification using CIFER® sets an excellent foundation for the quadrotor controller development. In Ref. 4, the model was used to develop a fuzzy logic controller that outmatches the nominal PID performance. Therefore, it was desired to have the nominal PID controller optimized so that more favorable handling qualities could be achieved. Before the optimization, the nominal controller need to be accurately modeled in Simulink® as well to create an “anchor point”, proving that the physical system as a whole, including the controller and the airframe, can be accurately represented in the simulation environment. The quadrotor control system applies a dual PID control system, illustrated in Figure 7. Take the lateral axis for example, the attitude PID controller takes the difference of required attitude (𝛿𝛿𝑙𝑙𝑙𝑙𝑙𝑙 ) and current roll angle (𝜙𝜙) as input, and output a roll rate command (att_out). The rate PID’s proportional and integral block takes the difference of rate command and current roll rate (𝑝𝑝), and generates the roll axis command. The derivative block of the rate PID controller takes 𝑝𝑝 instead, so that the spike due to changes of roll rate command, also known as “derivative spike”, can be avoided.
Figure 8. Frequency-domain verification of lateral model.
The nominal gain values (also referred herein as “legacy” values) give acceptable (but not optimal) handling qualities for flight testing. All flight data for the system identification was collected using this nominal controller configuration. The controller was modeled in Simulink®, and the controller model output was compared to flight data. Figure 8 shows the broken-loop and the closed-loop frequency response of the model compared to those of the whole quadrotor system (controller and bare-airframe). The results indicate that the legacy controller is very accurately modeled. Verification was also carried out in time-domain and validity of the model was proven. This
For the controller optimization the software package CONtrol Designer's Unified InTerface (CONDUIT®) was utilized. CONDUIT® is another tool developed by US Army AFDD for flight control system design, analysis, and optimization. This software has been successfully utilized in many applications like the AH-64D (Ref. 7) UH-60A (Ref. 8), RASCAL helicopter (Ref. 9). There are many challenges associated with modern multiobjective flight control design for rotorcraft systems. With many coupled states and tunable parameters in the control 6
diagrams, tuning one of the parameters always affects many specifications, which makes the fine tuning of design parameters frustrating and time consuming. What further complicates this process is that many design specifications (user requirements) always competes with one another. Therefore, a comprehensive understanding of trade-offs of the design parameters and specifications is required. The process could be so computationally intensive that manual tuning for an optimization solution is always frustrating or sometimes even impractical. In CONDUIT®, the specifications are defined first and the program determines the design parameter values that achieve the pre-defined specifications with minimal over design.
require improvement” (Level 3). The goal of the flight control design is to achieve Level 1 in all design specifications with minimal control usage. The design specifications selected in CONDUIT® libraries are for full-scale rotorcrafts, and the specification criteria in the specifications are not suitable for small-size (2 kg) rotorcrafts as in this case. To resolve this, the lateral axis handling quality criteria are set based on a baseline evaluation of the quadrotor system with legacy controller setup. The initial design has very limited stability margins and damping ratio. Another specification in Level 3 is the OLOP (Open-Loop Onset Point, Ref. 15) specification, which indicates potential of actuator saturation, and might lead to PIO (Pilot Induced Oscillation). Based on the nominal controller performance, the Level 1/ Level2 stability margin boundary was set to 3dB gain margin and 15 degrees phase margin, and the Level 1/Level2 damping ratio boundary set to ζ =0.2.
In CONDUIT®, built-in libraries are provided to users to choose depending on the applications from fixed-wing (Ref. 10) to rotorcraft (Ref. 11). The libraries cover all aspects for flight control system evaluation, including stability criteria, handling qualities for piloted inputs, disturbance rejection, and control usage. A numerical score is assigned to indicate how the system complies with each of the specifications, and a plot displays this correlation. Other features of CONDUIT® include (Ref. 12): customizable specifications, quick access to detailed information, integration with CIFER® database and utilization of optional batch mode.
Table 6. Design Specifications.
Name EigLcG1 NicMgG1 StbMgG1 BnwRoH1 BnwYaH1 DstBwG1 DstPkG1 EigDpG1 CrsMnG2
In CONDUIT®, the parameters to be tuned in the control block diagrams are referred to as “Design Parameters”. In a PID controller, the design parameters are the P, I, and D gains. The system identification results show similar dynamics between the lateral and longitudinal axis, which is expected for a quadrotor configuration. Therefore, for the attitude stabilize controller, we focused on the lateral axis, and will use the same controller configuration for the longitudinal axis. As discussed earlier, the controller has a dual PID configuration. Because the att_D has the same effect as rt_P, and rt_I as att_P, so both 𝐾𝐾𝑎𝑎𝑎𝑎𝑎𝑎_𝐷𝐷 and 𝐾𝐾𝑟𝑟𝑟𝑟_𝐼𝐼 are set to 0. Attitude integral gain of the lateral axis 𝐾𝐾𝑎𝑎𝑎𝑎𝑎𝑎_𝐼𝐼 is constrained to the attitude proportional gain 𝐾𝐾𝑎𝑎𝑎𝑎𝑎𝑎_𝑃𝑃 so that 𝐾𝐾𝑎𝑎𝑎𝑎𝑎𝑎_𝐼𝐼 /𝐾𝐾𝑎𝑎𝑎𝑎𝑎𝑎_𝑃𝑃 is equal to 1/10 of the crossover frequency. This constraint ensures that the integral effect is big enough to correct steady state error quickly, but not too big to degrade phase margin (Ref. 13). So in this design, there are three design parameters: 𝐾𝐾𝑎𝑎𝑎𝑎𝑎𝑎_𝑃𝑃 , 𝐾𝐾𝑟𝑟𝑟𝑟_𝑃𝑃 , and 𝐾𝐾𝑟𝑟𝑟𝑟_𝐷𝐷 .
OlpOpG1 CrsLnG1 RmsAcG1
Description Eigenvalues Nichols Margin Stability Margin Roll Bandwidth Yaw Bandwidth Disturbance Rejection Bandwidth Disturbance Rejection Peak Generic Damping Ratio Min. Crossover Freq Open Loop Operating Point Rate Limit Saturation Crossover Freq Actuator RMS
Type H H H S S S S S S S J J
There are three phases in the optimization process. Because stability related constraints (hard constraints) takes priority over all other constraints, in Phase 1, the design parameters are optimized to achieve all hard constraints. Then in Phase 2, all handling-qualities constraints (soft constraints) are satisfied, while the hard constraints compliance is maintained. At this point, the design meets all stability and handling qualities requirements, but might not be an optimal design in terms of the use of the actuator authority (control usage). Therefore, in Phase 3, the summed objectives constraints (crossover frequency and actuator RMS constraints) are satisfied, while all of the hard and software constraints are maintained.
Specifications selected for the quadrotor flight control design is shown in Table 6. They are divided into three categories: “Hard constraints (H)”, “Soft constraints (S)”, and “Summed objectives (J)”. Hard constraints are specifications that relates to system stability and stability margins, soft constraints are specifications that relate to handling qualities. The summed objectives constraints prevent over design, and minimize the cost of feedback. The specifications in CONDUIT® applies the CooperHarper scale (Ref. 14) to rate the compliance, “satisfactory without improvement” (Level 1), “deficiencies that warrant improvement” (Level 2), and “deficiencies that
The final optimized CONDUIT® solution is the one meets all the design requirements with the most economical use of the actuators – this is the “Pareto optimum” solution. In CONDUIT®, there is a Design Margin Optimization (DMO) function that allows user to push the Level 1 / Level 2 boundary forward to a certain level into the Level 1 region in a batch mode. This guarantees better system robustness or performance. In this design, DMO were applied to 7
Disturbance Rejection Bandwidth (DstBwG1) and Minimal Crossover Frequency (CrsMnG2) specifications. The DMO level was increased until optimal solution could not be reached.
legacy lateral controller has very low stability margins. Both the Nichols margin and stability margins are in the red zone (Level 3). The gain margin is only 1.93 dB, phase margin is 11.93 degrees, and damping ratio is 0.18, all below the guidelines. In addition, the OLOP specification indicates risk of PIO. It took CONDUIT® 22 iterations to find a Pareto optimum solution. A comparison of the initial and optimized design parameters and performance is shown in Table 7. It can be seen that 𝐾𝐾𝑟𝑟𝑟𝑟_𝑃𝑃 value was reduced from 100 to 64.95. This provides more stability margins and more damping, with the price of slightly reduced bandwidth.
Overall stability was ensured by using eigen-location specifications which force all closed-loop system poles to be at least neutrally stable. In conjunction, eigen-dampings specifications were used to ensure that all closed-loop short-term response poles had a damping ratio of at least 0.2. Additionally, satisfactory margins were guaranteed in all axes by using stability margin specifications, which look at the broken-loop responses of the system.
Figure 9 displays handling quality window of the final design in CONDUIT®. It is seen that all design parameters falls in the blue zone which indicates Level 1.
Table 7. Lateral Controller Design Summary. Design Parameter 𝐾𝐾𝑎𝑎𝑎𝑎𝑡𝑡_𝑃𝑃 𝐾𝐾𝑟𝑟𝑡𝑡_𝐷𝐷
𝐾𝐾𝑟𝑟𝑟𝑟_𝑃𝑃 Gain Margin (dB) Phase Margin (deg) Bandwidth (rad/s) Damping Ratio DRB (rad/s)
Initial Design 3.5
Optimized Design 3.53
3 100 1.93 11.93 10.97 0.18 2.72
3 64.95 5.80 24.41 7.69 0.45 2.76
Change Figure 10 depicts the comparison between the closed-loop frequency response of the quadrotor system with legacy controller and the final controller design. It can be seen that the optimized design has a reduced magnitude peak and more gradual phase roll off on the high frequency side, which is associated with the increased closed-loop damping. Step response change of lateral axis is shown in Figure 11. It is seen that the new design has much less oscillation compared to legacy controller setup, and has a smoother response. The response time is slightly longer, but it is a small price to pay, considering that it settles in about 1.2 second.
0.86% 0% -35.05% 200.52% 104.61% -29.9% 150% 1.47%
The legacy lateral controller was firstly used to evaluate the initial design handling quality. It was learned that the
Figure 9. CONDUIT® handling quality window for lateral axis final design. 8
Figure 10. Lateral axis closed-loop frequency response of initial and final design. Figure 12. Lateral axis design evaluation. Directional axis controller was also validated using the same method, and results shown in Figure 13. The flight data again has excellent agreement with optimized design simulation, which indicates both the airframe and controller were accurately modeled. Also can be seen from the figure is that the optimized design output has a quicker response speed and tracks the directional input 𝛿𝛿𝑑𝑑𝑑𝑑𝑑𝑑 very well. This will greatly improve the handling quality for the UAV operation.
Figure 11. Lateral axis step response of initial and final design. The directional axis controller optimization results are detailed in Ref. 6. The legacy directional axis controller handling quality analysis showed that the bandwidth had room for improvement. All stability criteria had adequate margins. So the main focus was on the bandwidth, which to the pilot operating the quadrotor means response speed.
Flight Testing Validation Flight testing was conducted with the quadrotor after optimized design parameters uploaded to flight controller. Flight data was recorded, and input data was used to excite the closed loop model with legacy controller for comparison.
Figure 13. Directional axis design evaluation.
CONCLUSION This paper describes the system identification and flight control optimization of an unmanned quadrotor. Frequency-domain system identification technique was used to obtain linear state-space representation of a quadrotor, and the flight controller was optimized. The following remarks could be made from this work:
Figure 12 shows the lateral axis flight evaluation. The flight data and simulation of the optimized design have excellent agreement, which proves the fidelity the model. The legacy controller output was generated by identified closed-loop model. The optimized design also shows much less oscillation compared to legacy controller, with slight reduction in response speed. This also validates the frequency-domain analysis results and design summary from CONDUIT® analysis.
1.
9
Ssystem identification is proved to be an efficient approach for dynamic modeling of quadrotor UAV. Quadrotor system dynamics are accurately determined.
2.
Optimization and Trade-offs in Rotorcraft Flight Control Design, AHS Specialist’s Meeting on Rotorcraft HandlingQualities, Liverpool, U. K., 4-6 November, 2008.
Quadrotor lateral and longitudinal bare-airframe dynamics exhibit highly unstable and classical hovering cubic characteristics, and are very symmetrical as expected. The model is dominated by the control and speed stability derivatives. Bare-airframe yaw and heave dynamics are stable and accurately characterized by first order dynamic systems.
3.
Accurate time-domain verification of the identified models using input data not used in the identification shows that the models are very well suited to flight control design.
4.
CONDUIT® is a very efficient tool for flight control design and handling quality analysis. The optimized controller demonstrates significantly improved closed-loop dynamic responses in both simulation and flight testing of the quadrotor.
6
Wei, W. “Development of an Effective System Identification and Control Capability for Quadrotor UAVs”, PhD Dissertation, University of Cincinnati, Cincinnati, OH 45221, 2015. 7
Harding, J. W., Moody, S. J., Jeram, G. J., Mansur, H. M., and Tischler, M. B., “Development of Modern Control Laws for the AH-64D in Hover/Low Speed Flight,” Proceedings of the American Helicopter Society 62nd Annual Forum, Phoenix, AZ, 2006. 8
Mansur, M. H., Lusardi, J. A., Tischler, M. B., and Berger, T., “Achieving the Best Compromise between Stability Margins and Disturbance Rejection Performance,” Proceedings of the American Helicopter Society 65th Annual Forum, Grapevine, TX, 2009.
ACKNOWLEDGES
9 Ivler, C. M., Powell, J. D., Tischler, M. B., Fletcher, J. W., and Ott, C., “Design and Flight Testing of a Cable Angle/rate Feedback Flight Control System for the RASCAL JUH-60 Helicopter,” Proceedings of the American Helicopter Society 68th Annual Forum, FortWorth, TX, USA, 2012.
The authors would like to thank Mr. Nicholas Schwartz for his support in the quadrotor flight testing.
REFERENCES 1
Tischler, M. B., and Remple, R. K, “Aircraft and rotorcraft system identification. 2nd edition,” AIAA Education Series. American Institute of Aeronautics and Astronautics, NY, 2012.
10
Standard, Military. Flying Qualities of Piloted Aircraft, MIL-STD-1797A, Department of Defense, 1990. 11 Standard, Performance Specification, Handling Qualities Requirements for Military Rotorcraft, US Army Aviation and Missile Command, Redstone Arsenal, AL, ADS-33E-PRF, 2000.
2
Woodrow, P. M., Tischler, M. B., Hagerott, S. G. and Mendoza, G. E., “Low Cost Flight Test Platform to Demonstrate Flight Dynamics Concepts using FrequencyDomain System Identification Methods,” AIAA, 2013.
12
Anon, “CONDUIT® User’s Guide, Version 5.0,” University Affiliated Research Center, Moffett Field, CA, 2005. 13 Anon, “CONDUIT® Training Course,” U.S. Army AFDD, Santa Clara, CA, 2009.
3
Wei, W., Tischler, M. B., Schwartz, N., and Cohen, K., “Frequency-Domain System Identification and Simulation of a Quadrotor Controller,” AIAA Modeling and Simulation Technologies Conference, National Harbor, MD, 2014.
14
4
Cooper, G. E., and Harper, R. P. "The Use of Pilot Rating in the Evaluation of Aircraft Handing Qualities," NASA TN D-5153, 1969.
5
15 Duda, H., “Prediction of Pilot-in-the-loop Oscillations due to Rate Saturation,” Journal of Guidance, Control, and Dynamics, vol. 20, No. 3, 1997, pp. 581-587.
Wei, W, and Cohen, K., “Development of a Model based Fuzzy-PID Controller for the AeroQuad Cyclone Quad-copter,” AIAA SCITECH, Kissimmee, FL, 2015. Tischler, M., B., Ivler, C., M., Mansur, M., H., Cheung, K., K., Berger, T., Berrios, M., Handling-Qualities
10