methods have been used for addressing these scale incon- sistencies in different studies on the analysis of gene ex- pression data sets. However, a quantitative ...
Systematic Evaluation of Scaling Methods for Gene Expression Data Gaurav Pandey, Lakshmi Naarayanan Ramakrishnan, Michael Steinbach and Vipin Kumar Department of Computer Science and Engineering, University of Minnesota, Twin Cities, USA {gaurav,lramakri,steinbac,kumar}@cs.umn.edu Abstract Even after an experimentally prepared gene expression data set has been pre-processed to account for variations in the microarray technology, there may be inconsistencies between the scales of measurements in different conditions. This may happen for reasons such as the accumulation of gene expression data prepared by different laboratories into a single data set. A variety of scaling and transformation methods have been used for addressing these scale inconsistencies in different studies on the analysis of gene expression data sets. However, a quantitative estimation of their relative performance has been lacking. In this paper, we report an extensive evaluation of scaling and transformation methods for their effectiveness with respect to the important problem of protein function prediction. We consider several such commonly used methods for gene expression data, such as z-score scaling, quantile normalization, diff transformation, and two new scaling methods, sigmoid and double sigmoid, that have not been used previously in this domain to the best of our knowledge. We show that the performance of these methods can vary significantly across data sets, but Dsigmoid scaling and z-score transformation generally perform well for the two types of gene expression data, namely temporal and non-temporal, respectively.
1
Introduction
Gene expression data, also known as microarray data, quantitatively measures the transcription phase of protein synthesis from several genes simultaneously under a given condition [17], and is used for a variety of biological studies [27]. A necessary step for the effective analysis of gene expression data is its normalization [21], where the data is processed ”to adjust for effects which arise from variation in the microarray technology” [28] used to generate the gene expression data sets. Indeed, several normalization methods, such as LOWESS [31] and SNOMAD [5], have been developed for this task. Some studies have evaluated these methods for several data sets [20, 30], and suggested methods for improving them for certain applications [15]. However, even after an experimentally prepared gene expression data set has been pre-processed using these methods, there may be inconsistencies between the scales of measurements in different conditions or samples, represented as the columns of the gene expression matrix. This inconsistency may be induced by various factors, such as the preparation and processing of different microarrays con-
stituting a gene expression data set by different laboratories, or at different times, or the use of different methodologies for pre-processing the individual arrays. This inconsistency in scale is expected to affect the analysis of the resultant data set, e.g., the correlation between two expression profiles, and thus needs to be handled via further processing. To address these issues, several methods have been developed, commonly categorized under the scaling process in statistics [7]. Specifically, a variety of column scaling and row transformation methods have been used for expression data in different studies [4, 3, 14, 1]. However, a quantitative estimation of their relative performance has been lacking in this domain. In this paper, we evaluate several such methods for their effectiveness with respect to the important problem of inference of protein function, for which gene expression data has been widely used [18]. This paper makes the following contributions: 1. We present an evaluation of several commonly used scaling and transformation methods for gene expression data, such as z-score scaling, quantile normalization, dif f transformation, and two new scaling methods, sigmoid and Dsigmoid (double sigmoid), that have not been used in this domain to the best of our knowledge. 2. We show that the performance of these methods can vary significantly across different data sets, but Dsigmoid scaling and z-score transformation generally perform well respectively for the two types of gene expression data, namely temporal and non-temporal. More details about the methods adopted in this paper and further results are available in a technical report [19] at www.cs.umn.edu/vk/genexscaling.pdf
2
Materials and Methods
This section details the gene expression data sets used in this study, the scaling and transformation methods applied, and the methodologies used to evaluate these methods.
2.1
Data Sets
Gene expression data can be represented as a data matrix where the rows represent genes and the columns represent either individual conditions or the measurement under a particular condition at different times. We distinguish between these two types of data sets–temporal and non-temporal–which we now define below. • Temporal: The experiments in these data sets measure the expression behavior of genes that have been exposed to a certain condition at different instances of time. Thus, there is a well defined relationship between consecutive columns in these data sets. • Non-temporal: These expression data sets are prepared by com-
1200
Gerber et al [8] Hughes et al [10] Iyer et al [11] Saldanha et al [23]
#Genes 6303 6316 6251 6314
#Conditions 10 300 12 24
1000
800
Frequency
Reference
600
400
Table 1: Summary of non-temporal gene expression data sets used Reference
Zhu et al [33] Shapira et al [25]
#Genes 5714 4771
#Time Points 26 70
200
#Time Series 2 4
0 −4
0
2
4
6
8
Expression values
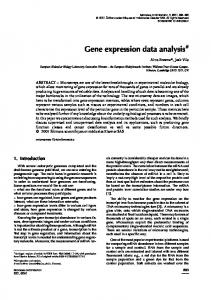
Figure 1: Normal-like distribution of values in column 5 of Gerber et al’s data set [8] outliers to develop an effective scaling method. Here, we first introduce a scaling method that takes into account the consideration that extreme or outlying values should not distort the data analysis significantly. This method is based on the sigmoid function, defined as Sigmoid(x) = (1−e−x )/(1+e−x ). An interesting property of this function is that the extreme values in the input are bounded by ±1, which reduces the adverse effects of extreme values in the data. However, the Sigmoid(x) function has the significant weakness that does not take the background distribution of x, into account when determining the final scaled value. Another important point to consider is that in the case of two-channel gene expression data, a value of 0 in the logratio matrix denotes the expression of a gene that is neutral under the given condition. However, due to noise factors, this value may be distorted by a small amount. Thus, it may be useful for some experiments that values in a small neighborhood of zero be treated effectively as zero. The Sigmoid function doesn’t do this. The second factor can be accounted for by breaking the sigmoid function into two ranges [−1, 0) and (0, 1] and defining separate modifications of the Sigmoid function on them, thus converting the original function into the double sigmoid (Dsigmoid) function. For this study, we chose the formulation of Equation 11 , since it enables us to incorporate the first factor also: x−d 2 Dsigmoid(x) = sign(x − d)(1 − exp(−( ) ))) (1) s Here d and s are the centering and the steepness factors of the function respectively. It can be observed that our formulation of the double sigmoid function is very close to the probability distri2 ¯ ¯ σX ), if d = X bution function of the normal distribution N (X, 2 and s = σX for a vector X. This observation further supports the use of Dsigmoid for scaling gene expression data, since there is evidence that the distribution of gene expression values is often approximately normal [24], as illustrated by Figure 1. This method was implemented in this study by transforming each value Xi in a vector X to Dsigmoid(Xi ) using Equation 1. To the best of our knowledge, this family of methods has not been used for the pre-processing of microarray data.
Table 2: Summary of temporal gene expression data sets used bining data from experiments that do not have a temporal relationship with each other. Although they may be related because they provide a comprehensive view of a certain phenomenon, they can also be analyzed independently. We provide further evidence supporting the need to distinguish between these types and analyze them differently in a longer version of this paper [19]. In accordance with the above distinction, we selected several two-channel gene expression data sets of the two types for S. cerevisiae (budding Yeast), which are summarized in Tables 1 and 2. We chose this organism since substantial information is available about the functions of its genes. The KNNImpute program [29] was used to impute missing values, if any. Also, the temporal data sets that we used consisted of several expression time series experiments, as detailed by the last column of Table 2.
2.2
−2
Column Scaling Methods
We applied the following methods to the columns (conditions) of the non-temporal data sets listed in Table 1 to bring the conditions to the same scale: 1. Unitnorm scaling: A common way of bringing a set of vectors to the same scale is to transform them to unit vectors as U nitnorm(X) = X/||X||2 . This scaling method has been used in various domains, such as text mining [26]. 2. Z-score scaling: A common method of making different data vectors comparable is by shifting the values in a vector by the mean of their values, and dividing them by the standard deviation of the vector, i.e., Znorm(X) = (X − μX )/σX This approach has been used for the evaluation of protein structure alignment scores [9], and also for the scaling of gene expression data [4]. 3. Quantile normalization: This is a popular scaling method for gene expression data [3]. It attempts to transform data from two different distributions to a common distribution by making the quantiles of the distributions equal. We used the quantilenorm function in the MATLAB bioinformatics toolbox, which implements Bolstad (2001)’s formulation of this algorithm [3]. 4. Sigmoid family of scaling methods: The final set of column scaling methods considered take a distribution-oriented approach. Consider Figure 1, which shows the distribution of expression values in the 5th experiment (column) of Gerber et al’s data set [8]. In addition to the normal-like distribution shown by this histogram, it can be observed that there are several outlying values in this vector, such as those lying outside the range [−2, 2]. It is important to consider both the underlying distribution and the presence of
2.3
Row Transformation and Scaling Methods for Temporal Expression Data
Unlike non-temporal data sets, in temporal expression data sets, there are explicit relationships among the different columns of the resultant data matrix. These inter-relationships need to be factored into the scaling process. A common method for this task 1 http://en.wikipedia.org/wiki/Sigmoid
2
function
3.1
is to use the values at a set of consecutive time points to derive a new time series that is better suited for the desired application. We refer to this process as a raw transformation, and investigated the following methods for this task: 1. Smoothing by moving average: A popular method of analyzing time series data is by smoothing the values in a sliding window of duration k by averaging them, known as the moving average �t=i+k−1 Xt (k = 3 in (MA) method, and defined as Xi� = k1 t=i our implementation). This method has been used previously for analyzing circadian gene expression data [12]. 2. Differences between consecutive points: This method transforms the original time series vector X1...n into a new vector X�1...(n−1) using the simple formula Xi� = Xi+1 − Xi , and thus takes only the trend of change between the time points into account, and not the absolute values. This method, named Dif f here, helps reduce the effect of offsets in the values that may be due to experimental error or other factors, and has been used for the functional classification of temporal gene expression data [14]. 3. Z-score: In many instances, time series are compared by considering only deviations from the average. This can be accomplished by using the Z-score, which was defined in Section 2.2. This method, referred to as Ztrans henceforth, has been used previously for the transformation of temporal expression data [1]. In addition, note that the temporal expression data sets used in this study contained multiple time series, as detailed in Table 2. Thus, as per their definition, each of the above transformation methods is applied separately to each time series, and the final transformed expression profile of each gene is obtained by concatenating the individual transformed time series. In summary, a temporal expression data set is scaled in our study by transforming its rows, i.e., the expression profiles of individual genes, using each of the above methods, and then applying the scaling methods discussed in Section 2.2 to each of these transformed matrices.
The ground truth considered in this methodology consists of experimentally observed and computationally inferred interactions between pairs of genes in S. cerevisiae. We used a set of 41902 such pairwise interactions used by Yona et al [32] in their study. This set is constructed using four types of interactions, namely (i) physical protein-protein interactions, (ii) metabolic pathway comembership, (iii) regulation by the same promoter, and (iv) comembership in sequence homology clusters. For this ground truth, the following evaluation methodology was used. Pairwise correlations are calculated among all expression profiles in the given data set, and the corresponding gene pairs are sorted in descending order according to their corresponding expression correlation. Now, starting from the most similar gene pair, the total number of pairs which are known to be functionally related according to the above set, are cumulatively added. These numbers can then be used to produce a plot of the number of true functional relationships recovered versus the number of gene pairs analyzed in the order of decreasing similarity.
3.2
Similarity of Functional Labels (SimFuncLabels)
The second type of functional relationships we used are derived from the annotations of yeast genes using the FunCat functional classification scheme [22]. Since FunCat is a hierarchical scheme, we used the 81 classes at a depth of two from the root of the hierarchy. Now, for the genes annotated with these classes, an annotation vector is constructed for each gene, containing 1 for the classes that the protein is annotated with, and 0 for the others. This set of vectors is then partitioned using the CLUTO clustering toolkit [13]. Then, each cluster is treated as a clique, and two genes are considered functionally related if they are part of the same clique. Finally, once the set of relationships has been derived, the evaluation methodology is identical to that adopted in the ObservedFuncRels methodology. In addition, we also used an evaluation methodology based on the SwissProt keyword recovery (KR) metric [16]. The reader is referred to the technical report version [19] for details and results of this methodology, which are generally consistent with results of the ObservedFuncRels and SimFuncLabels methodologies.
Finally, an important component of our evaluation methods, discussed in the next section, is a similarity measure used to compute the co-expression of two genes in a gene expression data set. For this, we used Pearson’s correlation coefficient, which is one of the most widely used similarity measures for microarray data [6].
3
Recovery of Observed Functional Relationships (ObservedFuncRels)
Evaluation Methodology
4
Evaluation Results
In this section, we present the results of the application of the overall evaluation methodology to several non-temporal and temporal gene expression data sets listed in Tables 1 and 2 respectively. In addition, we also reinforce this distinction by providing evidence that different types of scaling and transformation methods need to be applied to nontemporal and temporal expression data sets in order to extract maximum functional information from them. We only show the portions of the complete plots that correspond to the most highly ranked gene pairs in terms of their expression similarity, as they are the ones expected to include the most function information. Also, in addition to the results of the scaling methods, we also plot the results obtained from the unscaled (raw) data set, and those ob-
Suppose an expression matrix M has been scaled using a method A (with or without the row transformation step) to produce MA . In order to evaluate the method A in terms of their effectiveness in magnifying the available functional information in M , we examined the pairwise links between genes ranked by the correlation of their expression profiles in MA to see if the most highly ranked links tend to connect genes with similar function. The functional evidence is derived from two sources, namely Yona et al’s data set of pairwise gene relationships [32] and the FunCat classification scheme [22], both of which represent a different form of the definition of protein function. This evaluation process is applied to each of the scaled versions of M , and the results are compiled in order to judge the relative performances of different scaling methods. Following are the details of the two types of functional information and how they are used for the evaluation.
3
500
400
1500
Raw Unitnorm Znorm Quantile Sigmoid Dsigmoid Random
Number of functional relationships uncovered
Number of functional relationships uncovered
600
300
200
100
0 0
0.5
1
1.5
2
2.5
3
3.5
4
4.5
1000
Raw Unitnorm Znorm Quantile Sigmoid Dsigmoid Random
500
0 0
5
0.5
1
1.5
2
2.5
3
3.5
4
4.5
4
x 10
Gene pairs ordered by similarity
(a) Results using ObservedFuncRels
(a) Results using ObservedFuncRels
3000
2500
4000
Raw Unitnorm Znorm Quantile Sigmoid Dsigmoid Random
Number of functional relationships uncovered
Number of functional relationships uncovered
4000
3500
2000
1500
1000
500
0 0
0.5
1
1.5
2
2.5
3
3.5
4
4.5
3500
3000
2500
Raw Unitnorm Znorm Quantile Sigmoid Dsigmoid Random
2000
1500
1000
500
0 0
5
0.5
1
1.5
2
2.5
3
3.5
4
4.5
4
Gene pairs ordered by similarity
5 4
x 10
x 10
Gene pairs ordered by similarity
(b) Results using SimFuncLabels
(b) Results using SimFuncLabels
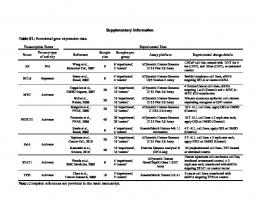
Figure 2: Evaluation on Gerber et al [8]’s data set
Figure 3: Evaluation on Hughes et al [10]’s data set
tained by a random selection of gene pairs. Note that the plots presented in this section are best viewed in color and a size larger than shown here.
400
Number of functional relationships uncovered
4.1
5 4
x 10
Gene pairs ordered by similarity
Results for non-temporal expression data
For this evaluation, we applied the following scaling methods listed in Section 2.2 to the columns of these data sets: Unitnorm, Znorm, Sigmoid, Dsigmoid, and Quantile. Figures 2-5 show the results of evaluation according to the (a) ObservedFuncRels, and (b) SimFuncLabels evaluation methodologies for four non-temporal expression data sets. The following general observations can be made from these results. Firstly, for nearly all these data sets, almost all the scaling methods are able to extract more accurate functional relationships than those extracted from the raw unscaled version of the data sets. This indicates that scaling, even using simple methods, is able to enhance the functional content of most non-temporal gene expression data sets. Examining the results more closely, we observe from Figure 2 that the Dsigmoid method performs well for Gerber et al’s data set [8]. In particular, it is able to outperform almost all other methods in Figures 2(b) substantially, and is close to the top performer in Figure 2(a). In Figures 3(a) and (b) also, Dsigmoid is among the top performers. In another set of results, Figures 4 and 5 show that for Iyer et al [11]’s and Saldanha et al [23]’s non-temporal expression data sets, the Unitnorm scaling method produces the best results. This observation is supported most strongly
350
300
250
Raw Unitnorm Znorm Quantile Sigmoid Dsigmoid Random
200
150
100
50
0 0
0.5
1
1.5
2
2.5
3
3.5
4
4.5
5 4
x 10
Gene pairs ordered by similarity
(a) Results using ObservedFuncRels
Number of functional relationships uncovered
900
Raw Unitnorm Znorm Quantile Sigmoid Dsigmoid Random
800
700
600
500
400
300
200
100
0 0
0.5
1
1.5
2
2.5
3
3.5
4
4.5
5 4
Gene pairs ordered by similarity
x 10
(b) Results using SimFuncLabels
Figure 4: Evaluation on Iyer et al [11]’s data set
by Figures 4(b) and 5(b). For these data sets, Dsigmoid also produces good results, as shown by Figures 4(a) and 5(a). 4
1000
800 700 600
800
Raw Unitnorm Znorm Quantile Sigmoid Dsigmoid Random
Number of functional relationships uncovered
Number of functional relationships uncovered
900
500 400 300 200 100 0 0
0.5
1
1.5
2
2.5
3
3.5
4
4.5
Gene pairs ordered by similarity
700
600
500
400
300
200
100
0 0
5
Raw MA_Znorm Diff_Unitnorm Ztrans_Dsigmoid Raw_Dsigmoid Random
0.5
3
3.5
4
4.5
400
200
0.5
1
1.5
2
2.5
3
3.5
4
4.5
5000
4000
Raw MA_Znorm Diff_Raw Ztrans_Raw Raw_Sigmoid Random
3000
2000
1000
0 0
5
0.5
1
1.5
2
2.5
3
3.5
4
4.5
4
Gene pairs ordered by similarity
5 4
x 10
x 10
Gene pairs ordered by similarity
(b) Results using SimFuncLabels
(b) Results using SimFuncLabels
Figure 5: Evaluation on Saldanha et al [23]’s data set
Figure 6: Evaluation on Zhu et al [33]’s data set
We believe that the better performance of Unitnorm as compared to Dsigmoid for these data sets is because of the relatively smaller fraction of extreme values in their columns, due to which their norms are not affected adversely. Finally, we observe that the Quantile, Znorm and Sigmoid scaling methods also generally produce functionally richer matrices than the raw data set and may show better performance for data sets that have different characteristics than the ones considered. 4.2
5 x 10
6000
Raw Unitnorm Znorm Quantile Sigmoid Dsigmoid Random
Number of functional relationships uncovered
Number of functional relationships uncovered
2.5
(a) Results using ObservedFuncRels
600
0 0
2
4
1200
800
1.5
Gene pairs ordered by similarity
(a) Results using ObservedFuncRels
1000
1
4
x 10
Number of functional relationships uncovered
600
500
400
300
200
100
0 0
Results for temporal expression data
Raw MA_Raw Diff_Unitnorm Ztrans_Unitnorm Raw_Unitnorm Random
0.5
1
1.5
2
2.5
3
3.5
4
4.5
5 4
x 10
Gene pairs ordered by similarity
We now present the results for temporal expression data sets, which are scaled using the algorithm in Section 2.3. We tried all combinations of row transformation methods (no transformation (Raw), MA, Diff and Ztrans) and column scaling methods (no scaling Raw, Unitnorm, Znorm, Sigmoid, Dsigmoid and Quantile). However, to simplify presentation, we show results only for the best column scaling for each row transformation method. The best methods are identified using the area under the curves produced by the respective evaluation methodology. Figures 6 and 7 show the evaluation results for Zhu et al [33]’s and Shapira et al [25]’s data sets respectively. The following observations can be made from these results: 1. In all the plots, there is at least one transformed and/or scaled version of the data that produces better results than the raw data set, although in some cases, the improvement is rather modest. This indicates that scaling can be useful
(a) Results using ObservedFuncRels
Number of functional relationships uncovered
8000
7000
6000
5000
Raw MA_Sigmoid Diff_Unitnorm Ztrans_Unitnorm Raw_Sigmoid Random
4000
3000
2000
1000
0 0
0.5
1
1.5
2
2.5
3
3.5
4
4.5
5 4
Gene pairs ordered by similarity
x 10
(b) Results using SimFuncLabels
Figure 7: Evaluation on Shapira et al [25]’s data set
for enhancing the functional content of temporal data sets. 2. In all the results, some combination of a transformation 5
References
before scaling produces significantly better results than just applying a scaling method to the columns of the data matrix. For instance, in Figure 6(a), the Ztrans Dsigmoid scaling produces better results than just the Dsigmoid method (presented as Raw Dsigmoid) in Figure 6(a). 3. Most of the results show that the Ztrans method of time series transformation produces the best results among all transformation methods, such as in Figure 7(b). We note that for temporal data, unlike non-temporal data, only a few transformation and scaling methods are able to outperform the raw data set. This indicates that although the methods used here are useful, it may be fruitful to use more sophisticated techniques, such as normalized B-splines [2].
[1] R. Balasubramaniyan et al. Clustering of gene expression data using a local shape-based similarity measure. Bioinformatics, 21(7):1069–1077, 2004. [2] Z. Bar-Joseph, G. Gerber, D. K. Gifford, T. S. Jaakkola, and I. Simon. Continuous representations of time series gene expression data. J Comput Biol., 10(3–4):341–356, 2003. [3] B. M. Bolstad. Probe level quantile normalization of high density oligonucleotide array data. Unpublished. Available at http://bmbolstad.com/stuff/qnorm.pdf, 2001. [4] C. Cheadle et al. Analysis of Microarray Data Using Z Score Transformation. J Mol Diagn, 5(2):73–81, 2003. [5] C. Colantuoni et al. Snomad (standardization and normalization of microarray data): web-accessible gene expression data analysis. Bioinformatics, 18(11):1540–1541, 2002. [6] D’haeseleer and Patrik. How does gene expression clustering work? Nat Biotech, 23:1499–1501, 2005. [7] P. Dunn-Rankin, G. A. Knezek, S. Wallace, and S. Zhang. Scaling Methods. Lawrence Erlbaum, 2004. [8] A. P. Gerber et al. Extensive association of functionally and cytotopically related mrnas with puf family rna-binding proteins in yeast. PLoS Biology, 2(3):E79, 2004. [9] L. Holm and J. Park. DaliLite workbench for protein structure comparison. Bioinformatics, 16(6):566–567, 2000. [10] T. R. Hughes et al. Functional discovery via a compendium of expression profiles. Cell, 102(1):109–126, 2000. [11] V. R. Iyer, C. Horak, L. Kuras, et al. Genome-wide maps of DNA-protein interactions using a yeast ORF and intergenic microarray. Nature Genetics, 23:53, 1999. [12] M. Izumo, T. R. Sato, M. Straume, and C. H. Johnson. Quantitative analyses of circadian gene expression in mammalian cell cultures. PLoS Comp Biol, 2(10):e136, 2006. [13] G. Karypis. CLUTO - a clustering toolkit. Technical Report 02-017, CS Deptt, Univ of Minnesota, 2002. [14] A. Laegreid et al. Predicting gene ontology biological process from temporal gene expression patterns. Genome Research, 13(5):965–979, 2003. [15] W. K. Lim et al. Comparative analysis of microarray normalization procedures: effects on reverse engineering gene networks. Bioinformatics, 23(13):i282–i288, 2007. [16] E. M. Marcotte et al. A combined algorithm for genome-wide prediction of protein function. Nature, 402(6757):83–86, 1999. [17] D. V. Nguyen, A. B. Arpat, N. Wang, and R. J. Carroll. DNA microarray experiments: biological and technological aspects. Biometrics, 58(4):701– 717, 2002. [18] G. Pandey, V. Kumar, and M. Steinbach. Computational approaches for protein function prediction: A survey. Technical Report 06-028, CS Deptt, Univ of Minnesota, 2006. [19] G. Pandey, L. N. Ramakrishnan, M. Steinbach, and V. Kumar. Systematic evaluation of scaling methods for gene expression data. Technical Report 07-015, CS Deptt, Univ of Minnesota, 2007. www.cs.umn.edu/vk/genexscaling.pdf. [20] T. Park et al. Evaluation of normalization methods for microarray data. BMC Bioinformatics, 4:33, 2003. [21] J. Quackenbush. Microarray data normalization and transformation. Nature Genetics, 32:496–501, 2002. [22] A. Ruepp et al. The FunCat, a functional annotation scheme for systematic classification of proteins from whole genomes. Nucleic Acids Res., 32(18):5539–5545, 2004. [23] A. J. Saldanha, M. J. Brauer, and D. Botstein. Nutritional Homeostasis in Batch and Steady-State Culture of Yeast. Mol. Biol. Cell, 15(9):4089–4104, 2004. [24] E. Segal et al. Rich probabilistic models for gene expression. In Bioinformatics), pages S243–S252, 2001. [25] M. Shapira, E. Segal, and D. Botstein. Disruption of Yeast Forkheadassociated Cell Cycle Transcription by Oxidative Stress. Mol. Biol. Cell, 15(12):5659–5669, 2004. [26] A. Singhal et al. Pivoted document length normalization. In Proc. 19th ACM SIGIR Conference, pages 21–29, 1996. [27] D. K. Slonim. From patterns to pathways: gene expression data analysis comes of age. Nature Genetics, 32(Suppl):502–508, 2002. [28] G. K. Smyth and T. Speed. Normalization of cDNA microarray data. Methods, 31(4):265–273, 2003. [29] O. G. Troyanskaya et al. Missing value estimation methods for dna microarrays. Bioinformatics, 17(6):520–525, 2001. [30] W. Wu et al. Evaluation of normalization methods for cDNA microarray data by k-NN classification. BMC Bioinfo., 6:191, 2005. [31] Y. H. Yang et al. Normalization for cDNA microarray data: a robust composite method addressing single and multiple slide systematic variation. NAR, 30(4):e15, 2002. [32] G. Yona et al. Effective similarity measures for expression profiles. Bioinformatics, 22(13):1616–1622, 2006. [33] G. Zhu et al. Two yeast forkhead genes regulate the cell cycle and pseudohyphal growth. Nature, 406:90–94, 2000.
Further results on the need to analyze temporal and nontemporal expression data sets, and related topics, can be found in a longer version of this paper [19].
5
Conclusions and Future Work
In this paper, we reported an evaluation of scaling and transformation methods for gene expression data. Following are the main results obtained from this study: 1. The performance of different scaling (and transformation) schemes may vary significantly over data sets and types of functional information being predicted. 2. For non-temporal data, most of the commonly used scaling methods improve the performance, but some improve the performance a lot more than others. In particular, the Dsigmoid method, which has not been used previously for microarray data analysis to the best of our knowledge, performs significantly better than others for several combinations of data sets and functional information. 3. For temporal data, some transformations (followed by scaling), such as Ztrans, do improve the prediction performance for temporal data, but some popular transformations (followed by any scaling) perform worse than raw data. This indicates that great care needs to be taken in the selection of the right transformation method. In future work, it will be useful to perform an evaluation for contexts other than protein function prediction, such as the identification of genes involved in cancer. It will also be interesting to investigate the properties of the different scaling and transformation methods that enable them to produce better or worse results than those obtained from the raw gene expression data set.
Acknowledgement We thank Chad Myers, Fumiaki Katagiri and Judith Berman for their insightful comments on the paper. We also thank Golan Yona for making their data available to us. This work was supported by NSF grants CRI-0551551, IIS-0308264 and ITR-0325949. Access to computing facilities was provided by MSI.
6