Table S1. Model parameters of response variables including R2, cross
Recommend Documents
Table S1 Parameters for the temporal model. parameters values unit parameters values unit a1. 2.25x10+04. /M/s tp2_2. 1.00x10-04. /s a2. 6.00x10+03. /M/s tr1.
S1 Table. The parameters of a full and reduced model. The full model includes all measured variables, but due to missing values includes fewer samples ...
(salinity 7); E (salinity 4) and the sediment horizon (A1-C see Fig. 5). ... 0.06. 0.03. 0.49. 8.2. D_II_A2. 186.42. 0.06. 0.02. 0.48. 8. D_II_B1. 172.35. 0.04 ... 0.14. 4.07. 9.8. E_III_C. 9.16. 0.4. 0.16. 3.89. 9.6. Klier et al. supplementary mater
Manufacturer. Model. Kernel. Slice Thickness. KVp. mAs. # of scans. GE MEDICAL SYSTEMS. CT scan. STANDARD. 2.5. 120. 60. 8. GE MEDICAL SYSTEMS.
Model parameters. Parameter. Value. Description. Source. VES. 0.4. Reduction in susceptibility from vacci- nation. [1]. VEI. 0.4. Reduction in infectiousness from ...
itm. ANT. 3760.58. 61.32 -0.29 itm. REL. 6561.05. 81.00 -0.82 subj (Intercept) .... Table S5: Wald tests for the ERP amplitude model (350-500 ms) in Table S4 Ï2.
bone marrow (sternum), mandibular lymph nodes, mesenteric lymph nodes, spleen, liver and lung were examined in all groups. For all other organs (see list ...
Coding. Christopher Thomas. Michael Bedward. Model code. Free download of all code at https://github.com/pzylstra/ffm_cpp/tree/Zylstra2016. Input files.
Dataset of captured Carcinus maenas , including ID, Year, Site, Station, Carapace. Width, Sex, Color and Body Condition. ID. Year. Site. Station. CW (mm) Sex.
Table S1: Summary of all compounds including abbreviations, providers, tested concentrations and the effect on OD620nm and live/dead ratio. Biofilm viability ...
Wasp Voucher #. Morpho-species. Collecting locality. S1 Table . ..... Moina, TAS #33b; Eadya paropsidis larva. Emerged from field collected Pst. agricola.
Supplementary Table S1. Unfavorable immunocellular factors for patients with. DLBCL. Parameters. Unfavorable factor. Uni
Formation of a stable ternary complex between Cas1-Cas2, protospacer P1 and CRISPR- containing plasmid pCOLA-Z0. Samples contained combinations of ...
Ryan C. Kennedy, Meir Marmor, Ralph Marcucio, and C. Anthony Hunt. Beyond .... Craver, Carl and Tabery, James, "Mechanisms in Science", The Stanford ...
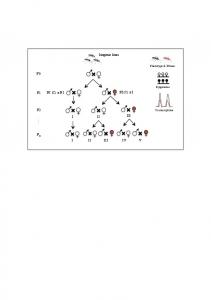
Page 1. Isogenic lines! NI (C) x NI! NI(C) x I ! F0! F1! F2! FX! Transcriptome! Epigenome! Phenotype & Fitness! I! II! III! IV! V! I! II! III! ....!
Parameter. Value. ASSOCIATE GRAPH NODE FILTER. 0.4 *. LIGAND CONTACT DISTANCE CUTOFF. 5.0 *. LOCAL SCORE true. MATCH SECONDARY ...
Table S1 â Anthropometric and biochemical variables (mean ± standard error) in obese and non-obese women stratified by usual homozygous and less ...
8. Figure S1B. Observed vs. metamodel-predicted NO3. - at water table in 1980, mg/L (NO3_WT_mgL_1980) (training R2 = 0.60; hold-out R2 = 0.52) ...
Table S1. Parameter estimates for environmental variables, 95% confidence intervals, and P-values from a mixed model examining the factors influencing time arctic ground squirrels spent above ground each ... The solid line shows the mean.
Table S1. Model parameters of response variables including R2, cross
Model parameters of response variables including R2, cross-validated R2 (Q2), Root. Mean Square Error of the Estimate (RMSEE), Root Mean Square of the ...
Table S1. Model parameters of response variables including R 2, cross-validated R2 (Q2), Root Mean Square Error of the Estimate (RMSEE), Root Mean Square of the Prediction (RMSEP) and Residual Prediction Deviation (RPD).
R2
Q2
RMSEE
RMSEP
RPD
Unassigned
0.983*
0.969*
0.009
0.024
2.921
Fungi (other)
0.983 *
0.974*
0.015
0.073
1.620
Cenococcum
0.959 *
0.913*
0.001
0.002
11.406
Pseudogymnoascus
0.968*
0.899*
0.015
0.030
5.514
Yarrowia
0.971*
0.958*
0.002
0.010
5.318
Mielomyces
0.985*
0.959*
0.000
0.001
19.843
Cortinarius
0.973*
0.936*
0.001
0.002
14.049
Entoloma
0.986*
0.978*
0.000
0.001
13.477
Russula
0.987*
0.961*
0.000
0.000
25.994
Pseudotomentella
0.982*
0.954*
0.003
0.005
16.197
Cryptococcus
0.977*
0.980*
0.013
0.032
7.096
Mortierella
0.988*
0.982*
0.031
0.068
4.112
Mucor
0.964*
0.944*
0.051
0.070
4.014
Genus
(*) The asterisk denotes that the two regression lines fitting R 2 and Q2 values of the permuted models (20 permutations) met the validity requirements set by Lindgren et al. (1996), namely Y-intercepts below 0.3-0.4 for the former parameter and below 0.05 for the latter.