Player Performance Prediction in Massively Multiplayer Online Role-Playing Games (MMORPGs)
Technical Report
Department of Computer Science and Engineering University of Minnesota 4-192 EECS Building 200 Union Street SE Minneapolis, MN 55455-0159 USA
TR 10-003 Player Performance Prediction in Massively Multiplayer Online Role-Playing Games (MMORPGs) Kyong Jin Shim, Richa Sharan, and Jaideep Srivastava
February 04, 2010
Player Performance Prediction in Massively Multiplayer Online Role-Playing Games (MMORPGs) ∗
Kyong Jin Shim
Department of Computer Science & Engineering University of Minnesota 200 Union Street SE Minneapolis, MN 55455, USA
[email protected]
Richa Sharan
Jaideep Srivastava
Detroit Country Day Upper High School 22305 West Thirteen Mile Rd Beverly Hills, MI 48025, USA
Department of Computer Science & Engineering University of Minnesota 200 Union Street SE Minneapolis, MN 55455, USA
[email protected]
ABSTRACT Recent years have seen an ever increasing number of people interacting in the online space. Massively multiplayer online role-playing games (MMORPGs) are personal computer or console-based digital games where thousands of players can simultaneously sign on to the same online, persistent virtual world to interact and collaborate with each other through their in-game characters. In recent years, researchers have found virtual environments to be a sound venue for studying learning, collaboration, social participation, literacy in online space, and learning trajectory at the individual level as well as at the group level. While many games today provide web and GUI-based reports and dashboards for monitoring player performance, we propose a more comprehensive performance management tool (i.e. player scorecards) for measuring and reporting operational activities of game players. This study uses performance data of game players in EverQuest II, a popular MMORPG developed by Sony Online Entertainment, to build performance prediction models for game players. The prediction models provide a projection of player’s future performance based on his past performance, which is expected to be a useful addition to existing player performance monitoring tools. First, we show that variations of PECOTA [2] and MARCEL [3], two most popular baseball home run prediction methods, can be used for game player performance prediction. Second, we evaluate the effects of varying lengths of past performance and show that past performance can be a good predictor of future performance up to a certain degree. Third, we show that game players do not regress towards the mean and that prediction models built on buckets using discretization based on binning and histograms lead to higher prediction coverage.
[email protected]
ments such as EverQuest II serve as a major mechanism for socialization [4]. In particular, educational research has found virtual environments to be a sound venue for studying learning, collaboration, social participation, literacy in online space, and learning trajectory at the individual level as well as at the group level. Online communities and virtual worlds alike frequent journals and conference proceedings in the field of Learning Sciences. Learning takes place beyond classroom doors, and virtual worlds have allowed researchers to study learning in naturally occurring contexts [5]. A more recent study [6] sets out to examine the discourse of MMORPG gaming wherein the primary emphasis of research lies in understanding individual-level participation, social and material practices, literacy, community membership, and individual learning trajectory in MMORPGs. The present research is concerned with learning in virtual environments and examines online player performance in EverQuest II, a popular massively multiplayer online roleplaying game (MMORPG) developed by Sony Online Entertainment. In particular, this study is concerned with forecasting of player performance in the game.
2. CONTRIBUTIONS
While many games today provide web and GUI-based reports and dashboards for monitoring player performance, we propose a more comprehensive performance management tool (i.e. player scorecards) for measuring and reporting operational activities of game players. This study uses operational and process-oriented performance data of game players in EverQuest II, a popular MMORPG developed by Sony Online Entertainment, to build performance prediction models for game players. First, we show that variations of PECOTA [2] and MARCEL [3], two most popular baseball 1. INTRODUCTION Massively Multiplayer Online Role-Playing Games (MMORPGs) home run prediction methods, can be used for game player performance prediction. Second, we evaluate the effects of are personal computer or console-based digital games where varying lengths of past performance and show that past perthousands of players can simultaneously sign on to the same formance can be a good predictor of future performance up online, persistent virtual world to interact and collaborate to a certain degree. Third, we show that game players do with each other through their in-game characters. In recent not regress towards the mean and that prediction models years, researchers have taken notice that virtual environbuilt on buckets using discretization based on binning and ∗Corresponding author. histograms lead to higher prediction accuracy. Systematic studies of game player performance is expected to yield the following contributions. First, as discussed in
Section 3.3, analysis of player performance in different dimensions (i.e. player demographics, archetypes, classes, subclasses) can help game developers understand whether their games and game characters are being played as intended. Second, benefits for game players are two fold. a) Game players can not only have a view of their past and current performance but also they can have a view of their projected future performance. b) A recommendation engine can be built to recommend character types and tasks to players in order to meet certain objectives (i.e. move up to the next level as fast as possible, play safe by attempting easy tasks, play aggressively by attempting challenging tasks, play tasks that encourage grouping with other players). Third, players can have a view of performances of other players for the purposes of forming a quest or raid teams.
Monster Baby dune Baby dune Baby dune Baby dune Baby dune
cobra cobra cobra cobra cobra
M-Level 13 13 15 15 15
M-Tier 5 5 5 5 5
Player Level 16 19 13 21 22
Points 52 12 141 27 12
Table 1: Monster Level and Tier
3. EVERQUEST II GAME MECHANICS 3.1 Point-Scaling System in EverQuest II In EverQuest II, there is a concept of Ding Points, which is the amount of points one needs to obtain in order to move from one level to the next higher level [7]. For instance, to move from Level 2 to Level 3, one needs to obtain 1,000 points whereas 20,000 points are required to move from Level 73 to 74. The amount of ding points increases as one advances to the next level. As players gain more experience with the game and advance to higher levels, the types of task they can perform increase and the task difficulty also increases. The higher the task difficulty, the higher the potential point gain.
3.2 Tasks in EverQuest II EverQuest II is rich in types of task players can perform with monster kills being one of the most popular. In monster kills, each monster has a level and a tier. The two values indicate the difficulty of a monster. The higher the two values, the more difficult or challenging it is for a given player to kill the monster. The monster level increase is not a monotonic function (i.e., monster level 17 is not necessarily difficult than monster level 16 because difficulty is an aggregate function of monster levels and tiers). In successfully killing the monster, a player obtains points. The amount of points assigned is minimally dependent upon three factors: 1) monster’s level, 2) monster’s tier, and 3) player’s level. Table 1 shows performance data from killing a baby dune cobra. This example shows two different baby cobras: one having level 13 and tier 5 and the other having level 15 and tier 5. Two players of levels 16 and 19, respectively, performed the first task and obtained scores of 52 and 12. In performing the same task, the player with a lower level obtains more points. The same trend is shown in the second example where three players performed the same task, and the player with the lowest level obtains the highest points amongst the three. These examples illustrate how EverQuest II rewards adjusted points based on task difficulty and player skill level. In addition to monster kills, other sources of experience points exist in the game such as alternate achievement points (AA) which can be obtained from quests, named mobs, and discovery experience. A player can gain more experience points by having another player mentor him. The mentor levels down to the level of the mentee. The mentee receives a five percent bonus to adventuring experience points.
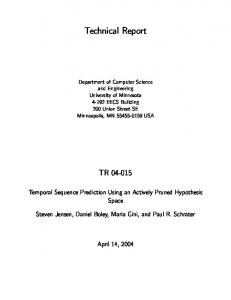
Figure 1: Average Play Times of Five Sub-classes in EverQuest II
3.3 Archetypes, Classes, and Sub-classes in EverQuest II In playing MMORPGs, selection of character type (i.e. archetype, classes, sub-classes, race, etc) is considered an important decision as it defines the basis of opportunities and choices of roles and tasks within the game [8]. In EverQuest II, there are four archetypes where each archetype consists of three classes each of which in turn consists of two sub-classes [7]. Figure 1 shows average performance of five sub-classes in the month of March, 2006. Performance at each player level is defined as a function of play time at each player level. Fury sub-class is of priest archetypes. Fury characters specialize in healing, and their primary task as a member of a raid team is to heal other members in combats. Fury subclass is favorite as a solo character, but it is also effective in team plays (i.e. monster raids, quests). On the other hand, berserker sub-class is of fighter or warrior archetype. It is considered a pure class of fighters, and berserker characters can make use of any weapon possible to fight monsters. They are considered well-rounded as solo players or team players. They possess and use heavy armors and can sustain injuries for a long time. In raid groups, berserker character often times play tanks, confronting vicious monsters up front whereas other character play as supporters and healers. Figure 1 shows that players of fury sub-class spend relatively less amount of play time in order to progress to the next level. This trend is consistent across all 70 player levels. There can be several reasons as to why berserker characters, on average, progress to the next level slower than fury characters. One possible explanation might be that berserker characters in general may not be performing activities that would amount to experience point gain. For instance, it is recommended that a player explores a zone that he plans on questing. Zoning does not lead to experience point gain. Yet
another explanation might be that sub-classes that progress relatively slower may be performing tasks whose experience point gain is not substantial. For instance, mentoring system in EverQuest II allows a player to level down to mentor a lower level player. The experience point gain for the mentor can be substantially small, however, it allows the mentee to gain more experience points and the mentor to perform tasks that are no longer accessible to players at his current level. Multiple online resources are available today that show how to level up fast [9], and there can be numerous other explanations as to why certain sub-classes progress relatively slow. The rich dataset we have is expected to allow our analysis to reveal information at the level of granularity appropriate to answer these questions, and it is our future direction to explore these research questions.
4. BASEBALL HOME RUN PREDICTION
experience points at each level in order to move up to the next level. Because the ding point is a fixed constant, we measure a game player’s total play time at each level and uses it as a performance measure in this study.
5. PLAYER PERFORMANCE PREDICTION IN EVERQUEST II In this study, we develop performance prediction models for game players in EverQuest II, a popular MMORPG developed by Sony Online Entertainment. The objective is to predict a given player’s play time at level i, a future state, based on his/her past performance at levels i − 1, i − 2, and so forth, where performance at any level is measured as the total play time spent at that level. Play time in EverQuest II excludes any idle periods where being idle is defined as any contiguous time block of 30 minutes or beyond.
Prediction of future performance of humans has long been studied in various disciplines over the years. Most notably, it has been well studied in sports. Baseball has a long history of record keeping and statistical analyses that dates back to the nineteenth century. Batting average, RBIs, and home runs are some of the many statistics being kept track of today. There exists an enormous amount of public and private interest in the projection of future performance. Major league teams rely on the past statistics of a given player in deciding whether to acquire him or not and for how many seasons under the assumption that his past success is a good indication of his future success. PECOTA [2] and MARCEL [3] are widely known methods in baseball home run prediction.
5.1 Methods
4.1 PECOTA
Algorithm 1 MARCEL approach - Calculate Predicted Play Time for Player J at Level I player levels = 70 num players[] (array of player numbers at each level) play times[] (array of play times at each level) avg play times[] (temporary array initialized to zero) for i = 1 to player levels do avg play times[i] = play times[i]÷num players[i] (array of average play times across all players at each level) end for T (predicted play time at level I) P (number of previous levels) avg play times[] (array of average play time at each level) player play times[][] (array of individual player play times at each level) weights[] (array of weights) A = 0, M = 0, N = I − P, temp (temporary variables) while N < I do temp = avg play times[N ] − player play times[J][N ] temp = temp × weights[M ] A = A + temp N ←N +1 M ←M +1 end while T = avg play times[I] × A
PECOTA [2] is considered a very sophisticated method for home run prediction in baseball. For a given ball player at the age of X, the method uses a nearest neighbor analysis of both minor and major league players from the past that exhibited similar performance at age X. It uses the historical performance of these past players to predict the given player’s future performance.
4.2 MARCEL MARCEL [3] uses data from the three immediate past seasons of a given ball player, and it assigns more weight to more recent seasons. One drawback of this approach is that prediction models solely based on individual players cannot be generalized to the global population. A variation of the MARCEL approach attempts to regress predictions to the global population mean. One drawback of this approach is that prediction models built on the global population can become too coarse.
4.3 Using Home Run Prediction Methods for Game Player Performance Prediction We consider game player levels in EverQuest II similar to seasons in baseball. Players perform tasks, gain points, and move up to the next level as ball players would attain different types of achievement (i.e. home runs, single, double, triple hits, run batted in, etc.) in each season and proceed to the next season. Unlike in baseball where there is not necessarily a fixed number of home runs, triples, doubles, etc. required to move to the next season, EverQuest II employs a point scaling system where there exists a fixed number of
MARCEL [3] method uses data from the three immediate past seasons of a given ball player, and it assigns more weight to more recent seasons. One drawback of this approach is that prediction models solely based on individual players cannot be generalized to the global population. A variation of the MARCEL approach attempts to regress predictions to the global population mean. One drawback of this approach is that prediction models built on the global population can become too coarse. Algorithm 1 delineates the steps taken to generate MARCEL-like prediction models for game player performance prediction.
Our preliminary data analysis of the game data reports that play times at each player level exhibit a skewed distribution. Figure 2 shows the distribution of level 15 players by their play times. EverQuest II game players do not regress towards the mean, and therefore prediction models built un-
Figure 2: Distribution of Level 15 Players by Play Time (March, 2006)
der the assumption that they do regress towards the mean will become too coarse and will perform poorly for players whose performances deviate from the mean. To overcome this problem, for a given player, PECOTA [2] uses past performance of those players whose performance patterns are similar to that of the given player. In this study, we perform data discretization based on two unsupervised techniques, binning and histogram analysis, in order to create buckets of players where all players in a given bucket are termed neighbors. Neighbors share similar performance patterns, and a prediction model is built for each bucket. This is similar to the way PECOTA [2] uses a nearest neighbor analysis to group players into buckets and build a prediction model for each bucket. Algorithms 2 and 3 delineate the steps taken to create buckets based on binning and histogram analysis, respectively. Parameter K (number of buckets) is set to values ranging from 1 to 50. When K is set to 1, all players at each player level are put into a single bucket, per the original MARCEL method. We increase the value of K and thereby segmenting players into more buckets. First, we perform equal-width binning and thereby assigning an equal number of players into each bucket regardless of their actual play times. Second, we perform histogram analysis and thereby assigning players into buckets where each bucket has a set lower bound and upper bound. We assign each player into a bucket where his play time is within the range of lower/upper bound set for that bucket. This method of discretization somewhat ensures that players in each bucket have play times closer to their neighbors (neighbors are other players belonging to the same bucket) and farther away from players in other buckets.
5.2 Dataset The study uses one month worth of performance data from March 1, 2006 to March 31, 2006. The dataset contains over 36 million player-to-task records where over four million of them are monster kills related tasks. The dataset contains 24,571 distinct players across player levels 1 through 70. Since then, Sony Online Entertainment has added an additional ten levels to the game, making 80 the maximum level one can reach. All of the players and their performance data has been extracted from XP table in the EverQuest II database housed at National Center for Supercomputing Applications (NCSA) at the University of Illinois. The dataset contains at the min-
Algorithm 2 Perform discretization based on equal-width binning for Players at Level I K (number of buckets) num players[] (array of player numbers at each level) player bucket[][] (array of players with bucket assignment at each level) cumulative play times[][] (array of individual player’s cumulative play times from past P levels) num players inb ucket = num players[I] ÷ K N = 0, curBucket = 1, counter = 0 (temporary variables) Sort Players at Level I by cumulative play time from past P levels in a descending order while N < num players[I] do if counter = num players in bucket then counter = 1 curBucket ← curBucket + 1 end if player bucket[N ][I] = curBucket N ← N + 1, counter ← counter + 1 end while
Algorithm 3 Perform discretization based on histogram analysis for Players at Level I K (number of buckets) num players[] (array of player numbers at each level) player bucket[][] (array of players with bucket assignment at each level) cumulative play times[][] (array of individual player’s cumulative play times from past P levels) N = 0 (temporary variables) Sort Players at Level I by cumulative play time from past P levels in a descending order max play time (max play time at level I) min play time (min play time at level I) segment upper bound[] (array of segment upper bounds) while N < num players[I] do if cumulative play times[N ][I] is within the lower/upper bounds of bucket J then player bucket[N ][I] = J end if N ←N +1 end while
Algorithm 4 MARCEL approach - Calculate Predicted Play Time for Player J at Level I, using buckets K (number of buckets) P (number of previous levels) avg play times[][] (array of average play time at each level in each bucket) for w = 1 to K do T (predicted play time at level I) player play times[][][] (array of individual player play times at each level in each bucket) weights[] (array of weights) A = 0, M = 0, N = I − 1, temp (temporary variables) while N > (I − P ) do − temp = avg play times[N ][w] player play times[J][N ][w] temp = temp × weights[M ] A = A + temp N ←N −1 M ←M +1 end while T = avg play times[I][w] × A end for
Algorithm 5 Regression approach - Calculate Predicted Play Time for Player J at Level I, using buckets K (number of buckets) P (number of previous levels) avg play times[][] (array of average play time at each level in each bucket) for w = 1 to K do T (predicted play time at level I) A = 0, M = 0, N = I − P, temp (temporary variables) level array[], playtime array[] while N < I do playtime array[N ] = avg play times[N ][w] level array[N ] = N N ←N +1 end while Regress(Linear, P olynomial) (retrieve coefficients and intercepts) T = RegressionF unction(LevelI) end for
imum the following information about game players: character id, character sub-class, race, task, timestamp of task completion, group size (whether a given character grouped with one or more other characters), average group level (if a given character played with one or more other characters, this value represents the average of player levels of all players involved in that group), experience points, location (location in which the task was completed).
5.3 Evaluation In prediction (i.e. regression, time series analysis, etc.), a common practice has been to specify coverage probabilities by convention, 90%, 95%, and 99% being typical choices. A previous study [10] reports that academic writers concentrate on 95% intervals while practical forecasters prefer 50% intervals. In this study, we compute prediction coverage at varying confidence intervals at 80% and 90%. Algorithm 6 delineates the steps taken to compute prediction coverage. Algorithm 6 Calculate prediction coverage for all players at Level I K (number of buckets) interval (50%, 80%, 90%, confidence interval) player play times[][][] (array of individual player play times at each level in each bucket) predicted play times[][] (array of predicted play times at each level in each bucket) num players[][] (array of player numbers at each level in each bucket) total coverage = 0 for w = 1 to K do T = predicted play times[I][w] lower bound = T − (T × interval) upper bound = T + (T × interval) N = 0, count in range = 0 (temporary variables) while N < num players[I][w] do if player play times[N ][I][w] >= lower bound AND player play times[N ][I][w]