WRAP and WRAP cannot guarantee the performance of individual products or materials. ... characteristics, and people's views on clothes made to last longer and ... formal wear (47%), clothes for going out and socialising (42%), designer ...... the adult population rate these as 'not important' when purchasing clothing.
Final report
Clothing behaviour research
Behaviours, attitudes and beliefs towards purchasing clothing, alternatives to purchasing, use, re-use and discard of clothes and laundry
Project code: [Add project code] Research date: 7-20 December 2011
ISBN: [Add reference] Date: January 2012
WRAP’s vision is a world without waste, where resources are used sustainably. We work with businesses and individuals to help them reap the benefits of reducing waste, develop sustainable products and use resources in an efficient way. Find out more at www.wrap.org.uk
Written by: Add name of author [Double click to insert image] Document reference: [e.g. WRAP, 2006, Report Name (WRAP Project TYR009-19. Report prepared by…..Banbury, WRAP]
Front cover photography: [Add description or title of image.] WRAP and (Consultants Name) believe the content of this report to be correct as at the date of writing. However, factors such as prices, levels of recycled content and regulatory requirements are subject to change and users of the report should check with their suppliers to confirm the current situation. In addition, care should be taken in using any of the cost information provided as it is based upon numerous project-specific assumptions (such as scale, location, tender context, etc.). The report does not claim to be exhaustive, nor does it claim to cover all relevant products and specifications available on the market. While steps have been taken to ensure accuracy, WRAP cannot accept responsibility or be held liable to any person for any loss or damage arising out of or in connection with this information being inaccurate, incomplete or misleading. It is the responsibility of the potential user of a material or product to consult with the supplier or manufacturer and ascertain whether a particular product will satisfy their specific requirements. The listing or featuring of a particular product or company does not constitute an endorsement by WRAP and WRAP cannot guarantee the performance of individual products or materials. This material is copyrighted. It may be reproduced free of charge subject to the material being accurate and not used in a misleading context. The source of the material must be identified and the copyright status acknowledged. This material must not be used to endorse or used to suggest WRAP’s endorsement of a commercial product or service. For more detail, please refer to WRAP’s Terms & Conditions on its web site: www.wrap.org.uk
Executive summary The purpose of this study was to provide WRAP with quantitative data on attitudes and behaviour of consumers regarding the purchase, use and discard of clothing in order to develop understanding and explore the potential for change. The method used was an online survey. A questionnaire was developed, piloted and distributed throughout the UK using an online access panel. Each section of the survey was completed by 7,950 respondents. Data were weighted to match the population profile for region, age, gender and social profile and tested for statistically significant relationships. The project was undertaken by the Ipsos MORI Environment team with specialist input from Professor Tim Cooper of Nottingham Trent University. Findings from the survey, summarised below, are presented in the report in four sections that address, in turn, purchasing, alternatives to new purchase, current wardrobe (issues relating to use, reuse and discard) and laundry. The survey initially explored the regularity with which people purchase clothing, the importance that they attribute to particular purchasing criteria and their general attitudes and behaviour towards buying clothes. Other purchasing areas addressed included responsibility within households, whether items are checked for certain characteristics, and people’s views on clothes made to last longer and specific fabric types. High street retailers, supermarkets and department stores dominate the clothing market. Most respondents have bought clothes from high street retail stores at least once in the past year (84%). Evidence was also revealed of an extensive second hand market. Over a third have purchased from a charity shop in the past year (35%). Others have purchased from outlets such as eBay and Gumtree (29%) or jumble sales / car boot sales (16%). While nearly all clothes shoppers buy for themselves, nearly one in five are mainly responsible for buying for their spouse, partner or children (19%). The criteria deemed most important when purchasing relate to functional attributes such as value for money, a comfortable fit and the feel of the material, followed by those relating to laundry. Whether an item is of a recognised brand, ethically produced or has a low environmental impact is less important. People’s general attitudes and behaviour were then explored. Many regard buying good quality clothes as a ‘sound investment’ (56%). Few consider shopping for clothing to be one of their main leisure activities (18%) or the latest trends in fashion to influence their purchases (21%). Some consider there to be too little environmental information available (38%), suggesting that they might be open to changing their behaviour. Less positively, well under a half plan their shopping and buy accordingly (44%). More than a quarter buy more than they need (28%) and quality is not always checked, with barely a third ‘usually’ examining seams and stitching before purchasing (36%). Well over a third indicate that they could do more to buy clothes that are ‘made to last’ and would like to do so (38%); over half of those under 35 (51%). Half claim that they already do everything they can (50%), and one in eight could do more but are not interested in doing so (12%). Apart from higher income, factors most likely to change this behaviour are confidence in a brand and provision of a lengthy guarantee. A slight majority consider the environmental impact of cotton to be less than that of polycotton (55%) and most would be at least ‘fairly likely’ to switch from cotton if offered a similar fabric that was better for the environment (79%). The survey next considered some alternatives to purchasing new clothes. Questions were asked about the second hand market, hiring and leasing, and the potential for a retailer ‘buy back’ scheme through which consumers would be able to sell back clothing in good condition to retailers, who would then offer such items for sale at a discount. The types of second hand clothes most likely to be purchased are for daytime leisure or going out and socialising; in each case a majority have bought such items during the past year (58% and 53% respectively). Over six in ten respondents with children have purchased second hand children’s clothing (61%). People are more likely to wear more second hand clothes if there is a better choice (23%), more fashionable items (16%) or a bigger range of sizes (16%). Less than a third are not interested in purchasing second hand clothes (32%).
Clothing behaviour research 1
Few people hire or lease clothes. Formal wear and fancy dress are the only types of clothes that more than one in ten hired during the past year (13% and 11% respectively). In the undeveloped market of leasing, the proportion for all clothing types is two percent or less. However, a majority would consider hiring clothes more frequently if made easier through major high street retailers (51%). Relatively high proportions of people aged 16-24 and women are interested in hiring celebrity or designer dresses or ‘clothes for going out and socialising’. The interest from women is especially linked to being able to wear something they normally could not afford. Interest was rather lower for leasing; around a third of respondents would consider leasing clothes if made easier (32%). Over half of respondents would be at least ‘fairly likely’ to use a retailer ‘buy back’ scheme (53%), Women and people aged 16-34 are especially interested. The types of clothes people most want to be able to sell back are formal wear (47%), clothes for going out and socialising (42%), designer clothing (31%) and winter or summer clothes (28%). In order to assess viability, people were asked what they would expect to receive for returned clothes and whether they would be willing to purchase returned items. Although people typically expect to receive nearly half the purchase price, one in five are willing to accept £10 or less for items that had cost £50 (22%). Crucially, there is interest in buying returned clothes, only a third of respondents would not consider this (32%). The survey then addressed the amount and value of people’s wardrobe contents and, in the case of unworn items, why they were kept. People were asked to identify who they might approach if unworn items required repair or alteration and whether they could undertake such work personally. Questions also explored how clothing was discarded and what, if anything, might encourage people to reduce waste by selling unwanted items or by separating them for reuse or recycling. People typically estimate the clothing that they own to be worth £1,783, the average number of items being 115. Many items had not been worn during the past year (30%). Common explanations were that they no longer fit (57%), ‘wear and tear’ (46%) and because they ‘haven’t got round to throwing them out’ (41%). People aged 16-24 are especially likely to own unworn items that ‘no longer my style/taste’ (58% vs. 36% overall). Many people own at least some clothes that have not been worn because they no longer fit or need altering (80%) or are in disrepair (62%). Factors most likely to make people bring unworn items back into use are a change in weight (64%), being unable to afford new clothes (58%) and ‘if I checked more regularly what I have in my wardrobe’ (53%). Women and older people are more like to have the ability to undertake different types of repair or alteration. Overall, three-quarters are able to sew a button on (74%) and nearly half can darn or patch a hole, or change a hem (47% each). Men are more likely than women to lack an ability to do any repairs (28% of men and eight percent of women). Over half of women and nearly a quarter of men express an interest in learning more about how to repair clothes (52% and 23% respectively). The survey found evidence of good practice with regard to disposal. Many people have donated some items to charity shops during the past year (73%), rather higher than the proportion who have purchased from such shops over the same period. Others have used doorstep collections organised by a charity (42%), or a textiles/clothing bin (37%). Even so, nearly half have put at least some clothing ‘in the bin’ (48%), especially younger people and men, and a few have discarded most of their unwanted clothing in this way (seven percent). Often the item was considered too damaged or dirty to be used again (75%) or ‘too personal’ to get rid of in another way (37%). The most important determinant of whether people would try selling unwanted clothes is the likelihood that they get a ‘reasonable amount’ of money (30%) although around a quarter would do so if they had more spare time (25%). The factor most likely to lead people to give unwanted clothes more often to an organisation which would reuse or recycle them is if they thought that damaged or heavily worn clothing was valuable to such organisations (35%). Asked about getting rid of clothes, nearly a quarter indicate that they could do more to cut back on unnecessary clothing purchases and to repair and maintain clothes and are willing to do so (24%), with higher proportions for women and people aged 16-24. Nearly two-thirds consider that they are already doing everything they can to minimise their contribution to clothing waste (65%), while a small proportion could do more but are not interested in doing so (11%).
Clothing behaviour research 2
The final section of the survey asked what might encourage people to engage in practices such as sorting clothes more often prior to washing, washing clothes less often, washing at a low temperature, using more full loads, tumble drying less often and ironing clothes less often and to identify the behaviours most likely to change. A key initial finding was the influence of gender: two-thirds of women take sole responsibility for washing clothes (66%), whereas only one in four men do (26%), and one in five men never take responsibility for washing clothes (20%), whereas the proportion for women is minimal (three percent). There is evidence of good practice in that most respondents wait for a full load either ‘always’ or ‘more often than not’ (89%) and many wash clothing at 30 degrees or less at least ‘half the time’ (64%) (although 16% ‘mostly’ use a temperature above 40°C). Only a small majority sort their washing according to temperature at least ‘half the time’ (61%), however, and some tumble dryer owners use it in summer at least ‘half the time’ (21%). Ironing is considered important by nearly two-thirds of population (64%), particularly older people. The survey then addressed people’s willingness to change their behaviour and the means by which this might be achieved. In all cases, older people are more likely to express unwillingness to change. Nearly four in ten would ‘seriously consider’ washing items worn only once less often than they currently do (39%), especially young people. The greatest influence is odour; nearly half would do so ‘if my clothes smelt fresher for longer’ (47%). Around a third would seriously consider washing their clothes at 30 degrees more often (34%), the key factor being cleanliness; six in ten would do so ‘if I felt my clothes would be clean’ (59%). More than a third of those who use a tumble dryer would use it less if more clothing was made of fabrics that dry quickly (35%), they had more space to hang clothes (32%) or if energy prices continue to increase (30%). Finally, there are some types of behaviour for which change appears unlikely. Few people are willing to sort washing more often according to temperature (15%) or length of wash (18%). Many of those who do not always sort their clothes by length of wash would not seriously consider changing (44%) and over a third of respondents are unwilling to iron clothes less often (35%). In summary, the survey revealed a range of insights that might enable more sustainable purchasing practices: There is a desire for more environmental information on clothing to be provided People often recognise that they buy more clothes than they need or fail to plan their clothing purchases Many people would like to do more to buy clothes that are made to last. There are opportunities for developing alternatives to the purchase of new clothing: People would buy more second hand clothing if greater variety was available, with better choice, more fashionable items and a bigger range of sizes There is interest in hiring or leasing more clothes if it was made easier, particularly designer dresses and clothes for going out and socialising A retailer ‘buy back’ scheme attracted considerable interest, with people willing to accept a reasonable sum for returned clothes and to purchase such clothes. Many clothes that are unworn could be brought back into use and the amount of binned clothing could be reduced: Clothes are often unworn because they no longer fit or are in disrepair, but also due to people not regularly checking their wardrobes Although many people lack an ability to repair or alter clothing, there is much interest in learning more about how to do so People are willing to separate damaged or heavily worn clothing for reuse or recycling once aware that such items have value. Laundry practices appear in transition, with evidence of good practice but potential for further change: A high proportion of people wash full loads and at low temperatures, although some do not normally sort clothes and use tumble driers in summer Changing the behaviour of older people is likely to prove more difficult The change in which there is most interest is wearing clothes for longer before putting them in the laundry.
Clothing behaviour research 3
Contents 1.0 2.0
3.0
4.0
5.0
Introduction ................................................................................................................................ 5 Purchasing .................................................................................................................................. 6 2.1 Responsibility for buying clothes ...........................................................................................8 2.2 Current purchasing behaviour............................................................................................. 10 2.3 Most recent purchase ........................................................................................................ 12 2.4 Checking the labels ........................................................................................................... 14 2.5 Pre-purchasing information ................................................................................................ 16 2.6 Purchasing attitudes .......................................................................................................... 20 2.6.1 Potentially positive findings .................................................................................... 20 2.6.2 Potentially negative findings................................................................................... 22 2.6.3 Other findings....................................................................................................... 24 2.7 Clothing longevity ............................................................................................................. 26 2.8 Cotton and alternatives ...................................................................................................... 29 Alternatives to new purchase ................................................................................................... 31 3.1 Second hand clothing ........................................................................................................ 33 3.2 Hiring and leasing ............................................................................................................. 37 3.2.1 Current behaviour ................................................................................................. 37 3.2.2 Future behaviour .................................................................................................. 38 3.3 Retailer ‘buy-back’ scheme ................................................................................................. 46 3.3.1 Selling clothing back.............................................................................................. 46 3.3.2 Buying returned clothing ....................................................................................... 51 Current wardrobe – use, reuse and discard ............................................................................. 53 4.1 Value of clothing ............................................................................................................... 55 4.2 Unworn clothing ................................................................................................................ 56 4.3 Repairing clothing ............................................................................................................. 63 4.4 Borrowing clothing ............................................................................................................ 69 4.5 Discarding clothing ............................................................................................................ 70 4.5.1 Current practice .................................................................................................... 70 4.5.2 Future practice ..................................................................................................... 76 Laundry ..................................................................................................................................... 81 5.1 Current practice ................................................................................................................ 83 5.2 Potential for change and drivers ......................................................................................... 92
Appendix 1 .......................................................................................................................................... 106 6.0 Technical details ..................................................................................................................... 106 6.1 Questionnaire design ....................................................................................................... 106 6.1.1 Ensuring the questionnaire was fit for purpose ...................................................... 106 6.1.2 Questionnaire timings and versioning.................................................................... 107 6.1.3 Allowing respondents to give an answer that wasn’t in the questionnaire (coding) .... 107 6.2 Conducting the fieldwork ................................................................................................. 108 6.2.1 Online panels ..................................................................................................... 108 6.2.2 Data quality and validation .................................................................................. 108 6.3 Ensuring that the results are representative of the UK population (weighting) ....................... 109 6.4 Accuracy of reported differences between sub-groups (statistical reliability) ......................... 110 Appendix 2 .......................................................................................................................................... 111 7.0 Copy of the final questionnaire .............................................................................................. 111
Clothing behaviour research 4
11-049455-01 - Clothing report - v6 FINAL - 16 Mar 2012 - INTERNAL USE (1)
1.0
Introduction
The purpose of this study was to provide WRAP with quantitative data on attitudes and behaviour of consumers regarding the purchase, use and discard of clothing in order to develop understanding and explore the potential for change. The method used was an online survey. A questionnaire was developed, piloted and distributed throughout the UK using an online access panel. Each section of the survey was completed by 7,950 respondents. Data were weighted to match the population profile for region, age, gender and social profile and tested for statistically significant relationships. The project was undertaken by the Ipsos MORI Environment team with specialist input from Professor Tim Cooper of Nottingham Trent University. Figures shown in this report concentrate primarily on the UK adult population as a whole. For example, where baby clothes are discussed, this is presented within the charts and opening paragraphs in the context of all UK adults, in order to see the proportion of the population performing certain behaviours, rather than the proportion of people with a baby in the household. Various sub-group analysis is presented below each chart. It has not been possible to include all significant differences, therefore, each question has been analysed and the most relevant and interesting differences included. Findings have been reported only if there is a significant difference at the 95% confidence level. Full data tables are available on request. Where sub-group analysis has been included, correlations between sub-groups have not always been mentioned. For example, those who are responsible for washing clothing in the household may be significantly more likely to exhibit other behaviours, however, this may be due to the larger proportion of women than men who are responsible for this activity. This is also true of various regions, for example, those living in Northern Ireland are more likely to have a child in the household than those living elsewhere in the UK and it may be that fact that is driving their responses, rather than simply where they live. However, these results still hold (e.g. those living in Northern Ireland do buy more children’s clothes overall). Where a sub-group with more than two categories has been compared (e.g. age), comparisons have been made between the two ‘end’ groups (e.g. the youngest – aged 16-24 and oldest age groups – aged 66+) and the terms ‘dropping to’ or ‘rising to’ used. Wherever these terms are used, there is a linear relationship between the categories. Finally, where figures do not sum to 100%, this is due to computer rounding or multiple response answers and an asterisk (*) denotes a figure less than 0.5% but greater than zero.
Clothing behaviour research 5
11-049455-01 - Clothing report - v6 FINAL - 16 Mar 2012 - INTERNAL USE (1)
2.0
Purchasing
People buy clothing from a range of sources and for a variety of reasons. The survey explored the regularity with which people purchase clothing from different sources, the importance that they attribute to particular criteria when buying clothes and their general attitudes and behaviour towards shopping for clothes. Questions were also asked relating to responsibility for clothes purchasing within households, the nature of recent purchases, whether items are checked for certain characteristics prior to purchase, and views on clothes made to last longer and specific fabric types. High street retailers, supermarkets and department stores dominate the clothing market. Over four-fifths of respondents have bought clothes from high street retail stores at least once in the past year (84%) and nearly a quarter at least monthly (23%). People aged 16-24 were especially likely to purchase from high street retailers, with half doing so at least monthly (49%). In addition, many people purchased from supermarkets, especially those aged 25-34, a quarter of whom did so at least monthly (26%). Evidence was revealed of an extensive second hand market. Over a third of respondents have purchased from a charity shop in the past year (35%) and one in twelve do so at least monthly (eight percent); a slight majority have done so on some previous occasion (51%). There is no variation between age groups. In addition, well over a quarter have purchased second hand clothing online in the past year from outlets such as eBay and Gumtree (29%). By contrast, only one in six have bought clothes from jumble sales or car boot sales in the same period (16%). While nearly all clothes shoppers buy for themselves, nearly one in five are mainly responsible for buying clothes for their spouse, partner or children (19%). Criteria for purchasing clothes deemed most important relate to functional attributes such as value for money (82%), a comfortable fit (78%) and the feel of the material (77%). Next important are those relating to laundry, such as being suited to washing at a low temperature (41%). Whether the item is of a recognised brand, ethically produced or has a low environmental impact is considered less important. The criteria ‘made to last and look good for longer’ is more often deemed important than ‘fashionable’ (61% agreed with the former, 46% with the latter). Prior to purchase, the characteristic of items that is checked most often is the fabric (36%). Only a very small proportion of respondents check whether the item has been produced in an ethical way or from materials with a low environmental impact (five percent for both). Responses to a range of statements concerning attitudes and behaviour suggest the extent to which more sustainable clothing practices need to be adopted. On the positive side, more than half of respondents regard buying good quality clothes as a sound investment (56%). Few consider leisure shopping for clothing to be one of their main leisure activities (just 18%) or the latest trends in fashion as influential (21%). Less than a fifth worry about what friends and family think about their clothes (19%). Nearly four in ten consider there to be too little environmental information available, suggesting that they might be open to changing their behaviour (38%). There were also negative findings. For example, well under a half of respondents decide their needs before shopping and buy accordingly (44%), with an even lower proportion for women and people aged 16-24 (35% each). More than a quarter of respondents buy more than they need (28%), over a third for those aged 16-24 (34%). Many people regard buying a new outfit when ‘going out for an occasion’ to be important, including nearly four in ten women (38%), almost half of respondents agree that it is important to have ‘a wide range of clothes to choose from’ when going out (48%), and nearly half report that they ‘get a buzz’ when buying new clothes (45%); such attitudes may (or may not) be indicative of excess. Quality is not always checked; only just over a third ‘usually’ examine seams and stitching before purchasing clothes (36%).
Clothing behaviour research 6
11-049455-01 - Clothing report - v6 FINAL - 16 Mar 2012 - INTERNAL USE (1)
Asked for their views on buying clothes that are ‘made to last and look good for longer’, well over a third indicate that they could do more and would like to do so (38%), with higher proportions for women and people aged under 35 (44% and 51% respectively). Half say that they already do everything they can (50%), and one in eight that they could do more but are not interested in doing so (12%). The factor most likely to change their behaviour in this way is increased income, with more than half of respondents reporting that this would motivate them (57%). Other important factors are confidence in a brand associated with longer lasting products (39%) and the provision of a lengthy guarantee against faults such as fading, unstitching or shrinkage (38%). Lastly, asked to compare the environmental impact of cotton and polycotton, a slight majority of respondents consider the former preferable (55%); those aged over 45 are more likely to do so (59%). Younger people are more inclined to respond that they do not know (39% of those aged 16-34, compared with 29% overall). Around four in five respondents would be at least ‘fairly likely’ to switch away from cotton if an alternative fabric was available that looked, felt and cost the same but was better for the environment (79%). In summary, the survey revealed a range of insights that should be considered in any attempt to encourage more sustainable purchasing practices. For example, although the environmental impact of clothing and ethical criteria do not presently influence the purchasing behaviour of most people to a substantial degree, many people would like more environmental information on clothing to be provided. Second, people often recognise that they buy more clothes than they need, while at the same time many fail to plan their clothing purchases adequately. Finally, a considerable proportion of the population would like to purchase clothes that are ‘made to last’, and brand reputation or lengthier guarantees could encourage them to do so.
Clothing behaviour research 7
11-049455-01 - Clothing report - v6 FINAL - 16 Mar 2012 - INTERNAL USE (1)
2.1
Responsibility for buying clothes
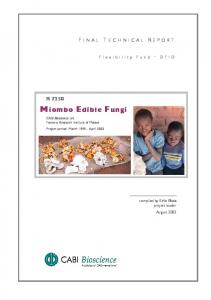
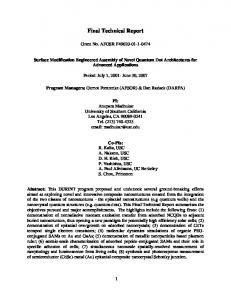
Virtually all adults in the UK have at least some responsibility for buying clothes for members of their household (97% buy for at least one person). This is most likely to be for themselves (90%), their spouse or partner (15%) or for a child (5%). Overall, four in five adults buy clothes only for themselves (78%) and one in five buy them for at least one other person in the household (19%). Figure 1 (Q1)
Who in your household are you mainly responsible for when buying clothes? 90%
Myself
15%
My spouse / partner
5%
My eldest child
3%
My second eldest child Other adults in my household My third eldest child Another child in my household No one
2% 1% *
For at least one person
97%
Only for themselves
78%
For at least one other person
19%
For child(ren)
5%
3%
Base: UK adults (15,900), 7-20 December 2011
Women are more likely to be purchasing clothes than men but only just so; nearly all buy for at least one person (98%), compared to 96% of men. This variation is most evident in the proportions who buy clothes for themselves, with 96% of women doing this vs. 84% of men, and in buying clothes for children (seven percent of women vs. two percent of men). Men are more likely to buy clothes for their spouse or partner (19% vs. 11% of women) and, overall, this makes men more likely to buy for clothes for others (21% vs. 16% of women). The older generation are less likely to buy clothes for themselves, although it is still 87% of those aged 66+ who do so. Those aged 35-44 are the most likely to buy for others (25%), including for children in their household (13%). This reflects the fact that this is the age range where one is most likely to have young children in the household. Along similar lines, those aged 16-24 are least likely to buy for their spouse or partner (six percent), but it must be noted that they are also the least likely age group to have a spouse or partner. Over a quarter of people who have a spouse or partner buy clothes for them (27%). Those living in Northern Ireland buy more clothes for other people than those living in other UK countries (28% vs. 19% UK overall) and this is true both for child(ren) in their household (eight percent vs. five percent) and for their spouse or partner (22% vs. 15%). This is due largely to the fact that those living in Northern Ireland are more likely to have at least one child in the house (37% vs. 25% overall within our survey sample) and are also more likely to be living as part of a couple (70% vs. 63% overall). Those living in London appear to be buying fewer clothes for others (15% vs. 19% in the UK overall) but, again, this could be due to the fact that they are more likely to be single (47% vs. 37% overall) than part of a couple.
Clothing behaviour research 8
11-049455-01 - Clothing report - v6 FINAL - 16 Mar 2012 - INTERNAL USE (1)
Other household factors shape the responses as expected, with those with at least one child (34%), those in households with four or more (32%), and those living as part of a couple (27%) buying more clothing for other people, rather than just for themselves (19% in the UK overall). Income plays a part, with those in households earning under £10k less likely to buy clothes for other people (10%), rising to a quarter among those earning between £55k and £100k (25%). Again, this is, at least partly, due to those having high incomes also being more likely to be part of a couple and to have children. Those earning over £100k buck the trend by being less likely to buy for anyone (95% buy for at least one person); although these people account for fewer than two percent of the population. Household members who are responsible for washing clothes have the most responsibility for buying them as well, especially for themselves. Among those responsible for washing clothes, nearly all (97%) buy for at least one person (vs. 94% of those who are not responsible for washing) and over nine in ten (92%) buy for themselves (vs. 75% of those who are not responsible). They are, however, less likely to buy for others (18% vs. 26%). The same pattern exists among those who are responsible for getting rid of clothes; 98% buy for at least one person vs. 92% of those who are not responsible. Those members of the household who describe themselves as the ‘main earner’ are less likely to buy clothing for other people than those who do not (17% vs. 22%) and are less likely to buy clothes for themselves (90% vs. 92%).
Clothing behaviour research 9
11-049455-01 - Clothing report - v6 FINAL - 16 Mar 2012 - INTERNAL USE (1)
2.2
Current purchasing behaviour
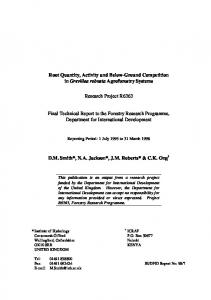
Among those who buy clothes, the most common place for purchasing is in store from a high street retailer; over eight in ten have bought clothes here in the last year (84%) and almost a quarter (23%) have done so at least once a month. Supermarkets come in second with nearly three-quarters having bought clothes here in the last year (73%), closely followed by department stores (68%). Online purchase points are also significant; two-thirds have bought clothes online in the last 12 months (67%), with over half having bought new clothes from an online version of the high street stores (53%) and just under half from other online retailers (46%). Almost a third have bought used items online from a site such as eBay or Gumtree (29%). Over half of UK adults have bought clothes from a charity shop at some point (51%) and over a third have bought something here in the last year (35%). Jumble/car boot sales and vintage clothes shops have both sold clothes to approximately one in seven people in the last year (16% and 15% respectively). Among those who have shopped online or in charity shops in the last year, relatively more shop there monthly, perhaps due to the convenience in the case of online and the opportunity for bargain hunting in charity shops. Figure 2 (Q2)
Thinking about the last 12 months, how often, if at all, have you bought clothes for yourself or someone in your household through each of the following? % Every week
% Every 2-3 weeks
% Once a month
% Every 2 to 3 months
% Every 4 to 6 months
% less often
% Not in last 12 months
% Never
High street clothing retailers in store (e.g. Next, Primark, H&M)
16
Supermarkets
24
16
24
11
19
Department stores (e.g. Debenhams, House of Fraser, John Lewis)
13 8
16
High street clothing retailers online (e.g. Next, Primark, H&M)
13 8
13
Factory outlet stores Online retailers for new items (e.g. ASOS, eBay)
*1 4
9
13 7 9
12 5
7
Charity shops
12 19
8
*13 6
Catalogues (e.g. Freemans, Littlewoods, isme)
* 13 7
8
10
12 4 6
7
9
*12 3 4 7 Vintage clothes shops * 122 3 7
Jumble sales / car boot sales
From a friend or acquaintance
* 12 3 7 *
34 29
12
42
22
12
43
16
14
49
17
53
16
55
10
12 13 12
16
21
12
7 15
17
13
20
Designer clothes stores
Online sites for used items (e.g. eBay, Gumtree)
14
9
11
20
13
7
18
21
11
15
20
15
Outdoor clothing specialists (e.g. Blacks, Millets) *12 4
23
61 72 72 75
Base: UK adults who buy clothes (7,690), 7-20 December 2011
For most types of shopping outlet, women are more likely than men to have purchased clothes at least once a month. For example, high street retailers in store (29% vs. 16%) and high street retailers online (15% vs. nine percent), supermarkets (19% vs. 13%), online retailers for new items (12% vs. eight percent) and online retailers for used items (eight percent vs. five percent), department stores (12% vs. nine percent), charity shops (10% vs. five percent) and jumble sales/car boot sales (three percent vs. two percent). Men, on the other hand, are more likely than women to have bought clothes at least once a month from factory outlets (six percent vs. four percent), designer clothes stores (five percent vs. three percent) and outdoor clothing specialists (three percent vs. two percent).
Clothing behaviour research 10
11-049455-01 - Clothing report - v6 FINAL - 16 Mar 2012 - INTERNAL USE (1)
Patterns by age show that younger people are more likely to have bought clothes in each of the various types of shopping outlet at least once a month, with high street retailers used particularly frequently by the youngest respondents (49% of 16-24 year olds shop in store at least once a month and 28% at least once a month online). This is also the case with online retailers for new (24%) and used items (13%). Those in the 25-34 category use supermarkets to buy clothes more than other age groups, with one-quarter (26%) doing so at least once a month. People from larger households also shop more often at supermarkets, with over four in five of those with four members or more buying from supermarkets at least once in the last 12 months (82% vs. 73% overall). Department stores are particularly popular in Northern Ireland (77% have used them at least once in the last 12 months) and in London (72%). Those with better educational qualifications prefer department stores, with threequarters with FE/HE qualifications buying from these stores in the last 12 months (75%) dropping to just over half of those with no formal education (55%). People living in large households are more likely to buy clothes from the different alternatives given. For example, people living in households with five or more people have bought clothes from catalogues more often than those living in single households, with two-fifths buying things at least once a year (40% vs. 29% overall) and almost one in ten every month (seven percent vs. four percent overall). They are also more likely to buy from designer clothes stores (43% falling to 22% for those living alone) and factory outlet shops (58% falling to 37%). People in one person households and single people are less likely to buy clothes; for example, in department stores where almost seven in ten do so in the UK as a whole, only six in ten of people living alone and single people do this (60% and 61% respectively). People with a higher annual income are more likely to buy clothes from department stores than those with low annual income. Nine in ten of those with an annual income of £100k or more buy clothes from department stores at least once a year, falling to seven in ten for those with an annual income of £20 to £35k (90% falling to 70%). This then falls rapidly to less than six in ten for those with income of £10-£20k (58%) and only just over four in ten for those with an annual income less than £10k (44%). People with a lower annual income are more likely to buy clothes from charity shops and catalogues; almost half of those with incomes less than £10k bought clothes from a charity shop (45% falling to 20% for those earning more than £100k annually) and one in three bought clothes from catalogues (29% falling to 17%). People living in households with children in are more likely to buy clothes, in general, and especially online; seven out of ten buy from high street shops online (69% vs. 53% overall) and six in ten buy from online retailers (59% vs. 43% overall).
Clothing behaviour research 11
11-049455-01 - Clothing report - v6 FINAL - 16 Mar 2012 - INTERNAL USE (1)
2.3
Most recent purchase
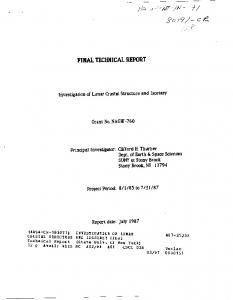
In order to focus the minds of the respondents, each was asked to consider the most recent item which they had purchased for themselves or someone in their household, excluding Christmas presents, footwear and accessories such as hats, gloves, belts, handbags and jewellery. The purpose was to get a practical example for subsequent questions which probe why they bought it and, specifically, whether/how they checked the label before purchase. When asked about the most recent item of clothing they had bought, the most common item identified was a jumper/knitwear (13%) with jeans, trousers, dress, coat and shirt closely behind (seven percent-nine percent). This question has a clear seasonal bias, however, with winter items such as jumpers and coats near the top of the frequency ranking and summer items such as shorts and swimwear near the bottom. Figure 3 (Q3)
Varied items amongst most recent purchases (Q3) What type of item was this? Jumper/Knitwear (e.g. cardigan, sweater) Jeans Trousers Dress Coat Shirt Underwear/lingerie T-shirt/polo shirt Top Baby clothes Jacket (casual) Jacket (waterproof) Nightwear Socks Fleece/bodywarmer Blouse Sportswear Sweatshirt/Hoodie Skirt Leggings Suit Jacket (formal, lounge) Shorts/cropped trousers Swimwear Tie Other Don’t know
13% 9% 8% 7% 7% 7% 6% 5% 5% 4% 4% 3% 3% 3% 2% 2% 2% 2% 2% 1% 1% 1% * * * 1% 3%
Base: UK adults who buy clothes (7,690), 7-20 December 2011
On their last purchase, women more frequently bought jumpers/knitwear then men (17% vs. eight percent), and also baby clothes (six percent vs. three percent). Men more frequently bought jeans (12% vs. seven percent) or trousers (10% vs. five percent). Other, gender specific, clothing purchases were clear, with women buying more dresses (13% vs. one percent) and tops (eight percent vs. one percent) and men buying more shirts (12% vs. two percent). The general trend was for older respondents to be more likely to have purchased a jumper/knitwear (16% of those aged 55-64 bought this item most recently), trousers (15% among those aged 66+), underwear/lingerie (ten percent aged 66+) or shirts (nine percent aged 45-54) than younger respondents. Younger and middle-aged respondents bought more jeans (14% among those aged 35-44), dresses (13% aged 16-24) and baby clothes (11% aged 25-34). By region, coats have been bought more often in Northern Ireland (13%) than elsewhere (seven percent), but there are few regional differences regarding other types of clothing. Those who are employed have bought more ‘smart’ clothing such as shirts and dresses, whilst those not currently in employment are more likely to have purchased jumpers/knitwear, trousers or underwear/lingerie. Clothing behaviour research 12
11-049455-01 - Clothing report - v6 FINAL - 16 Mar 2012 - INTERNAL USE (1)
The main purpose for buying the last item was for everyday use, either in and around the home (38%) or at work (14%), or for going out/socialising (27%). Sports or outdoor wear was the main purpose for almost one in fourteen people (seven percent) and as a ‘gift for someone else’ was mentioned as the main use by the same proportion who had bought it for a special occasion (five percent) (N.B. respondents were asked to exclude items bought as Christmas presents).
Clothes bought mainly for every day use or for socialising (Q5) Figure 4 (Q5) What was the main purpose for which you bought the item? Every day use in and around the home
38% 27%
Going out/socialising
14%
Every day use at work
7%
Sports/outdoor wear Gift for someone else
5%
Special occasion (e.g. wedding, funeral, etc.)
5%
School Other
1% 3%
Base: UK adults who buy clothes (7,690), 7-20 December 2011
Older respondents (aged 66+) are more likely to have bought the item for everyday use in and around the home (44% vs. 38% overall) and also indicate more frequently that their most recent purchase was for sports/outdoor wear (nine percent of those aged 55+ vs. seven percent overall). Every day use at work is more frequently mentioned by people aged 25-54 as the primary reason they made their most recent purchase (18%). Women cite going out/socialising more frequently than men (29% vs. 25%) and special occasions (seven percent vs. four percent). Men, on the other hand, are more likely than women to have bought the item for sports/outdoor wear (nine percent vs. five percent). Within England, respondents from the South East & Anglia and London state that the item was for everyday use at work more often than average (both 16% vs. 14% overall), whilst, in the South West, sports/outdoor wear tended to be purchased more frequently (10% vs. seven percent overall). People with no children were found to have also bought the item for going out/socialising more often than average (28% vs. 23% with no children), as do people with higher value clothes (those who estimate their clothes to be worth £4000-4999, 36% and £5000 or more, 34% falling to those worth less than £500, 22%). Those with higher incomes are more likely to have bought clothing to be used at work (25% earning £100k or more falling to seven percent earning less than £10k) and those earning less more likely to have bought clothing for everyday use in and around the home (48% less than £10k falling to 26% over £100k). Those who perceive themselves to be the main shopper in their household are more likely than people who are not to have bought the item of clothing for going out/socialising (28% vs. 21%), but they are less likely to have bought sports/outdoor wear (six percent vs. 12%).
Clothing behaviour research 13
11-049455-01 - Clothing report - v6 FINAL - 16 Mar 2012 - INTERNAL USE (1)
2.4
Checking the labels
Six in ten checked some key information about the product before they made their most recent purchase (61%); however, this leaves almost four in ten who did not (39%). Among those who did check some information about the garment, the majority were interested in the practical side of the purchase – e.g. just over half checked the type of fabric it was made from (51%), either by looking at and feeling it (36% did this), by reading the label (35%) or a combination of the two. A quarter wanted to know whether the item was ‘dry clean only’ (26%) and one in five the recommended temperature for washing (19%). Little attention was paid to the environmental and ethical impact which manufacturing the item had; just one in twenty either checked whether the item had been made in an ethical way or whether the item was made from materials which have a low impact on the environment (both five percent). Taken together, seven percent checked either one of these environmental factors.
Four in ten don’t check information before purchasing (Q7) Figure 5 (Q7) Did you check any of the following before buying the item? The type of fabric it was made out of, by looking at and feeling
36% 35%
The type of fabric it was made out of, by reading a label
26%
Whether the item was dry clean only The recommended temperature at which to wash the item
19% 11%
The drying instructions (if any)
9%
The ironing instructions (if any) Whether it had spare buttons (if relevant)
6%
Whether the item was made in an ethical way
5%
Whether the item was made from materials which have a low impact on the environment
5%
None of the above
39%
Base: UK adults who buy clothes (7,690), 7-20 December 2011
Respondents aged 55+ are far more likely to have checked their item for each of the aspects, with the exception of the ethical and environmental information, with which they are in line with other age groups. Slightly fewer than three-quarters of those aged 66+ checked at least one of the aspects (73%) and this dropped steadily to just under half of those aged 16-24 (49%). More than two in five men did not check any of the aspects (43%), greater than that of women (36%). Women are more likely to have checked the fabric by looking at it and feeling it (38% vs. 33% of men), investigated if it was dry clean only (30% vs. 21%), checked the recommended temperature the item needs to be washed at (23% vs. 15%) and checked the drying instructions (12% vs. nine percent).
Clothing behaviour research 14
11-049455-01 - Clothing report - v6 FINAL - 16 Mar 2012 - INTERNAL USE (1)
Those living in Northern Ireland are more likely to check the fabric of the item by looking at it and feeling it (47% vs. 36% overall), with those from Greater London the most likely to check the type of material by reading the label (42% vs. 35% overall). Londoners also pay more heed than others to whether the item is dry clean only (30% vs. 26% overall), the ironing instructions (11% vs. nine percent) and whether the garment has any spare buttons (11% vs. eight percent). However, this may be due to the fact that Londoners generally earn more than people in the rest of the country; over one in eight earn between £55k and 100k annually (14% vs. 9% overall), or that a greater majority of those living in London are employed (59% vs. 55% overall). Respondents from North England and Yorkshire tend to be more likely not to have checked anything at all (43% vs. 39% overall), as are people living in Wales (42%). It is those people with the higher value wardrobes who are checking more often; two-thirds whose wardrobe is worth £5k or more check at least one of the aspects (67%), falling to just over half of those worth less than £500 (55%). In terms of other subgroups who did not check any such information, not responsible for getting rid of clothes (50%) or washing clothes (49%), those with no formal education (49%), not the main shopper (49%), those with five or more people in their household (45%), people with at least one child (45%), those owning clothing valued at less than £500 (45%), single people (43%), those with an income of £55,000-99,999 (43%) and those who are employed (42%) are all more likely to fall into this category. Three in five respondents who ‘could do more but are not interested in buying clothes to last’ do not check any of the aspects (58%), along with a similar proportion of people who ‘could do more but are not interested in getting rid of clothes to minimise waste’ (56%).
Clothing behaviour research 15
11-049455-01 - Clothing report - v6 FINAL - 16 Mar 2012 - INTERNAL USE (1)
2.5
Pre-purchasing information
Two further questions were asked regarding pre-purchasing behaviour, one specifically about the last item which the respondent had bought and one about more general purchasing. Responses to both questions were very similar and both sets of results are presented below. The most important feature when purchasing both the most recent item and in general was value for money. A ‘net importance’ score was calculated for each feature (% ‘important’ minus % ‘not important’) and value for money scored +79 for the most recent item and +83 for purchasing in general, clearly a very important feature for most people. Durability of the clothing was more important than fashion with ‘look and feel of the material’ scoring +72 and +73 respectively and ‘made to last and look good for longer’ scoring +59 and +66 but the item being ‘fashionable’ scored only +23 and +30. Choosing a recognised brand was, on balance, considered unimportant scoring -26 and -17, indicating that more people think of it as ‘not important’ than ‘important’. Slightly more thought that it was important for the item to be ‘machine washable at a low temperature’ than thought it not important, scoring +14 and +11. Again, whether the item was ethically produced and whether its manufacture had a low environmental impact were considered to be the least important features. Almost half of the adult population rate these as ‘not important’ when purchasing clothing. Figure 6 (Q6)
How important in hindsight were each of the following when you bought it? Net importance
Level of importance (1 = no importance and 5 = extreme importance) 4 5 1 2 3 % across Value for money
1
2
15
37
44
Look and feel of the material
2
3
18
45
32
+72
Something that you/recipient would wear frequently
3
3
17
42
35
+71
The right fit/provided room to grow
4
3
15
37
41
+71
Made to last and look good for longer
4
5
22
39
29
+79
+59
Fashionable
12
11
31
32
14
Machine washable at a low temperature
14
14
31
27
15
Non-iron
23
17
31
18
10
Quick drying
23
19
32
19
8
Recognised brand
29
20
28
16
7 5
-29
5
-32
Ethically produced
24
22
35
13
Low environmental impact
25
23
35
12
+23 +14 -12 -14 -26
Base: UK adults who buy clothes (7,690), 7-20 December 2011
Women appear to engage more with issues relating to clothing. Thus, in nearly every case, more women than men considered the issue to be important. The exception was ‘recognised brand’, which men think more important than women (minus 21 net importance for men vs. minus 30 for women). The most striking differences are for whether the item is fashionable (plus 38 net importance for women vs. plus eight for men), look and feel of the material (plus 80 vs. plus 64), whether it is machine washable at a low temperature (plus 25 vs. plus one) and whether it is non-iron (minus four vs. minus 20).
Clothing behaviour research 16
11-049455-01 - Clothing report - v6 FINAL - 16 Mar 2012 - INTERNAL USE (1)
People aged 16-24 are more interested in whether the item was fashionable (plus 54 net importance, dropping to plus four for the 66+ age category). Older people are, in general, more interested in whether it was machine washable at a low temperature (plus 23 net importance in the aged 66+ category, dropping to minus five of those aged 16-24), made to last and look good for longer (plus 63 falling to plus 48), non-iron (minus three to minus 25), quick drying (minus two to minus 23) and value for money (plus 81 to plus 70). Northern Ireland show the only significant differences among the regions in the UK, where it is more important that the item was made to last and look good for longer (plus 67 vs. plus 59 in the rest of the UK), of a recognised brand (minus 13 vs. minus 26) and fashionable (plus 50 vs. plus 23). People in the South West, South East and Anglia are not concerned with the item being fashionable, only plus 12 and plus 19 respectively, compared to plus 27 in the Greater London and North and Yorkshire regions. The item being fashionable is more important for larger households, plus 43 net important in five or more person households vs. plus 14 in single households and plus 16 in two person households, and that it was a recognised brand, minus 16 vs. minus 30. That the item was non-iron was much more important for single person households (minus one net importance, compared to minus 23 in four person households, and minus 14 in five or more person households. Income makes a difference to how people respond. Those living in households with higher incomes, £55k to £100k, believe that a recognised brand is more important (minus 20 vs. minus 43 for those with income under £10k), as was the look and feel of the material (plus 78 vs. plus 63) and that the item was fashionable (plus 30 vs. plus eight). For those in a household with income less than £10k a year, value for money scores plus 82 net importance vs. plus 72 for those with a household income between £55000 and £100000. Those with higher incomes also think that quick drying is a more important feature (minus 3 vs. minus 33), being non-iron (plus 2 vs. minus 29), machine washable at lower temperatures (plus 21 vs. minus 2), ethically produced (minus 21 vs. minus 42) and having a low environmental impact (minus 20 vs. minus 50).
Clothing behaviour research 17
11-049455-01 - Clothing report - v6 FINAL - 16 Mar 2012 - INTERNAL USE (1)
Similar features important for general purchases (Q8)
Figure 7 (Q8)
IN GENERAL, how important, if at all, is each of the following to you when deciding which clothes to buy for yourself or others in your household? Level of importance (1 = no importance and 5 = extreme importance) 4 5 1 2 3
Net importance
% across Value for money
1
1
12
39
46
Something that you/recipient would wear frequently
1
2
15
46
35
+78
The right fit/provided room to grow
2
2
14
39
43
+77
Look and feel of the material
2
2
19
47
30
Made to last and look good for longer
3
4
21
43
30
Fashionable
9
10
32
35
14 12
+83
+73 +66 +30 +11
Machine washable at a low temperature
11
15
37
26
Quick drying
17
19
38
19
7
-10
Non-iron
18
19
37
18
8
-11
Recognised brand
22
21
33
19
6
Ethically produced
21
23
38
13
5
-27
Low environmental impact
22
23
39
12
4
-29
-17
Base: UK adults who buy clothes (7,690), 7-20 December 2011
Similarly to Question 6, women are more likely to engage in issues relating to clothes and consider them to be important. The exception is, as above, for ‘recognised brand’, which men think to be more important than women (minus 10 net importance for men vs. minus 23 for women). The most striking differences here is whether the item is machine washable at a low temperature (plus 23 net importance for women vs. minus two for men), whether the item is fashionable (plus 42 for women vs. plus 18 for men) and the look and feel of the material (plus 80 vs. plus 66). People aged 16-24 are more interested in whether the item is fashionable, but not as dramatically different to the older age groups as in Q6 (plus 57 net importance, dropping to plus 15 for those aged 66+). In general, people in the older age groups are more interested in whether the item is machine washable at a low temperature (plus 24 net importance in the 66+ category, dropping to minus 11 among those aged 16-24), made to last and look good for longer (plus 74 falling to plus 50), non-iron (plus four to minus 23), quick drying (plus six to minus 20) and value for money (plus 88 to plus 73). People living in Northern Ireland show the only significant differences among the regions in the UK, where it is more important that the item is made to last and look good for longer (plus 73 vs. plus 66 in the rest of the UK), of a recognised brand (minus one vs. minus 17) and fashionable (plus 62 vs. plus 30). In particular, people in the South West were not concerned with the item being fashionable, plus 17 compared to plus 32 in Greater London and plus 31 in North and Yorkshire, the North West, and the Midlands. The item being fashionable is more important for larger households, plus 54 net important in 5+ person households, falling to plus 22 in two person households and plus 19 in single person households. That the item was non-iron was more important for single person households (minus one net importance, compared to minus 23 in four person households, and minus 13 in five or more person households.
Clothing behaviour research 18
11-049455-01 - Clothing report - v6 FINAL - 16 Mar 2012 - INTERNAL USE (1)
Income is significant in most cases; those with lower incomes are more likely to believe that value for money is important, as are those with a lower valued wardrobe. For those in a household with an annual income less than £10k, value for money scores plus 87 net importance, falling to plus 79 for those with a household income between £55k and £100k. The same goes for quick drying (plus one vs. minus 26), non-iron (minus one vs. minus 23), machine washable at lower temperatures (plus 20 vs. minus one), ethically produced (minus 22 vs. minus 39) and low environmental impact (minus 19 vs. minus 42). Those living in households with higher incomes, £55k to £100k, believe that a recognised brand is more important (minus two vs. minus 41 for those with income under £10k), look and feel of material (plus 79 vs. plus 69) and that the item is fashionable (plus 38 vs. plus 13).
Clothing behaviour research 19
11-049455-01 - Clothing report - v6 FINAL - 16 Mar 2012 - INTERNAL USE (1)
2.6
Purchasing attitudes
2.6.1 Potentially positive findings More than half of UK adults regard buying quality clothing as a sound investment (56% agree with this statement) and relatively few, around one in six, describe shopping for clothes as one of their main leisure activities (18%). Only one in five consider that their decisions are influenced by the latest trends in fashion (21%). Whilst most customers do not currently check the environmental and ethical details of their purchases and, indeed, nearly half rate these factors as not important, nearly four in ten adults believe that there is too little information on the environmental impact of items of clothing available (38%), hinting that they might be interested in reading it if it were available.
Quality clothes seen as a sound investment (Q9)
Figure 8 (Q9)
To what extent do you agree or disagree with the following statements? % Strongly disagree
% Tend to disagree
% Tend to agree
% Strongly agree % Neither % Don’t know
I regard good quality clothes as a sound investment
4 10
There is too little information on the environmental impact of specific items of clothing
7 10
My decisions on which clothes to purchase are influenced by the latest trends in fashion
Shopping for clothes is one of my main leisure activities
25
36
27
25
41
28
17
13 5
16
10
4
29
1
39
5
26
1
20
1
Base: UK adults who buy clothes (7,690), 7-20 December 2011
Women in particular regard good quality clothes as a sound investment (58% vs. 54% of men agree) as do people living in Northern Ireland (67%) or London (60%). They are also seen as a sound investment by higher earners, with almost two-thirds of those earning more than £55k agreeing (63%), compared to half of those earning less than £10k (51%) and by adults who have achieved a higher educational level (61% of those with FE/HE qualifications compared to 48% of those who have no formal education). It is also seen this way by adults with a higher value wardrobe (68% of those worth over £4k in value vs. 46% of those worth less than £500). People who claim to already be doing everything they can to buy clothes that look good and last for longer regard clothing that lasts as a good investment (63% vs. 30% who could do more but are not interested). Over half of those who would like to do more in this regard see good quality clothing as a sound investment (55%).
Clothing behaviour research 20
11-049455-01 - Clothing report - v6 FINAL - 16 Mar 2012 - INTERNAL USE (1)
Over four in ten of those aged 16-34 would like to see more information on the environmental impact of clothing (43%) falling to one-third of people aged 66+ (31%). Over four in ten women would like more information (43%) compared to one third of men (33%). Those in London are more likely to agree that more information is needed (45%). People with a higher level of education would like more information (43% who have FE/HE qualifications vs. 28% with no formal qualifications) and so would those with a more valuable wardrobe (43% of adults with a wardrobe worth £4k or more, falling to 36% worth £500 or less). This is also true of those who are responsible for washing clothes (39% vs. 26%), those responsible for getting rid of clothes (40% vs. 29%) and those who would like to do more to buy clothes that last (45%) and to minimise waste (48%). Those who consider themselves to be the main shopper in the household would like to see more information (39% vs. 33% not main shopper), as would those who are not the main earner (41% vs. 37% main earner) and those who shop for at least one child (44% vs. 38% who shop only for themselves). Fashion is more likely to influence the purchasing behaviour of the young (42% of those aged 16-24 vs. 8% aged 66+), women (25% vs. 16% men) and those living in Northern Ireland (27%) or London (25% vs. 21% average). It also influences those in larger households, a third of those living with at least four other people agreeing that this is the case (33%) falling to one in seven among those living on their own (14%). This is also true of those with at least one child (29% vs. 18% without), single parents (36%) and pregnant women (31%). People with a higher income are more likely to be influenced by fashion, with a third of those earning more than £100k indicating this (32%), falling to one in seven among those earning less than £10k (15%). This is also the case for those who are employed (24% vs. 16% unemployed), are not the main shopper (26% vs. 20% main shopper) and are not the main earner (26% vs. 18% main earner). It is also more prevalent among people with a higher level of education (23% who hold FE/HE qualifications vs. 18% with GCSEs or lower). Those with a more valuable wardrobe are more inclined to buy clothes based on the latest fashion; three in ten of those with a wardrobe value of £5k or more (29%) compared to fewer than a fifth of those with a value of less than £1k (18%). Others influenced by fashion tend to be those responsible for washing clothes (21% vs. 12%), in addition to those who would like to do more to buy clothes that last (25%) and to minimise waste (28%). Shopping for clothes is more of a leisure activity for younger adults and for women; over a third of those aged 16-24 state that it is one of their main leisure activities (37%), dropping through the ages to just one in ten of those aged 66+ (10%). It is a main leisure activity for one quarter of women (24%) compared to one in ten men (10%). This is also more likely to be the case for adults living in Northern Ireland, where a quarter state this to be a main leisure activity (24%). More of those that live in larger households think of it as a main leisure activity, where a quarter of those living with at least four other people think so (26%) falling to one in seven among those who live on their own (15%). It is more common among those with children (22%) than those without (16%) but this is likely to be more to do with their age than the presence of a child. Single parents are the most likely group to say that shopping is a main leisure activity (26%) followed by those who have never been married. Those who have a larger overall value wardrobe are more likely to say this is the case; over a quarter of those with a wardrobe worth £5k or more (27%), compared to one in seven of those whose wardrobe is worth less than £500 (15%). It is more likely to be seen as a main leisure activity by those who are employed (19% vs. 16% unemployed) but it is less likely to be the main earner in the household who thinks this (22% not the main earner vs. 15% main earner). It is also seen this way by those who are responsible for washing clothes (19% vs. 12%) and by those who are not responsible for getting rid of clothes (25% vs. 17%).
Clothing behaviour research 21
11-049455-01 - Clothing report - v6 FINAL - 16 Mar 2012 - INTERNAL USE (1)
2.6.2 Potentially negative findings Over a quarter of the adult population admit to buying more clothes than they need (28% agree) and fewer than half decide what they need before they go shopping for clothes and stick to it (44%). Just over a third usually examine the seams and stitching before they make a purchase (36%) and very few are willing to pay extra for clothing that would have less impact on the environment (13%).
Half buy more clothes than they need (Q9)
Figure 9 (Q9)
To what extent do you agree or disagree with the following statements? % Strongly disagree
% Tend to disagree
% Tend to agree
% Strongly agree % Neither % Don’t know
Before shopping for clothes I decide what I need and stick to it
7
I usually examine the seams and stitching when buying new items of clothing
I buy more clothes than I need
I am willing to pay extra for clothes that have less impact on the environment
11
21
17
21
26
33
11
26
29
21
29
11 2
9
7
28
1
26
1
21
1
39
2
Base: UK adults who buy clothes (7,690), 7-20 December 2011
Men are far less likely to make impulse clothes purchases when out shopping, with over half deciding what items they need before going shopping and sticking to the plan (53%, compared to 35% of women). This is also the case for older respondents, with half of those aged 66+ sticking to their plan (49%), falling to just over a third among those aged 16-24 (35%). Those who are separated but not divorced (52%) and those who are married (46%) are best at sticking to their plan, culminating in almost half of adults identified as being in a couple agreeing that they do this (45%), compared to two in five of those who are single (42%). While we might expect people on lower incomes to be the most rigid, this group are less likely to stick to their original plan when clothes shopping; almost half of those earning less than £10k (48%), compared to four in ten of those earning over £100k (39%). However, those who are not employed are more rigid, with almost half sticking to their plan (46% vs. 42% of employed) and the main earner in the household is also more likely to do this (47% vs. 37% not the main earner). It is also clear that those with the least expensive wardrobes are less likely to stick to their plan, where almost half of those with clothes worth £500 or less agree (48%) falling to just over a third of those with clothes worth £5k or more (37%). The higher educated are also more likely than the lower educated to stick it, with almost half of those who have FE/HE qualifications doing this (46%), falling to four in ten with no qualifications (38%). People who feel they are already doing everything they can to buy clothes to last are more likely to stick to their plan (49%), as are those who already do all they can to minimise clothing waste (47%).
Clothing behaviour research 22
11-049455-01 - Clothing report - v6 FINAL - 16 Mar 2012 - INTERNAL USE (1)
Examining the seams before buying is something that women are more likely to do (40% vs. 32% of men), in addition to those who have a higher level of education (38% with FE/HE qualifications vs. 32% with no formal education) and those who consider themselves the main shopper in the household (37% vs. 24% not the main shopper). This is also something that those with a higher value wardrobe have a greater tendency to do (44% of those worth £4k or more vs. 32% worth £500 or less). Checking seams is also something which is done more often by those who are responsible for washing clothes (37% vs. 27%), those responsible for getting rid of clothes (37% vs. 27%) and those who are already doing everything they can to buy clothes that last (43%) and to minimise waste (38%). The youngest age group (16-24) are the most likely to buy more clothes than they need (34% vs. 28% overall), as are women (36% vs. 20% of men). Those with higher value wardrobes admit to this (49% of those with a value of £4k or more falling to 18% with a value of £500 or less) and those with higher incomes (35% earning £100k or more vs. 24% earning less than £10k). Again, it is the person who is the main earner who is more likely to do this (30% vs. 27% not main earner). Those with no children in their household (29% vs. 26% with children), those responsible for washing clothes (30% vs. 21%) and those who could do more to buy clothes made to last (33%) and to minimise waste (36%) are also more likely to buy more clothes than they need. Younger age groups are more willing to pay extra for clothes that have less impact on the environment. However, this is still a minority of those aged 16-24 (19%) and the proportion decreases steadily to one in ten of those aged 66+ (10%). People living in London (17%), those who have FE/HE qualifications (16%) and those in employment (14%) are more likely than average (13%) to be willing. Those on higher incomes are no more willing to pay extra.
Clothing behaviour research 23
11-049455-01 - Clothing report - v6 FINAL - 16 Mar 2012 - INTERNAL USE (1)
2.6.3 Other findings Almost half of the adult UK population think it is important to have a wide range of clothes to choose from when going out (48%), compared to the one in five (20%) who do not feel it is important. Almost as many admit ‘getting a buzz’ when they buy new clothes for themselves (45%) and three in ten feel that it is important to have a new outfit/item when they are going out for an occasion (29%). Only one in five worry about what their family and friends think of their clothes (19%), compared to over half who do not (54%).
New clothing not essential (Q9)
Figure 10 (Q9)
To what extent do you agree or disagree with the following statements? % Strongly disagree
% Tend to disagree
% Tend to agree
% Strongly agree % Neither % Don’t know
It is important to have a wide range of clothes to choose from when going out
6
I get a buzz when I buy new clothes for myself
9
It is important to have a new outfit/item when going out for an occasion
I worry about what my friends and family think of my clothes
19
25
26
30
14
35
15
32
22
16
12
13
7
3
31
1
29
1
26
1
26
1
Base: UK adults who buy clothes (7,690), 7-20 December 2011
Younger adults and women are especially likely to think it is important to have a wide range of clothes to choose from when going out; almost two-thirds of those aged 16-24 (65%) falling to four in ten of those aged 66+ (40%), and over half of women (55% vs. 40% of men). This is also true of those living in Northern Ireland (56% vs. 48% overall). Adults on higher incomes think that a wide range is important, with almost six in ten of those earning over £100k agreeing (58%) falling to over four in ten among those earning less than £10k (43%). This is also true of those who are employed (50% vs. 46% unemployed) and those who are not the main earner (53% vs. 46% main earner). People with a more valuable wardrobe are also more likely to think it is important (65% among those valued at more than £5k falling to 39% valued at £500 or less). Single people are keen on having a wide range of clothing available, with half saying that this is important (50%) compared to fewer than half who are part of a couple (47%). This feeling is especially strong amongst single parents (54% agree). Those responsible for washing clothes think it is important (48% vs. 39% of those who do not), as do those who would like to do more to buy clothes that last (53%) and to minimise clothing waste (56%). It is younger adults and women who ‘get a buzz’ when buying new clothes; almost two-thirds of those aged 1624 admit this (64%), falling to a third aged 66+ (32%) and over half of women (57% vs. 31% of men). This is also true of those living in Northern Ireland (55%) and London (50%).
Clothing behaviour research 24
11-049455-01 - Clothing report - v6 FINAL - 16 Mar 2012 - INTERNAL USE (1)
This buzz is also felt by people in larger households (52% in households of at least four people) and by pregnant women (59%) and single parents in particular (55%). It is something felt by single people more than those in a couple generally (47% vs. 44%) and also by those with at least one child in their household (50% vs. 43% with no child). Those with a higher household income feel this buzz more than average; half of those earning £55k or more (49%) compared to fewer than half on average (45%), as do those who are employed (47% vs. 42% unemployed). Those who are not the main earners are also more likely to get a buzz from buying clothes for themselves, rather than people who are the main earners (53% vs. 41%), as are people with a higher valued wardrobe; three in five people with a wardrobe valued at over £5k (59%), dropping down to fewer than four in ten of those who own less than £500 worth of clothes (38%). Those with no formal education don’t respond this way to purchasing clothes as much as others (40% vs. 46% of those with a greater level of education). Almost half of those responsible for washing clothes (47%) experience a buzz when buying clothes, compared to just a quarter of those who are not (25%), as do those who would like to do more to buy clothes that last (53%) and to minimise clothing waste (55%). Once more, it is younger adults and women who think it important to have a new outfit/item when going out for an occasion; over four in ten of those aged 16-24 agree (43%) falling to fewer than a fifth of those aged 66+ (18%) and double the amount of women agree than men (38% vs. 19%). Those in Northern Ireland (35%) and in London (32%) are more likely than average (29%) to think this is the case. Those living in larger households also rate this as more important than smaller households; over a third of those living with at least four other people (34%) compared to a quarter who live on their own (24%). This could be due to having a child living there, where a third agree with this statement (35% vs. 27% with no children). Pregnant women (43%) and single parents (37%) are the most common groups to think that this is important. People with a larger value wardrobe think this is more important; four in ten of those worth more than £5k think so (39%), falling to a quarter among those worth £500 or less (25%). Other groups who think it is important include those who are not the main earner (36% vs. 26%), the employed (31% vs. 26% unemployed), those responsible for washing clothes (29% vs. 16%) and those who would like to do more to buy clothes that last (34%) or minimise waste (37%). It is the younger generation and women who are more likely to worry about what their friends and family think of their clothing; almost four in ten of those aged 16-24 worry about this (37%) compared to just over one in ten of those aged 66+ (11%) and over one in five women (22% vs. 15% of men). Those living in the South East of England and Anglia are the most concerned region (21%). People in larger households are more likely to worry (27% with five or more falling to 14% of those living on their own), as are those with children in their household (24% vs. 17% with no children) or pregnant women (25%). Those with four children or more are especially concerned (36%), as are single parents (26%). Those who are not the main shopper (24% vs. 18%) are also more concerned, as are those who are not the main earner (23% vs. 16% main earner), those with a higher income (22% of those earning £35k or more compared to 16% earning less than £20k) and those who are employed (20% vs. 17% unemployed). Respondents who tend to be more concerned include those with a larger wardrobe (23% worth £4k or more vs. 18% £1k or less), those with a higher level of education (20% who have FE/HE qualifications vs. 18% among those who have not), those who would like to do more to buy clothes that last (24%) and could do more to minimise waste (26%).
Clothing behaviour research 25
11-049455-01 - Clothing report - v6 FINAL - 16 Mar 2012 - INTERNAL USE (1)
2.7
Clothing longevity
Exactly half of adults living in the UK believe that they are already doing everything they can to buy items that are made to last (50%), with one in eight admitting that they could do more but are not interested in doing so (12%). This leaves almost four in ten adults who could do more and would like to do so (38%).
Over one-third could do more to buy clothes that and would like to do so (Q10)
Figure 11 (Q10) last longer
Which of the following best describes your view about buying clothes that are made to last and look good for longer? I could do more to buy items that are made to last BUT I am not interested in doing so
12%
50% I could do more to buy items that are made to last AND would like to do so
I already do everything I can to buy items that are made to last
38%
Base: UK adults who buy clothes (7,690), 7-20 December 2011
Older people in the UK consider themselves to be doing the most, with almost two-thirds of those aged 66+ content with what they are doing (63%), falling to a third of those aged 16-24 (32%). However, this younger age group are willing to change, with over half feeling that they could do more and willing to do so (54%). Men consider themselves to be doing more than women, with over half already doing all they can (54% vs. 46% women) but this leaves almost half of women who would be willing to change their behaviour (44%). The two regions most susceptible to change are Northern Ireland (50%) and London (42%). Those in smaller households are more likely to believe that they’re already doing everything they can (55% in single person households compared to 50% average) and those in larger households are more open to change (46% in households of at least three people vs. 38% average). Those who are widowed are most likely to feel that they are doing all they can (63%) and single parents are the most open to doing more (46%). Those households with at least one child are more willing than those without to do more (48% vs. 35%) but pregnant women are even more likely to want to do more (53%). People with a lower income think they are doing as much as they can, with over half of those earning less than £20k thinking this (53%), falling to under half of those earning £55k-£100k (44%). Those earning over £100k are the least interested in doing anything (17% vs. 12% overall). Over half of those who have no formal education feel that they are doing all they can (57%) compared to half overall (50%). Others who feel they could do more include those who are responsible for buying clothes for at least one child (52%) those who are not the main earner in the household (45% vs. 35% main earner), those who are employed (41% vs. 35% unemployed), and those responsible for washing clothes (40% vs. 25% not responsible). Those who wish to do more to minimise their clothing waste are also more likely to want to do more to buy clothes that last (57%).
Clothing behaviour research 26
11-049455-01 - Clothing report - v6 FINAL - 16 Mar 2012 - INTERNAL USE (1)
An increase in income would persuade more than half of the population to invest in clothes that are made to last and look good for longer (57%). However, other factors such as recognising a brand associated with long lasting products or having a lengthy guarantee against faults would each persuade almost four in ten to buy these items (39% and 38% respectively). There was a call for more information to be made available; around three in ten would like to see a ‘durability index’ on the label to allow comparison between garments (32%), more information in general on the clothing, packaging or in store (29%) and a clothing ‘quality mark’ on the label (28%). Almost one in five thought that they would buy clothes which last and look good for longer if they were more aware of environmental problems caused by waste (18%). Only one in ten would change their habits due to being charged directly for the amount of household waste they dispose of (nine percent) while one in eight would not be persuaded by any of these options to buy clothes that Evidence would look good and last for longer (12%). encourage purchasing of clothes
that last longer (Q11)
Figure 12 (Q11)
Which of the following, if any, would result in you buying clothes which last and look good for longer, even if each item were more expensive?
57%
Increase in my income
39% 38% 32% 30% 29% 28%
Confidence in brand associated with long lasting products A lengthy guarantee against faults A ‘durability index’ on label to allow comparison Greater availability of clothing in ‘classic’ designs More info on clothing label, packaging or in store A clothing ‘quality mark’ on the label
18%
Greater awareness of environmental problems caused by waste
9% 6%
Charged directly for amount of household waste Reduction in my income Other None of the above
* 12%
Base: UK adults who buy clothes and don’t already do everything they can to buy clothes that last (3,822), 7-20 December 2011
Women are more likely than men to buy clothes that last and look good for longer if they had an increase in their income; two-thirds of women say this compared to below half of men (65% vs. 47%). Women would also do this if there was a greater availability of ‘classic’ designs (36% vs. 23%), if there was more information on the durability of the item (33% vs. 24%), and if they had greater knowledge on environmental problems caused by clothing waste (21% vs. 13%). Men are more likely not to be convinced to do so by any of the alternatives given (16% vs. eight percent of women). The oldest age group are the least likely to buy clothes which last and look good for longer; one in five of those aged over 65 would not be persuaded by any of the options given (19%), followed by those aged 55-64 and those aged 16-24 (both 14%). Younger respondents are more easily persuaded if they had an increase in their income, peaking at almost two-thirds of those aged 25-34 (64%), and falling to fewer than half of those aged 66+ (43%).
Clothing behaviour research 27
11-049455-01 - Clothing report - v6 FINAL - 16 Mar 2012 - INTERNAL USE (1)
Those with a lower household income are more likely to buy clothes which last and look good for longer if they have an increase in their income (73% among those with an income of less than £10k, falling to 36% among those earning over £100k) but those with a higher income are more likely to consider it if they had confidence in the brand (47% in a household earning £55-99k, falling to 33% in a household earning less than £20k) or if a ‘durability index’ was present (42% earning £55-99k, falling to 29% less than £10k). Overall, most income groups are similar, except in households earning over £100k where people are least interested; almost a quarter would not be convinced by any of these reasons (22% vs. 12% overall). People who are not responsible for washing clothes or getting rid of them are less likely to be interested; a quarter of each would not be persuaded by any of the factors (both 25%), compared to one in ten who are responsible (both 10%).
Clothing behaviour research 28
11-049455-01 - Clothing report - v6 FINAL - 16 Mar 2012 - INTERNAL USE (1)
2.8
Cotton and alternatives
Three in ten adults admit that they don’t know whether cotton or polycotton is better for the environment (29%) and one in ten think that they are about the same (10%). Among those that claim to know, cotton is seen as better than polycotton at a ratio of almost 10:1 (55% think cotton and six percent polycotton). Figure 13 (Q12)
Which of the following fabrics do you consider to be better for the environment?
Don’t know
29%
55% Cotton About the same
10% 6%
Polycotton
Base: UK adults who buy clothes (7,690), 7-20 December 2011
Younger adults are more likely not to know which of cotton or polycotton is better; four in ten of those aged 1624 (40%), falling across the age ranges to just a fifth among those aged 55+ (21%). Those who are single claim less knowledge that those in a couple (32% vs. 28%) but these people are also likely to be younger. Women are more disposed towards cotton (56% vs. 53% of men) as are those who have achieved a higher education level (57% of those who hold FE/HE qualifications think cotton compared to 51% with GCSE level or below). Men think polycotton is better for the environment (seven percent vs. five percent of women) and those with GCSE level or below think that they are about the same (13% vs. nine percent with A-level or above). Two in five people who are not interested in doing more to buy clothing that is made to last and not interested in minimising waste are less likely to know (41% and 40% respectively), with those who are more interested leaning towards cotton (55%).
Clothing behaviour research 29
11-049455-01 - Clothing report - v6 FINAL - 16 Mar 2012 - INTERNAL USE (1)
There would be acceptance of an alternative to cotton that looked, cost and felt the same, with only one in fifty not at all likely to buy such a product (two percent). Two in five would ‘definitely’ be or ‘very likely’ be prepared to buy this alternative (43%); with one in six being ‘definitely’ be prepared to buy these items (16%) and a further quarter think it ‘very likely’ that they would (27%). A further third think it would be ‘fairly likely’ that they would (36%)With one in eight either not knowing or not interested in buying cotton clothing at all (13%), this leaves just six percent saying it is ‘not very likely’. Figure 14 (Q13)
If an alternative fabric to cotton was shown to be better for the environment but looked, felt and cost the same, would you be prepared to buy those alternative clothes rather than cotton? Don’t know Don’t buy cotton clothes (1%) 12% Not at all likely (2%) Not very likely
Definitely
16%
6%
27% Very likely 36% Fairly likely
Base: UK adults who buy clothes (7,690), 7-20 December 2011
Women would be more open to buying an alternative fabric to cotton, with almost half either ‘definitely’ or ‘very likely’ to buy it (49% vs. 37% of men), as would those in the younger age groups, with almost half of those aged 44 or less either ‘definitely’ or ‘very likely’ to buy it (46% vs. 41% of those aged 45+). Those living in Wales are more likely to buy it than those in England (47% vs. 43%). Those in the larger households also feel that they are more disposed to buying these alternatives to cotton, with almost half of those living in a household with four or more people either ‘definitely’ or ‘very likely’ to buy it (48% vs. 41% of those living on their own). Those with at least one child hold similar feelings (47% vs. 42% of those with no children) and this rises to almost half among those who actually buy for their children (49%). Those responsible for washing clothes are more likely to buy these alternatives (44% vs. 27% who aren’t responsible for washing), as are those who get rid of clothes from their household (45% vs. 35%). This is also true of those who would like to do more to buy clothes that last (48% vs. 31% of those who are not interested in doing so) and those who would like to do more to minimise waste when getting rid of clothes (49% vs. 28% of those who are not interested).
Clothing behaviour research 30
11-049455-01 - Clothing report - v6 FINAL - 16 Mar 2012 - INTERNAL USE (1)
3.0
Alternatives to new purchase
The survey next considered several alternatives to purchasing new clothes. Questions were asked about the second hand market, the hiring and leasing of clothing, and the potential for a retailer ‘buy back’ scheme through which consumers would be able to sell back clothing in good condition to high street and online retailers, who would then offer such items for sale at a discount. Many people buy second hand clothes, particularly from charity shops and online (as revealed in the previous section). The types of second hand items most likely to be purchased are clothes for daytime leisure or clothes for going out and socialising; in each case a majority of respondents have bought such items during the past year (58% and 53% respectively). Over six in ten respondents with children have purchased second hand children’s clothing (61%), while nearly seven in ten of those with children aged up to three have purchased second hand baby clothes (69%). Most responses to what would result in people wearing more second hand clothes relate to the range available. Nearly one in four respondents selected ‘if there was a better choice of clothes available’ (23%), around one in six ‘if more fashionable items were available’ (16%) and a similar proportion ‘if there was a bigger range of sizes available’ (16%). Conditions in the shop, such as cleanliness and freedom from clutter, are important to one in six respondents (17%). Fewer than a third are ‘not interested in purchasing second hand clothes at all’ (32%); the proportion for men rises to over two in five (42%). The proportion of people who have hired or leased clothes over the past year, whether for themselves or another family member, is very low. Hire was defined as ‘short term rental from one night up to a few weeks’, while lease was ‘different from hiring in that it involves longer term rental (typically one to six months)’. In the case of hire, formal wear and fancy dress are the only types of clothing that more than one in ten respondents have hired during the past year (13% and 11% respectively). In the undeveloped market of leasing, the proportion for all clothing types is two percent or less. Around half of respondents would consider hiring clothes more frequently if made easier through major high street retailers (51%). In established markets, four in ten reply positively for formal wear (40%) and just over one quarter for fancy dress (27%). Relatively high proportions of people aged 16-24 (27%) and women (26%) are interested in hiring celebrity or designer dresses, compared with the overall proportion (17%) and similarly for ‘clothes for going out and socialising’ (17% for women and 19% for people aged 16-24 compared with 13% overall). The interest from women is especially linked to special occasions (83% of women vs. 81% overall) and being ‘able to wear something I normally couldn’t afford’ (65% of women vs. 55% overall). Around a third of respondents overall want to avoid having unused clothes in their wardrobe (35%) or to reduce their overall spending on clothes (31%). Interest was rather lower for leasing; around a third of respondents would consider leasing clothes if made easier (32%). For example, just under one in five would consider leasing formal wear (19%) and one in six women are interested in leasing designer clothing (16%). Similar motivations were expressed, the main difference being that people aged 45-65 are especially attracted by the prospect of being able to wear something which they would not normally be able to afford (52% vs. 45% overall). Nearly two in five people would only consider leasing new items (38%). Over half of respondents replied that if a retailer ‘buy back’ scheme was introduced near them they would be at least ‘fairly likely’ to use it (53%), with less than one in ten replying that they would ‘never do this’ (nine percent). Women and people aged 16-34 are especially interested (62% and 66% respectively at least ‘fairly likely’). The type of clothes people most want to be able to sell back is formal wear (47%), but more than four in ten cite clothes for going out and socialising (42%), around three in ten would want to sell back designer clothing and a similar proportion winter or summer clothes (31% and 28% respectively). People also express interest in selling back clothes for daytime leisure, work and sporting or outdoor activities (24%, 19% and 19% respectively).
Clothing behaviour research 31
11-049455-01 - Clothing report - v6 FINAL - 16 Mar 2012 - INTERNAL USE (1)
In order to assess the viability of such a scheme, people were asked to suggest the minimum amount they would expect to receive for returned clothes and to identify which types of returned items, if any, they would be willing to purchase at a discount. The responses indicated that people would typically expect to receive nearly half of the purchase price. In the case of items that had originally cost £15, the amount expected was around £6. If the item cost £50 the amount expected was around £21.50, and if it had cost £100, around £45. Around one in five respondents, however, were willing to accept rather less; over one in five would accept £10 or less for items that had cost £50 (22%) and a similar proportion that they would accept £25 or less for items that had cost £100 (21%). Crucially, there was interest in buying returned clothes; fewer than a third of respondents would not consider this (32%). Buying returned formal wear was attractive to over four in ten (42%). More than a third would consider buying ‘clothes for going out and socialising’ (34%) and a similar proportion ‘designer clothing’ (34%); in the case of the latter, this proportion was even higher than that for selling (31%). For other types of clothing - winter or summer clothes and clothes for daytime leisure, work or sporting or outdoor activities – at least one in five respondents were interested in buying returned items (20%-26%). In summary, there appear to be opportunities for developing alternatives to the purchase of new clothing. Many people would be more likely to buy second hand clothing if a greater variety was available, with better choice, more fashionable items and a bigger range of sizes. There is also interest in hiring or leasing more clothes if such practices were to be made easier, particularly designer dresses and clothes for going out and socialising. Finally, the possibility of a retailer ‘buy back’ scheme attracted considerable interest, especially with regard to clothes for going out and socialising, designer clothing and seasonal clothing. People appear willing to accept a reasonable sum for returned clothes and many expressed interest in purchasing discounted returned clothes through such a scheme.
Clothing behaviour research 32
11-049455-01 - Clothing report - v6 FINAL - 16 Mar 2012 - INTERNAL USE (1)
3.1
Second hand clothing
Over two-thirds of all UK adults have bought or received at least one item of clothing second hand in the last 12 months. The majority of adults in the UK have bought or received them for daytime leisure (58%) and for going out and socialising (53%) in the last year. Fewer than half have bought or received second hand clothes for work (40%), sport or outdoor wear (32%), formal wear (32%), designer clothing (30%) and fancy dress (23%). While seen over the whole of the population, the proportion of people having bought or received clothes for children may seem low, when controlling for those who do not have any children, the figure rises markedly, as discussed in more detail below. Figure 15 (Q14)
Majority have bought orhow received Thinking about the last 12 months, often havesecond you boughthand or received the clothes in of last year (Q14) or others in your household second hand? following types clothes for yourself
% Every week
% Every 2-3 weeks
% Once a month
% Every 2 to 3 months
% Every 4 to 6 months
% less often
% Not in last 12 months
% No children
Clothes for daytime leisure
Clothes for going out and socialising
Clothes for work Clothes for sporting or outdoor activities (e.g. ski wear)
13
9
17
*2 7 *2 5
13
16
10
* 12 6
11
8
* 13 7 * Designer clothing *1 3 5 7
Other children’s wear
School wear
Baby clothes
Maternity wear
* 12 5 *
* 12 212 * 11 5 * 1
42
15
47
12
60
14
10 14 16 92
53% 40%
32%
68
32%
70
15
58%
68
21
*13 5 3 3 * 13 4 2 *
12
15
Formal wear (e.g. weddings, evening wear, etc.)
Fancy dress
17
At least once in 12 months
30%
77
23%
75
15%
75
11%
75
9%
8%
Base: UK adults who buy clothes (7,708), 7-20 December 2011
Over two-thirds of people with a child between 0-3 years old in their household have bought or received second hand baby clothes in the last twelve months (69%). School wear has been bought or received second hand by almost six in ten adults with a child aged 4-9 in their household and by almost half of those with a child aged 1015 (47%). Overall, three in five people with children in their household have bought or received other types of second hand clothes for children in the last twelve months (61%), with almost one in five doing so at least once a month (18%). Women are, in general, more likely to buy or receive second hand clothes, with the exception of sportswear. For example, over three in five have bought or received second hand clothes for daytime leisure in the last twelve months (62%) compared to just over half of men (54%). People aged between 16 and 24 are more likely to buy or receive every type of second hand clothes for themselves or others in their household than any other age group, apart from children’s and baby clothes where the 25-44 age group dominate. For example, approaching seven in ten 16-24 year olds have bought or received second hand clothes for daytime leisure in the last twelve months (69%), dropping for each older age group to just over half of 55-65 year olds (53%) and to less than half for those aged 66+ (46%).
Clothing behaviour research 33
11-049455-01 - Clothing report - v6 FINAL - 16 Mar 2012 - INTERNAL USE (1)
The regional differences are generally small, apart from those living in Northern Ireland buying or receiving significantly more baby clothes (18% vs. nine percent UK overall), school wear (21% vs. 11% UK overall), and other children’s wear (26% vs. 15% UK overall) than the rest of the UK. This is largely due to the fact that the Northern Irish households are more likely to have at least one child (37% vs. 25% UK overall). Larger households are, in general, more likely to buy or receive second hand clothes. This is especially true of baby clothes, with a quarter of households with five or people buying or receiving second hand baby clothes in the last 12 months (25%) compared to one hundredth of those living in a two person household (one percent). Because of the increased likelihood of children in these households, this is also true for other children’s clothes, with over two in five people in households with five or more people buying second hand children’s clothes (44%) compared to just one in fifty people in a two person household (two percent). Single parents, single people, and unmarried couples are also more likely to purchase or receive second hand clothes; for example, around twothirds of single people (63%) and unmarried couples (67%) have bought or received second hand clothes for daytime leisure, compared to just over half of married couples (55%), and the population overall (58%). Income matters in some categories. Those with higher incomes buy or receive more second hand clothes than those with lower incomes in all categories, apart from clothes for going out and socialising, and clothes for daytime leisure, where there are no significant differences between the income groups; for example, over half in the highest income group will buy or receive second hand clothes for work at least once a year (51%, earning above £100K annually), falling to a third of those earning less than £20k annually (36%). Household members who could do more to minimise waste when getting rid of clothes to and would like to do so are more likely to buy or receive second hand clothes; seven in ten of people in this category have bought or received second hand clothes for daytime leisure in the last twelve months (70%), compared to less than six in ten overall (58%). People describing themselves as the main shopper of the household are more likely to have bought or received second hand clothes in the last twelve months. For example, four in ten have bought clothes for work (41% vs. 34% for those who aren’t the main shopper), one in six children’s clothes (16% vs. 8%), and over half clothes for going out and socialising (53% vs. 47%).
Clothing behaviour research 34
11-049455-01 - Clothing report - v6 FINAL - 16 Mar 2012 - INTERNAL USE (1)
A better choice of second hand clothes (23%) and a better shop experience (17%) would encourage people to wear more second hand clothes. People would also be encouraged by the availability of more fashionable items, the availability of a greater range of sizes, and by a lower price (16% each). However, one in three aren’t interested in buying second hand clothes at all (32%), one in ten are not interested in buying more second hand clothes than they currently do (10%), and one in fourteen already buy many or all of their clothes second hand and thus wouldn’t be encouraged to wear more by any of the alternatives offered (seven percent). Just over one in ten would consider wearing more second hand clothes if they could buy them from a high street retailer (13%) and if they could buy the brands that they trust (12%). A similar proportion would be persuaded if they felt it was ‘the right thing to do’ (12%) or if a guarantee against faults was provided (nine percent).
Better shopping experience and more choice would encourage second hand buying (Q15) Figure 16 (Q15) Which of the following, if any, would result in you wearing more second hand clothes? 23%
If there was a better choice of clothes available
17% 16% 16% 16% 13% 12% 12%
If I had a better shop experience If more fashionable items were available If there was a bigger range of sizes available If prices were cheaper If I could buy them from a leading high street retailer If I could buy the brands I trust If I felt it was the right thing to do
9%
If a guarantee against faults was provided If styles were not so subject to changes in fashion If I was aware of other people I know doing this Other
4% 3% 1%
Nothing, I already buy many/all of my clothes second hand Nothing, I’m not interested in purchasing more second hand clothes Nothing, I’m not interested in second hand clothes at all
7% 10% 32%
Base: UK adults who buy clothes (7,708), 7-20 December 2011
While one in ten women claim that they already buy most or all of their clothes second hand (10%), only one in twenty men do so (five percent) and two in five men are not interested in purchasing second hand clothes at all (42%), compared to less than one in four women (23%). Women are generally more likely to be encouraged to wear more second hand clothes. For example, if there was a better choice available, almost three in ten women would wear more second hand clothes (29% vs. 17% of men) and if shopping for second hand clothes was a better experience, over a fifth of women would be encouraged to wear more second hand clothes (22% vs. 12% of men). Men are only significantly more interested in second hand clothes than women when it comes to them feeling that it was the right thing to do, in which case over one in ten men would wear more second hand clothes (13%), compared to exactly one in ten women (10%). Older people are less likely to be encouraged to wear more second hand clothes. Only one in five 55-65 year olds (20%) and three in twenty 66+ (15%) would wear more second hand clothes if there was a better choice of clothes available, compared to three in ten 16-24 year olds (29%) and almost a quarter overall (23%). Only if older people felt it was the right thing to do would they wear more second hand clothes than the younger generation (13% of 55+ vs. 11% of 16-24 year olds and 12% overall). People living in Northern Ireland are generally more likely to be encouraged to wear more second hand clothes compared to the rest of the UK. For example, a third of people in Northern Ireland would wear more second hand clothes if there was a better choice of clothes available (32%), compared to less than a quarter in the rest of the UK (23%).
Clothing behaviour research 35
11-049455-01 - Clothing report - v6 FINAL - 16 Mar 2012 - INTERNAL USE (1)
People living in larger households are also more likely to be encouraged to wear more second hand clothes; a fifth of those living in a household with four or more people would be encouraged to buy more second hand items if there were more fashionable items available (20%) compared to just over one in ten of those in a single person household (13%). People who aren’t main shoppers are less likely to be encouraged to buy second hand clothes, almost half saying that they aren’t interested in purchasing second hand clothes at all (47%), as are main earners; of whom more than a third are not interested in buying second hand clothes (34%). A fifth of people with annual incomes higher than £55k say that having a better shopping experience would encourage them to wear more second hand clothing (20% vs. 17% overall) but this group is less likely to be interested in wearing second hand clothes at all, with over a third saying they are not interested (36% vs. 32% overall). For people on annual incomes lower than £10k, price is a deciding factor when it comes to second hand clothes; one in five would wear more second hand clothes if they were cheaper (22% vs. 16% overall). This group is also generally more likely to be interested in purchasing second hand clothes, with less than a quarter answering that they are not interested in purchasing second hand clothes at all (24% vs. 32% overall). More educated people are more keen on wearing more second hand clothes; two in five of people without any qualifications aren’t interested in purchasing second hand clothes at all (39% vs. 32% overall). People who could do more to buy clothes made to last and would like to do so are more likely to buy second hand clothes; almost three in ten would be encouraged if there was a better choice of clothes available (28% vs. 23% overall). People who could do more to minimise waste when getting rid of clothes and would like to do so are also more likely to buy second hand clothes; a third being encouraged if there was a better choice of clothes available (34% vs. 23% overall).
Clothing behaviour research 36
11-049455-01 - Clothing report - v6 FINAL - 16 Mar 2012 - INTERNAL USE (1)
3.2
Hiring and leasing
3.2.1 Current behaviour The majority of adults in the UK have not hired clothes in the last 12 months and very few have leased them. While over one in ten have hired formal wear (13%) and fancy dress (11%) in the last year, fewer than one in ten have hired other types of clothes. One in fifty or fewer have leased any of the types of clothes on the list. Figure 17 (Q16 and Q18a)
Few have hired clothes in last year, very few have leasedabout (Q16 Thinking theand last 12Q18a) months, how often have you hired the following types of clothes for yourself or others in your household?
% Every week
% Every 2-3 weeks
% Once a month
% Every 2 to 3 months
% Every 4 to 6 months
% less often
% Never
% No children
Formal wear (e.g. weddings, evening wear, etc.)
* 112 9 * Fancy dress * 111 8 * * Clothes for going out and socialising 1212 * * Winter or summer clothes 12 2 2 * Clothes for sporting or outdoor * activities (e.g. ski wear) * 111 3 * Clothes for daytime leisure 11211 * 1211 * * Designer clothing 1112 * * Maternity wear 11* 1 * Other children's wear * 111 * * * School wear *11* * * Baby clothes * 1 * **
87
2%
89
Clothes for work
Leased in last 12 months
2%
93
1%
93
1%
93
1%
93
1%
94
1%
94
1%
97
*
22
75
*
23
75
*
23
75
*
Base: UK adults (7,950), 7-20 December 2011
Men are more likely than women to have leased clothes in the last twelve months; most women haven’t leased any clothes in the last twelve months (96%), compared to just over nine out of ten men (92%). Almost a fifth of men have hired formal wear in the last twelve months compared to just one in ten women (18% vs. 10%). Younger people are more likely to have hired clothes in the last twelve months. Around one in five 16-24 year olds have hired formal wear in the last twelve months (22%), falling to just one in twenty of those aged 66 and over (six percent). Similarly, one in five 16-24 year olds have hired fancy dress (18%) falling to less than one in twenty of those aged 66 and over (four percent). People living in Northern Ireland have hired substantially more clothes in the last twelve months than the rest of the UK. Almost a quarter have hired formal wear at least once in the last twelve months (24% vs. 13% UK overall) and almost a fifth have hired fancy dress (18% vs. 11% overall). Similarly, people living in Greater London have hired clothes more often than people in the rest of the UK; three in twenty have hired formal wear (17%) and fancy dress (15%) in the last year.
Clothing behaviour research 37
11-049455-01 - Clothing report - v6 FINAL - 16 Mar 2012 - INTERNAL USE (1)
3.2.2 Future behaviour Around half of respondents indicate that they would consider hiring clothes more frequently if made easier through major high street retailers (51%). Four in ten would consider hiring formal wear on a more frequent basis (40%) and over a quarter would consider hiring fancy dress (27%). Fewer people would be prepared to hire celebrity/designer dresses more often (17%), clothes for going out and socialising (13%), and clothes for sport (10%). Over one in ten would still not hire on a more frequent basis (13%) and over a third would never consider hiring clothes (36%). Figure 18 (Q17a)
It has been suggested that it should be made easier to hire all types of clothes through the major high street retailers. If this was the case which, if any, of the following types of clothing might you consider hiring on a more frequent basis? Formal wear
40%
Fancy dress
27%
Celebrity/designer dresses
17%
Clothes for going out and socialising
13%
Clothes for sporting or outdoor activities
10%
Winter or summer clothes
4%
Maternity wear
4%
Clothes for work Clothes for daytime leisure
3% 2%
School wear
1%
Baby clothes
1%
Other children’s wear
1%
None/no more than do now None/would never consider it
13% 36%
Base: UK adults (7,950), 7-20 December 2011
Almost two in five men say they would never consider hiring clothes (37%) compared to a third of women (34%). Women are more willing than men to consider hiring more often if it is made easier; for example, almost half would consider hiring formal wear more frequently (45% vs. 34% of men). Younger people are more likely to be positive towards hiring clothes on a more frequent basis. Over two in five 16-24 year olds would hire formal wear more often (44%) and over a third would hire fancy dress more frequently (34%), compared to only one in three and one in ten respectively among those aged 66 and over (30% and 11%). People in Northern Ireland are more likely to consider hiring on a more frequent basis than the rest of the UK, with over half stating they would hire formal wear more often if it was made easier (56%), compared to four in ten overall (40%). People in England and Wales are significantly more likely to never consider hiring clothes; over a third would never hire clothes (36%) compared to one in three in Scotland (31%) and less than a quarter living in Northern Ireland (24%).
Clothing behaviour research 38
11-049455-01 - Clothing report - v6 FINAL - 16 Mar 2012 - INTERNAL USE (1)
People living in larger households are more likely to consider hiring clothes on a more frequent basis. Of those living in households with five or more people, just under half would consider hiring formal wear (46%) compared to two in five overall (40%), and over a quarter would hire designer dresses more frequently (26%) compared to three in twenty overall (17%). While four in ten of those in single-person and two person households would never consider hiring clothes (40% and 39% respectively), only three in ten of those in four-person households would never consider it (29%). Households with larger incomes are more inclined to consider hiring clothes more clothes in the future, while those with lower incomes are less likely to ever consider hiring clothes as an option; almost a quarter of those earning over £100k annually would never consider hiring clothes (23%), rising to almost half of those earning less than £10k (45%). Households with children are more likely to consider it, where almost three in ten people with children would never hire clothes (28%) compared to nearly four in ten without children (38%). This is especially true for those who are responsible for buying clothes for children, a quarter of whom would hire clothes for going out and socialising (24% vs. 13% overall), and over one in ten would hire maternity wear (13% vs. just four percent overall). Those who would like to do more to buy clothes that are made to last, and also to minimise waste when getting rid of clothes, are more positive towards hiring clothes; around half would consider hiring formal wear (45% and 56% respectively vs. 40% overall). People responsible for washing clothes and those responsible for getting rid of clothes are both less likely to say that they would consider hiring clothes more frequently; a third never would (33% and 32% respectively), while more than two in five of those who are not responsible say this (43% and 45% respectively).
Clothing behaviour research 39
11-049455-01 - Clothing report - v6 FINAL - 16 Mar 2012 - INTERNAL USE (1)
Approaching one in five people would consider leasing formal wear if it was made easier (19%), and around one in ten would consider leasing fancy dress or designer clothing (11%). However, three in five people would never consider leasing clothes (60%) and a further seven percent would not consider it if it was made easier.
One-third would consider leasing, mostly for formal wear (Q18b) Figure 19 (Q18b)
And which, if any, of the following types of clothing might you consider leasing if it was made easier? Formal wear
19%
Fancy dress
11%
Designer clothing
11%
Clothes for going out and socialising
8%
Clothes for sporting or outdoor activities
6%
Maternity wear
3%
Winter or summer clothes
3%
Clothes for work
3%
Clothes for daytime leisure
1%
School wear
1%
Baby clothes
1%
Other children's wear
1%
None/no more than do now None/would never consider it
7% 60%
Base: UK adults (7,950), 7-20 December 2011
Women are more likely to consider leasing clothes than men; a fifth would consider leasing formal wear (22%) compared to one in six men (16%) and over one in ten would consider leasing fancy dress (13% vs. nine percent of men). Men are less likely to consider leasing clothes, with over three in five men saying they wouldn’t consider it (64%) compared to just over half of women (57%). Younger people are more likely to consider leasing clothes if it was made easier. More than a fifth of those in the 16-24 age group would be willing to lease formal wear (21%), compared to only just over one in ten of those in the 66+ group (13%), and three in twenty young people would be willing to lease fancy dress (15%) compared to just one in twenty of those in the 66+ category (four percent). People in Northern Ireland are more likely to consider leasing clothes, with three in ten saying they would hire formal wear (30%) and almost two in ten designer clothing (17%), compared to two in ten and one in ten respectively for the whole of the UK (19% and 11%). People living in Greater London are also more likely to consider it; almost three in twenty would consider leasing fancy dress (14% vs. 11% UK overall) or designer clothing (14% vs. 11%). Larger households are more likely to consider leasing clothes, a quarter of households with five or more people would consider leasing formal wear (24%), while only one in six single person households would (16%), and one in five people overall (19%). People who have never married and unmarried couples, are more likely to consider leasing clothes than others, such as married couples and divorced people; almost one in five unmarried couples (17%) and one in eight single people (13%) would consider leasing designer clothing, compared to one in ten overall (11%). Respondents with children in their household are more likely to consider leasing clothes, nearly a quarter would lease formal wear (23%) and almost one in ten would lease maternity wear (eight percent), compared to a fifth and less than one in twenty overall (19% and three percent respectively).
Clothing behaviour research 40
11-049455-01 - Clothing report - v6 FINAL - 16 Mar 2012 - INTERNAL USE (1)
More educated people would consider leasing on a more regular basis than those who have no qualifications; over half of those who hold FE/HE qualifications would not consider leasing (56%) compared to over two-thirds of those without any qualifications (68%). Two in three unemployed people would never consider leasing clothes (67%), while half of unemployed people said the same (55%). People responsible for washing clothes are more likely to consider leasing clothes; a fifth would consider leasing formal wear (20%) compared to just one in ten who are not responsible (10%). Those who could do more to buy clothes that last and to minimise waste when getting rid of clothes and would like to do so are more likely to consider leasing clothes; around a quarter would lease formal wear (23% and 27% respectively) compared to a fifth overall (19%).
Clothing behaviour research 41
11-049455-01 - Clothing report - v6 FINAL - 16 Mar 2012 - INTERNAL USE (1)
Among those willing to consider hiring clothes more often, the greatest motivation is to wear it for a special occasion or as a ‘one-off’ (81%), or to be able to wear something that one could not usually afford (55%). Hiring mostly seen as a ‘one off’ and to Around a third of people would hire to avoid having a wardrobe full of clothes thatwear they don’t wear (35%) or to reducesomething the overall amount unaffordable they spend on clothes (31%). (Q17b) Figure 20 (Q17b)
Why might you consider hiring an item of clothing? For a special occasion/as a ‘one off’
81%
To be able to wear something I normally couldn’t afford
55%
Avoid ending up with wardrobe full of clothes that I don’t wear
35% 31%
Reduce overall amount of money I spend on clothes Reduce risk of having items I dislike after wearing a few times
18% 11%
Greater choice / variety in my wardrobe
9%
To keep up with the latest fashion To avoid having lots of nearly-new clothes which my child / baby has grown out of Other None of the above
3% * 1%
Base: UK adults who would consider hiring clothes more frequently (4,102), 7-20 December 2011
Women are more likely than men to consider hiring items of clothing for many of these reasons. For example, over four in five women who would consider hiring clothes more frequently would do so for a special occasion (83%) compared to around three in four men (78%), and over six in ten women to hire something they could not normally afford (65%) compared to four in ten men (41%). Older people would consider hiring more often than younger people as a ‘one-off’ for a special occasion; over eight in ten of those aged over 65 who would consider hiring more frequently (85%) compared to seven in ten aged 16-24 (70%), and to avoid ending up with a wardrobe full of clothes they don’t wear; four in ten of 55-56 year olds (41%) would be encouraged by this contrasted to a third of 25-34 year olds (34%). Younger people, on the other hand, would consider hiring more often than older people in all other categories, for example, to keep up with the latest fashion for which three in twenty 16-34 year olds would hire clothes (14%), falling to less than one in twenty of those 55+ (four percent). There are no significant regional differences, either between the nations in the UK or between the regions in England, apart from people in Greater London being more likely to consider hiring clothes to keep up with the latest fashion (14% compared to nine percent overall). People in smaller households are more likely to consider hiring items of clothing for a special occasion; eight in ten of those who would consider hiring more frequently would do so because of this (83%) compared to three in four people living in a household with five or more people in it (74%). Bigger households, especially households with children, are more likely than smaller households to consider it to keep up with the latest fashion; one in six people in households larger than five (15%), or in household with children (14%) would consider hiring for this reason compared to smaller households (five percent for single households) or households with children (seven percent). These people are also more likely to consider hiring clothes to avoid having nearly-new clothes that children have grown out of; one in ten for households with more than five people (10%), compared to less than one in twenty overall (three percent).
Clothing behaviour research 42
11-049455-01 - Clothing report - v6 FINAL - 16 Mar 2012 - INTERNAL USE (1)
Similarly to hiring clothes, most people who would consider leasing clothes more often would do so for special occasions or as a ‘one-off’ (63%), or to be able to wear something they could not normally afford (45%). Around also seen as amount a ‘one off’ onand to wear three Leasing in ten would lease to reduce the overall they spend clothes (33%) or to avoid having a something unaffordable wardrobe full of clothes that they don’t wear (29%).(Q19) Figure 21 (Q19)
Why might you consider leasing an item of clothing? For a special occasion/as a ‘one off’
63%
To wear something I normally couldn’t afford
45% 33%
Reduce overall amount of money I spend on clothes Avoid ending up with wardrobe full of clothes I don’t wear
29%
Reduce risk of having items I dislike after wearing them few times
19% 15%
Greater choice / variety in my wardrobe
11%
To keep up with the latest fashion If I became pregnant To avoid having lots of nearly-new clothes which my child / baby has grown out of Other None of the above
10% 5% 1% 3%
Base: UK adults who would consider leasing clothes more frequently (2,552), 7-20 December 2011
Women are more likely than men to consider leasing items of clothing for many of these reasons. For example, over half of women who would consider leasing an item would do so in order to lease something that they could not normally afford (51%) compared to just over a third of men (36%). Approaching one in five women who would consider leasing clothes would do so if they became pregnant (17%). Older people are more likely to consider leasing clothes in order to wear something they could not normally afford; almost half of those aged 55+ (48%) compared to four in ten of those 16-24 (41%). More than seven in ten of those aged 55+ would lease clothes for a special occasion (72%) compared to around half of those 16-24 (56%). Younger people are more likely than the older generations to lease items of clothing to get a greater choice in their wardrobe; three in twenty of those 16-24 year olds who would consider leasing more often would consider it for this reason (17%) compared to less than one in ten people over 65 (eight percent), or to keep up with the latest fashion; over a fifth of 16-24 year olds (21%) compared to one in ten overall (11%). Regional differences are small, but the Northern Irish are more keen than the other nations in the UK to lease clothes that they could not normally afford; over half would consider it for this reason (53%) compared to just over two in five overall in the UK (45%), and to reduce the overall amount of money they spend on clothes; over four in ten (43%) compared to a third in the UK (33%). Smaller households are generally more willing to consider leasing items; a third of those in single person household would consider leasing to avoid ending up with a wardrobe full of clothes they don’t wear (33%), compared to under three in ten overall (29%). Households with children are more likely to consider leasing clothes, three in twenty stating the reason they would consider leasing would be to avoid having clothes their child has grown out of (15%) compared to one in twenty overall (5%). Avoiding having lots of new clothes that are too small for a child is a great motivator for people responsible for buying clothes for children, with a fifth considering leasing clothes for that purpose, compared to just one in twenty overall (19% vs. five percent overall).
Clothing behaviour research 43
11-049455-01 - Clothing report - v6 FINAL - 16 Mar 2012 - INTERNAL USE (1)
Those households with high annual incomes (£100k+) would consider leasing items so as not to end up with wardrobe of clothes they do not wear; over half of people in this group would consider leasing clothes for this reason (55%) compared to less than three in ten overall (29%). Those who see themselves as main shoppers are more inclined to consider leasing clothes; almost half would lease clothes to be able to wear something which they could not normally afford (46% vs. 32% of those not being the main shopper), and one in ten would consider leasing if they became pregnant, compared to just one in twenty of those who are not the main shopper (10% vs. five percent).
Clothing behaviour research 44
11-049455-01 - Clothing report - v6 FINAL - 16 Mar 2012 - INTERNAL USE (1)
Around four in ten people agree that they would only consider leasing an item if it was new and unused (38%). However, over a quarter disagree with this statement indicating that they would consider leasing an item if it had already been worn (28%). A third are non-committal and neither agree nor disagree (32%).
Leasing clothes don’t have to be new and unused (Q20)
Figure 22 (Q20)
To what extent do you agree or disagree with the following statement?
I would only consider leasing an item if it was new and unused Don’t know (2%) Strongly disagree
5% Tend to disagree
Strongly agree
13%
23% 25% Tend to agree
Neither
32%
Base: UK adults who would consider leasing clothes more frequently (2,552), 7-20 December 2011
Men are more likely than women to only consider leasing an item if it was new and unused; four in ten of those who would consider leasing more frequently strongly agree or tend to agree (41%) compared to a third of women (36%). Younger people tend to only consider leasing items that are new and unused more so than older people, with almost half of 16-24 year olds agreeing that this must be the case (46%) compared to just over a third overall (36%). People in Northern Ireland are more likely to only lease new and unused items with almost half of those willing to consider leasing clothes saying that they must be new (44% vs. 38% overall). Larger households are more likely to agree with the statement; three in twenty living in households with four people or more agreeing (15%), compared to one in ten overall (nine percent). Households with children, especially young children, agree to a larger extent than the rest of the population; almost a fifth of those with a child between 0-3 in the household strongly agree with the statement (17%) compared to just over one in ten overall (13%).
Clothing behaviour research 45
11-049455-01 - Clothing report - v6 FINAL - 16 Mar 2012 - INTERNAL USE (1)
3.3
Retailer ‘buy-back’ scheme
3.3.1 Selling clothing back More than half of people would be at least fairly likely to use a buy-back scheme were it to be introduced; definitely (eight percent), very likely (15%) and fairly likely (29%). Just under one in ten would be ‘not at all likely’ to sell back clothes (nine percent) and a further quarter consider it to be ‘not very likely’ (27%).
Majority are interested in selling back clothing (Q21a)
Figure 23 (Q21a)
It has been suggested that consumers should be able to sell back clothing in good condition to high street and online retailers. If such a scheme was introduced near you, how likely, if at all, would you be to use it? Don’t know
11%
Definitely
8%
Not at all likely
9%
Not very likely
15%
Very likely
27% 29%
Fairly likely
Base: UK adults (7,950), 7-20 December 2011
Women are a lot more interested in a buy back scheme, with 62% at least fairly likely to use such a scheme compared to 42% of men. One in ten women would definitely use this scheme (10%), while around half as many men definitely would (six percent). Younger people are much more likely to use a buy back scheme with almost one in eight 16-24 year olds saying they would definitely use such a scheme (12%), dropping to one in twenty of those 55+ (five percent). People in Northern Ireland are more likely to use a buy back scheme were it to be introduced; one in seven would definitely us it (14%), compared to fewer than one in ten overall (eight percent). Larger households are more likely to use the scheme; for households containing four or more people, over one in ten would definitely use it (12%) compared to eight percent overall. Households with children are significantly more likely to use a buy back scheme, two in ten households with a pregnant woman answering definitely (20%), and one in eight households with at least one child (12%). Respondents who are not the main earners, employed people and main shoppers are more likely to use a buy back scheme, with over half at least fairly likely to use it (59%, 57% and 54% respectively).
Clothing behaviour research 46
11-049455-01 - Clothing report - v6 FINAL - 16 Mar 2012 - INTERNAL USE (1)
The type of clothes that people would consider selling back if such a scheme was introduced would principally be formal wear (47%), clothes for going out and socialising (42%), and designer clothing (31%). Over a quarter of Selling back interest for formal wear and socialising people would consider selling back seasonal clothes (28%).
clothing (Q21b)
Figure 24 (Q21b)
If this service was available, what type of clothes might you sell back, if any? Formal wear
47%
Clothes for going out and socialising
42%
Designer clothing
31%
Winter or summer clothes
28%
Clothes for daytime leisure
24%
Fancy dress
23%
Clothes for work
19%
Clothes for sporting or outdoor activities
19%
Maternity wear
13%
Other children’s wear
9%
Baby clothes
9%
School wear None, would not consider
8% 18%
Base: UK adults who would consider a buy-back scheme (6,314); 7-20 December 2011
Women are much more likely to sell back clothes than men; almost six in ten would be willing to sell back formal wear (58%) and almost half would be willing to sell back clothes for going out and socialising (48%), compared to a third of men (34% and 33% respectively). A quarter of men would not consider selling clothes back (25%), compared to just one in ten women (12%). Younger people are more likely to sell back clothes; over half of 16-34 year olds would sell back formal wear (54%), whereas only four in ten of those aged 55+ would (42%). Only one in ten 16-24 year old would not consider selling back clothes (10%) compared to a third of those aged 66+ (31%). People living in Northern Ireland are more likely to be positive about selling back clothes; half of the population there would be willing to sell back clothes for going out and socialising (50%) compared to four in ten overall (42%). Only one in ten of the Northern Irish would not consider selling back clothes (12%) compared to almost two in ten overall (18%). Bigger households are more likely to sell back clothes; four in ten in households of more than five people are willing to sell back designer clothing (41%) compared to three in ten overall (31%). Households with children in them are more likely to sell back clothes with six in ten pregnant women willing to consider selling back maternity wear (59%) and six in ten households with children under the age of three selling back baby clothes (59%). People with higher incomes are more likely to be interested in selling back clothes, with over half of those households earning more than £55k annually willing to sell back formal wear (52%) compared to just under half overall (47%). One in five of those households earning less than £20k would not consider selling back clothes (21%), while only one in ten of those households earning more than £55k would (13%). Unemployed people are less likely to sell back clothes; a fifth would not do this (22%) compared to under one in six who are employed (15%).
Clothing behaviour research 47
11-049455-01 - Clothing report - v6 FINAL - 16 Mar 2012 - INTERNAL USE (1)
A fifth of main earners and of people not responsible for buying clothes, and a quarter of those not responsible for washing clothes would not consider selling back clothes (20%, 21%, and 25% respectively, compared to below a fifth overall (18%). People who could do more to buy clothes made to last and would like to are more likely to sell back clothes; half are willing to sell back formal wear (50%) and a quarter willing to sell back clothes for work (24%), compared to less than half and a fifth overall (47% and 19%). People who would like to do more to minimise waste when getting rid of clothes are also more likely to sell back clothes; almost six in ten are willing to sell back formal wear (58%) and a quarter willing to sell back clothes for work (26%).
Clothing behaviour research 48
11-049455-01 - Clothing report - v6 FINAL - 16 Mar 2012 - INTERNAL USE (1)
Three-quarters of people would consider selling back clothes even if the buying price was as low as £15 (75%), rising to the vast majority for higher cost items (84% for an item originally worth £100). The average value at which people would be willing to sell back clothes at is a bit less than half the purchasing price; £6.44 for an item originally costing £15, £21.50 for an item costing £50, and £45.61 for an item costing would sell back clothing some £100.Most While these values do not leave much room for a profit tocheaply, be made, a substantial proportion were willing cheaper still (Q21c) to accept rather less; one in five indicated that they would accept £10 or less for items that had cost £50 (22%) and a similar proportion that they would accept £25 or less for items that had cost £100 (21%). Figure 25 (Q21c)
For each of the following items what would be the minimum amount you might expect to receive to make it worth your while to sell it back?
Mean value (£)
Would not bother (%)
Don’t know (%)
An item of clothing you had paid £15 for
£6.44
15%
9%
An item of clothing you had paid £50 for
£21.50
2%
8%
An item of clothing you had paid £100 for
£45.61
2%
12%
Base: UK adults who would consider a buy-back scheme (5,172); 7-20 December 2011
Women expect more money when selling back items of clothing. The mean amount they expect for an item costing £15 is £6.62 (£6.17 for men), £22.52 for an item costing £50 (£20.02 for men), and £48.25 for an item costing £100 (£41.77 for men). Young people also expect to receive more money. 16-24 year olds would require an average of £7.75 for an item costing £15 (£6.07 for 66+), £26.59 for an item costing £50 (£19.13 for 66+), and £56.69 for an item costing £100 (£39.92 for 66+). The differences between the countries in the UK is statistically insignificant, but people living in Greater London expect more money for their clothes if they sell them back; £6.82 for an item costing £15, 22.29 for an item costing £50, and £48.49 for an item costing £100. Larger households expect more money. For an item that cost £100 new, a household with more than five people would expect to sell it back for £49.18, compared to £45.61 overall. People who have never been married expect more money than couples or households with children; £50.07 for an item costing £100 compared to £48.18 or £45.70. Not surprisingly, households with a lower annual income expect more money when selling an item back. A household with an annual income lower than £10k expects £50.07 for an item costing £100, and a household earning an annual income between £10k and £20k expects £46.42. Less educated respondents also expect more money when selling back clothes, people with no qualifications expecting £47.96 for an item originally worth £100, and those who hold FE/HE qualifications expecting £44.98.
Clothing behaviour research 49
11-049455-01 - Clothing report - v6 FINAL - 16 Mar 2012 - INTERNAL USE (1)
Respondents not responsible for buying clothes expect more money; £50.44 for an item costing £100, compared to £44.71 for those who are responsible for buying clothes for more than one person. People who aren’t the main earner in the household also expect more money than those who are, wanting £47.52 for an item they paid around £100 for, compared to people who are the main earner who would want £44.48. The table below shows expected values for those who shop at least once a year in each of the different places. Where responses are significantly higher than average, they are shown in bold.
Base
Amount willing to pay if originally worth £15 (average)
Catalogues
519
£6.93
£22.74
£49.14
Charity shops
627
£6.46
£22.30
£47.41
1,150
£6.25
£21.09
£44.73
Designer clothes stores
557
£6.82
£22.39
£47.35
Factory outlet
867
£6.33
£21.46
£45.73
From a friend
249
£7.38
£24.92
£54.11
1,395
£6.24
£21.25
£45.17
High St retailer online
972
£6.49
£22.09
£47.08
Jumble/car boot
293
£6.99
£23.33
£49.78
Online (new items)
837
£6.38
£21.73
£46.31
Online (used items)
538
£6.62
£22.72
£48.08
Outdoor clothing
607
£6.38
£21.32
£45.03
1,257
£6.30
£21.32
£45.25
286
£7.04
£23.67
£49.77
5,044
£6.40
£21.42
£45.49
5,172
£6.44
£21.50
£45.61
Bought clothes from here at least once in last year
Department stores
High St retailer in store
Supermarkets Vintage clothes shops TOTAL (UK adults who would consider a buyback scheme and buy clothes) TOTAL (UK adults who would consider a buyback scheme)
Amount willing to pay if originally worth £50 (average)
Amount willing to pay if originally worth £100 (average)
Clothing behaviour research 50
11-049455-01 - Clothing report - v6 FINAL - 16 Mar 2012 - INTERNAL USE (1)
3.3.2 Buying returned clothing Fewer than a third of people who buy clothes would not consider buying clothes that had been returned to the retailer (32%), leaving over two-thirds who would (68%). More than four out of ten would consider buying formal wear returned in good condition (42%), and a third would consider buying designer clothing and clothes for going out and socialising (both 34%). Between a quarter and a fifth of people would consider clothes for daytime leisure (26%), winter or summer clothes (25%), fancy dress (24%), clothes for work (22%) or for sporting or outdoor activities (20%). While relatively low proportions of the adult population would consider buying maternity wear (eight percent) or children’s/baby clothes (seven percent or fewer), this figure rises among those who actually have children (see Over two-thirds would consider buying clothes, below).
mostly formal and designer wear (Q22)
Figure 26 (Q22)
Assuming they had been returned to the retailer in good condition by another customer after being worn, which, if any, of the following types of clothing would you consider buying at a discount from a major high street or online retailer? Formal wear Designer clothing Clothes for going out and socialising Clothes for daytime leisure Winter or summer clothes Fancy dress Clothes for work Clothes for sporting or outdoor activities Maternity wear Other children’s wear School wear Baby clothes
42% 34% 34% 26% 25% 24% 22% 20% 8% 7% 6% 5%
None, would not consider
32%
Base: UK adults who buy clothes (7,708), 7-20 December 2011
Women are far more likely to consider buying second hand clothes from a high street or online retailer; over half of women would consider buying formal wear (53%) and just under half would consider buying designer clothing (44%), compared to one in three and less than a quarter of men (29% and 23%). Men are more likely than women to never consider buying worn clothes; four in ten men say this (42%) compared to less than a quarter of women (24%). Younger people are more inclined to consider buying worn clothes from high street/online retailers; almost half of those 16-24 and more than half of those 25-34 would consider buying formal wear (47% and 52% respectively), while the figure is around a third for 55-65 year olds and less than three in ten for those aged 66+ (36% and 29% respectively). More than two in five of those aged 55+ would never consider buying worn clothes from retailers (43%) while the same only applies to less than a quarter of those aged 16-34 years (23%). Residents of Northern Ireland are more positive towards buying worn clothes than those living in Scotland and England; the proportion of people who would never consider this is a quarter in Northern Ireland (25%), whereas it is a third in Scotland and England (34% and 32%).
Clothing behaviour research 51
11-049455-01 - Clothing report - v6 FINAL - 16 Mar 2012 - INTERNAL USE (1)
People in larger households are generally more likely to consider buying clothes previously worn from a high street/online retailer; nearly half of people in households with more than five people would consider buying designer clothes this way (46%), while less than three in ten people in single person households would do the same (29%). More than a third of people living in single person households and people living in two person households would never consider buying worn clothes (36% and 37% respectively), while less than three in ten in four person households say the same (27%), and less than a quarter in five or more person households (23%). People in households where there are children are generally more likely to buy worn clothes than those in households where there are none; a third of people with a child under 3 years old would be prepared to buy worn maternity wear and children’s clothes (33%) compared to less than one in ten overall (8% and 7% respectively). People living in households with a higher income are more likely to buy worn designer clothes; half of those earning over £100k would do this (49%) compared to three in ten people with a household income less that £10k (31%), or fancy dress; two in five earning over £100k (38%) compared to one in five earning less than £10k (21%). People with lower incomes are more likely to buy worn clothes for going out and socialising (38% earning less than £10k vs. 30% earning more than £100k), daytime leisure activities (33% vs. 13%) and seasonal clothing (33% vs. 21%). More educated people are generally more likely to do this, where four in ten of those without any qualifications would never consider doing this (41%), compared to less than a third overall (32%). People who aren’t the main earner are more likely to buy clothes returned to a retailer; around a quarter would never consider this (27%) compared to around a third overall (32%), while four in ten of those who do not see themselves as the main shopper would never consider this (42%). People who are employed are more likely to buy worn clothes; almost half are prepared to buy formal wear (46%), while only a third of unemployed would do the same (37%). People who aren’t responsible for washing clothes or for getting rid of clothes are more likely to never consider buying worn clothes, almost half say this (45% and 48% respectively) compared to only a third overall (32%). Those who could do more to buy clothes made to last and want to are more likely to buy clothes worn previously; half would consider buying formal wear (48%) compared to four in ten overall (42%). The same goes for those who could do more to minimise waste when getting rid of clothes and would like to do so; over half would consider buying designer clothing (52%) compared to a third overall (34%).
Clothing behaviour research 52
11-049455-01 - Clothing report - v6 FINAL - 16 Mar 2012 - INTERNAL USE (1)
4.0
Current wardrobe – use, reuse and discard
This section reports on the kinds of clothing that people own and how they discard unwanted items. Questions addressed the amount and value of people’s wardrobe contents and, in the case of unworn items, why they were kept. People were asked to identify who they might approach if unworn items required repair or alteration and whether they personally had the skills necessary to undertake such work. Finally, the survey explored how clothing was discarded and what, if anything, might encourage people to reduce waste by selling unwanted items or by separating them for reuse or recycling. Respondents were asked to estimate the replacement value of all of the clothing that they owned. They typically estimated the value at £1,783 (based on the mean), the average number of items being 115. The survey revealed that, overall, three in ten items owned had not been worn during the past year (30%). In each of the categories of clothing around one in five or more items was unworn; over a third in the case of ties, suits, skirts, swimwear, dresses and blouses. Numerically the most unworn items were ties, underwear, tops and t-shirts; on average, respondents owned at least three of each. Aside from clothes kept for special occasions, the most common explanation given by respondents for not wearing some of their clothes is that they no longer fit; this was the case for more than half of those who had some unworn items (57%). The proportion is higher for women (64%), but there is no variation by age. Nearly half own items that were unworn due to ‘wear and tear’ (46%), typically considered ‘worn out’, in need of repair, stained or ‘shrunk in the wash’. Over four in ten own unworn items because they ‘haven’t got round to throwing them out’ (41%); this was more likely for people aged over 55 (48%). More than a third own unworn items considered ‘no longer my style/taste’ (36%); in this case the proportion was much higher for those aged 16-24 (58%). Overall, four in five people own at least some clothes that have not been worn because they no longer fit or need altering (80%, a proportion not age-related) and over six in ten own clothes that have not been worn because of disrepair (62%, or at least 70% in the case of respondents aged under 35). People were next asked about factors that might make them bring their unworn items back into use. The one cited most often, by nearly two-thirds of respondents, is ‘if my weight changed’ (64%), followed by ‘if I could not afford to buy new clothes’ (58%). More than half, however, suggested that what is needed is for them to check more regularly what they have in their wardrobes (53%). Other key factors are having the necessary skills or time to repair or alter clothes and the ability to remove stains, mentioned by more than a quarter of respondents (30% and 28% respectively). The survey explored whether people feel that they have an ability to undertake particular types of repair or alteration and found considerable variation. Overall, around three-quarters are able to sew a button on (74%) and nearly half can darn or patch a hole, or take a hem up or down (47% each). There is variation by gender and age, with women and older people more like to have the necessary ability; an exception was redesigning clothes, for which people aged 16-24 were equally able. More than a quarter of men and nearly one in ten women lack the ability to do any repairs (28% of men and eight percent of women). When people were asked who, if anyone, they would approach to undertake repairs or alterations, the most popular response was ‘tailor/independent store offering repair and alterations’ (36%). After this, women would approach a dry cleaner, ask a parent or undertake the work herself (26%, 23%, 19% respectively), while men would turn first to a spouse or partner and then consider using a dry cleaner or asking a parent (35%, 30%, 19% respectively). They were also invited to consider whether they, or another family member, would be interested in learning more about how to repair clothes and over half of women and nearly a quarter of men responded positively (52% and 23% respectively). A question was asked concerning borrowing clothes. Overall, barely one in ten respondents borrow clothes (13%), although the proportion varies by age and, for people aged 16-24, is over a third (37%). Borrowing is typically from siblings or close friends (four percent each).
Clothing behaviour research 53
11-049455-01 - Clothing report - v6 FINAL - 16 Mar 2012 - INTERNAL USE (1)
The survey then explored how people dispose of unwanted clothing. It found evidence of good practice: nearly three quarters have donated some items to charity shops during the past year (73%), rather higher than the proportion who have purchased from such shops over the same period. Over four in ten indicated that this was how they discarded the majority of unwanted items (41%). Older people and women are more likely to use this route (81% of people aged over 65 and the same proportion of women donate at least some of their clothes in this way vs. 73% overall). Over four in ten have used doorstep collections organised by a registered charity for at least some of their clothes (42%); they are especially used by older people and women (46% both for people over 65 and women). Well over a third of respondents have taken some unwanted clothing to a textiles/clothing bin at locations such as supermarket car parks (37%). More than a third have given some unwanted clothes to friends and relatives (35%) and over one in five to homeless people or neighbours in need (22%). More negative was evidence that nearly half have put at least some clothing ‘in the bin’ (48%); younger people and men are more inclined to do this (51% both for men and people aged 16-24). A few (around one in fourteen, and again more likely young and male) discarded most of their unwanted clothing in this way (seven percent). When people were asked to identify the main reasons why they put some items in the bin, threequarters reply that it was because they were too damaged or dirty to be used again (75%), and over a third that they were ‘too personal’ to get rid of in another way (e.g. items such as underwear) (37%); in these cases, the proportions are higher for women (44% vs. 30% for men). A quarter replied that it was because the items ‘have no monetary value’ (26%); men are more likely to cite this explanation (29% vs. 23% for women). Two possible behavioural changes were investigated. First, people were asked if anything would lead them to try selling unwanted clothes online or through community events such as car boot sales. The most important factor, cited by three in ten, is whether people believe they would get a ‘reasonable amount’ of money from such an activity (30%). A similar motive is given by one in five who replied they that would sell clothes if they were of better quality and ‘worth more than they are’ (20%). Around a quarter would do so if they had more spare time (25%). Over a third, especially men and older people, do not wish to sell unwanted clothing in this way (35% vs 45% of men and 56% of people over 65). People were also asked what might lead them to give unwanted clothes more often to an organisation which would reuse or recycle them rather than putting them in a household waste collection. The most important factor, mentioned by over a third of respondents, is if people thought that damaged or heavily worn clothing was valuable to such organisations (35%); this is especially true for older people (38% of those over 55). The other key factors are the presence nearby of a communal bin for collecting clothes for such organisations, cited by a quarter (24%), and if more charities organised doorstep collections in their area, cited by one in five (20%). Fewer respondents would be motivated by retailer loyalty points (18%), high street vouchers (18%) or a monetary incentive (15%). When people were asked for their view on getting rid of clothes, around a quarter indicated that they could do more to cut back on unnecessary clothing purchases and to repair and maintain clothes, and are willing to do so (24%), with higher proportions for women and younger people (26% of women and 36% of those aged 16-24). Nearly two-thirds consider that they are already doing everything they can to minimise their contribution to clothing waste (65%), while a small proportion, one in nine, could do more to change their clothing purchases and use of clothing in order to reduce waste but are not interested in doing so (11%). In summary, a substantial proportion of the clothes that people own are unworn, many because they no longer fit or are in disrepair but also due to people not regularly checking their wardrobes. Although many people lack an ability to repair or alter clothing, there is considerable interest in learning more about how to do so. Much unwanted clothing is donated to charity shops or discarded using other appropriate routes, but clothing is often binned because people consider it too damaged or heavily worn. People would be most likely to separate more clothing for reuse or recycling if made aware that such items have value.
Clothing behaviour research 54
11-049455-01 - Clothing report - v6 FINAL - 16 Mar 2012 - INTERNAL USE (1)
4.1
Value of clothing
Respondents were asked to estimate the current value of their wardrobe. This value was the cost to replace all items with new ones, whether stored in their home or elsewhere (e.g. in storage). It excluded all footwear and accessories. In the cases where the respondent refused or couldn’t estimate, a list of possible ranges was presented to them and they were asked to estimate using those bands. The average wardrobe value in the UK was £1,783, with one in five having a value of less than £500 (20%), almost a quarter between £500 and £999 (23%) and another one in five worth between £1,000 and £1,999 (21%). One in twenty adults own between £5,000 and £9,999 worth of clothing (five percent) and one in fifty own over £10,000 worth (two percent).
Average UK adults owns almost £1,800 worth of clothes Figure 27 (Q50) (Q50)
Please estimate the value of replacing all of the clothes that you own at home or elsewhere (for example in storage) which were bought for your own personal use. 20%
Less than £500
23%
£500-999
21%
£1000-1999
13%
£2000-2999
6%
£3000-3999 £4000-4999
2% 5%
£5000-9999 Over £10000
2%
Don’t know Refused
Mean value: £1,783
6% 1%
Base: UK adults (15,900), 7-20 December 2011
The middle-aged own the most valuable collection of clothing, with the average cost to replace items standing at just over £2,000 among those aged 35-44 and just under for those aged 45-54 (£2,054 and £1,939 respectively). The average among those aged 66+ is just above £1,500 and the least valuable wardrobes belong to the youngest age group where the average falls to £1,216. The value is notably higher in London, where the average cost rises to £2,265. It would cost the average women over £250 more than men to replace their wardrobe; the average woman values her clothing at £1,911 and the average man at £1,647. Those in employment own a more valuable wardrobe, with an average of £1,934 compared to £1,592 among those who are not employed. The more money that is earned by the household, the more valuable the collection, rising to almost £5,000 among those earning over £100k per year (£4,833) and dropping to £1,123 among those earning less than £10k. It follows that the highest educated own the most valuable collection; £2,071 if they have FE/HE qualifications falling to £1,294 if they have no formal education. Others who own a more valuable wardrobe are those who describe themselves as the main shopper (£1,802 vs. £1,566) and those who are not interested in minimising clothing waste (£2,026 vs. £1,638 of those who already do everything they can).
Clothing behaviour research 55
11-049455-01 - Clothing report - v6 FINAL - 16 Mar 2012 - INTERNAL USE (1)
4.2
Unworn clothing
Respondents were asked how many items they owned of each particular type and how many of those they had not worn in the last 12 months. Some items are mainly for men (e.g. ties) and some mainly for women (e.g. blouses) but the chart below shows the average number for each person living in the UK (i.e. the data is good for showing the percentage, and therefore the number, of unworn items but the typical number owned will vary by gender). Over four out of every five adults owns at least one item of clothing that they have not worn in the last 12 months (82%). On average, each adult in the UK owns 4.2 ties that they have not worn. When extrapolated to the full UK population, this equates to approximately 210 million ties (see figure 30). The next most notable items which have not been worn are underwear/lingerie (3.8 per person), tops (3.5) and t-shirts/polo shirts (3.5). Figure 28 (Q23)
Hundreds millions ofclothing, unworn clothes (Q23) For each of theof following types of please can you say how many you own and how many you have NOT worn in the last 12 months? Own Ties Underwear / lingerie Top T-shirt / polo shirt Shirt Trousers
Jumper / Knitwear (e.g. cardigan, sweater) Coat / Jacket Dress Skirt Jeans Shorts / cropped trousers Blouse Swimwear Sportswear Nightwear Suit Sweatshirt / Hoodie Fleece / bodywarmer Leggings
4.2 3.8 3.5 3.5 2.7 2.4 2.0 5.2 1.5 3.7 1.5 3.2 1.4 4.6 1.3 3.5 1.1 2.9 1.1 2.3 1.0 3.4 0.9 4.0 0.8 1.9 0.8 2.8 0.6 2.0 0.4 1.2 0.3
Not worn 7.1 19.9 11.3 12.7 8.5 7.4 7.4
UK adult population: Approx 50 million
Base: UK adults (7,950), 7-20 December 2011
The sub-group analysis for the types of clothing people have is distorted by the fact that some types of clothes are aimed at specific genders and specific age groups, etc. While some types of clothes might be worn by both sexes, they do not necessarily own a comparable amount. Therefore, the analysis about how many are worn per age group or per sex is not presented here; for example, jeans are primarily owned by younger people and thus they are much more likely to own a pair which they have not worn. Younger people are more likely not to have worn something in the last year, and they are also more likely to have not to have worn a greater number of clothes, although there is great variation between the categories of clothes.
Clothing behaviour research 56
11-049455-01 - Clothing report - v6 FINAL - 16 Mar 2012 - INTERNAL USE (1)
People who have higher incomes and those who have a valuable wardrobe are more likely to have not worn some of their clothes in the last year. For example, the mean number of suits not worn for the past 12 months for those with a wardrobe more valuable than £2000 was above one, rising to 1.8 for those with wardrobes more valuable than £5000. This can be compared to those with a wardrobe worth less than £500, where an average of 0.4 suits have not been worn. This relationship is not just true for suits, an expensive piece of clothing linked to an office job, but is similar for jeans, where 2.7 haven’t been worn among those with a wardrobe more valuable than £5000 falling to 0.9 for those valued at below £500, and skirts, with 3.3 not worn among those with the highest valued wardrobe, falling to 0.8 among those with the lowest. Adults in the UK (those aged 16+) estimate that they own a total of almost six billion items of clothing between them (5,744,000,000). Of these, seven in ten items have been worn in the last 12 months (70%), leaving three in ten that have not. This equates to 1.75 billion items in the UK that adults own but have not worn in the last 12 months. Figure 29 (Q23 extrapolated)
Hundreds millions ofclothing, unworn clothes (Q23) For each of theof following types of please can you say how many you own and how many you have NOT worn in the last 12 months? Items in the UK (owned)
Items in the UK (not worn in last 12 months)
Items in the UK (worn in last 12 months)
Ties
352,500,000
208,500,000
144,000,000
Underwear / lingerie
994,500,000
190,500,000
804,000,000
Top
566,000,000
177,000,000
389,000,000
T-shirt / polo shirt
636,500,000
174,000,000
462,500,000
Shirt
426,500,000
136,500,000
290,000,000
Trousers
372,000,000
119,500,000
252,500,000
Jumper / Knitwear (e.g. cardigan, sweater)
368,500,000
101,000,000
267,500,000
Coat / Jacket
261,000,000
77,000,000
184,000,000
Dress
183,000,000
76,000,000
107,000,000
Skirt
159,500,000
67,500,000
92,000,000
Jeans
228,000,000
63,000,000
165,000,000
Shorts / cropped trousers
175,500,000
56,000,000
119,500,000
Blouse
145,000,000
55,000,000
90,000,000
Swimwear
116,000,000
49,000,000
67,000,000
Sportswear
167,500,000
46,500,000
121,000,000
Nightwear
202,000,000
41,500,000
160,500,000
Suit
93,000,000
40,000,000
53,000,000
Sweatshirt / Hoodie
137,500,000
32,000,000
105,500,000
Fleece / bodywarmer
100,500,000
21,000,000
79,500,000
Leggings
59,000,000
12,500,000
46,500,000
5,744,000,000
1,744,000,000
4,000,000,000
TOTAL
Base: UK adults (7,950), 7-20 December 2011
Since figure 28 shows the average number of each item a person living in the UK owns (or hasn’t worn), we can calculate how many items are owned and not worn in the UK by multiplying the average number by the UK population. For example, if every adult in the UK owns an average of 7.05 ties (no matter whether they are male or female), the number of ties owned by the UK adult population is 7.05 x 50,000,000 (the approximate number of adults living in the UK). As with any survey, there are small margins for error here and the numbers in figure 29 should be treated as being approximate.
Clothing behaviour research 57
11-049455-01 - Clothing report - v6 FINAL - 16 Mar 2012 - INTERNAL USE (1)
The most likely reason for an item of clothing not to have been worn in the last 12 months is that it is no longer suitable, with over three-quarters of those who own some clothes that they haven’t worn citing this as a reason (77%). Over half own clothes that no longer fit them (57%), over a third say that the item(s) no longer fit their style or taste (36%) and almost one in five don’t wear clothes that are ‘no longer fashionable’ (18%). Two-thirds have not worn clothes because it is designed just to be ‘occasional wear’ (65%), either for formal occasions (44%) or for special occasions such as weddings or funerals (37%). Almost half own at least one item of clothing which they have not worn because of wear and tear (46%). This includes items which have been worn out (16%), those that need repairing (also 16%) and those where some other aspect has failed, such as the zip or elastic (14%). One in ten have not worn an item because of the following washing issues; can’t get stains out (10%), misshapen during washing (10%), colours have run/faded (nine percent) or the item has shrunk (nine percent). Other reasons include not having got round to throwing them out (41%), they just have too many clothes (24%) and because the item is of high value and they don’t want to just throw it out (17%). More than one in ten people own an item that has not been worn in the last 12 months because it was an unwanted gift (13%). Figure 30 (Q24)
Most clothes are no suitable (Q24) For whichunworn of the following reasons have youlonger NOT worn at least some of your clothes in the last 12 months? No longer fits me No longer my style / taste No longer fashionable Maternity wear Change of location Change of culture/religion Change of gender identity
18%
3% 3% 1% *
For formal occasions only For special occasions only Sentimental value (e.g. Wedding dress) For outdoor/sports activities olnly (e.g. Skiing) Worn out Needs repairing for some other reason Some aspect has failed (e.g. Zip, elastic, lost buttons) Can't get stains out Misshapen following washing Colours have run/faded in the wash Shrunk in the wash Moth holes I haven’t got round to throwing them out I have too many clothes High value item I don’t want to throw out I received the item as an unwanted present I can't easily reach/access/get at the clothes I have been living away from home I lent the item to someone else Other None of the above
3%
16% 16% 14% 10% 10% 9% 9%
5% 2% 1%
17% 13%
No longer suitable (77%)
37%
13% 11%
57%
36%
44% Occasional wear (65%)
Clothing wear and tear (46%)
24%
41% Other reasons (70%)
2% 4%
Base: UK adults who have not worn some of their clothes in the last 12 months (6,577), 7-20 December 2011
More than seven in ten women don’t wear some of their clothes because they are occasional items (72%) compared to fewer than six in ten of men (58%). The proportion of people who have clothes that no longer fit is higher among women; more than six in ten (64%) compared to only half of men (50%). Furthermore, four in ten women say that some of their unworn clothes are no longer their style (41%), while the same is true for under a third of men (32%). Over a fifth of women keep a ‘high value’ item in their wardrobe that they don’t want to throw out (22%) compared to one in eight men (12%). Men are more likely to cite wear and tear; a fifth say that their unworn clothes are ‘worn out’ (20%) compared to one in eight women (12%).
Clothing behaviour research 58
11-049455-01 - Clothing report - v6 FINAL - 16 Mar 2012 - INTERNAL USE (1)
Many more young people claim not to have worn their clothes in the last year due to ‘wear and tear’, typically considered those considered ‘worn out’, in need of repair, stained or having ‘shrunk in the wash’; over six in ten say this, falling to a third of those above the age of 66 (64% falling to 35%). One in five of those aged 16-24 cited getting an unwanted gift as a reason for not wearing some of their clothes (20%), falling to fewer than one in ten of those aged 66+ (nine percent). While over four in ten indicate that they own unworn items because they ‘haven’t got round to throwing them out’ (41%), this is most likely among people aged 55+ (48%). Of those that don’t wear some of their clothes because they are ‘no longer my style/taste’, the highest proportion are those aged 16-24 (58% vs. 36% overall). Older people are more likely to say that they simply have too many clothes; a third of those aged 66+ (35%) compared to fewer than a fifth of those aged 16-24 (18%). Over four in ten people in Northern Ireland claim that the clothes they haven’t worn in the last 12 months are no longer their style (42% vs. 36% overall), a quarter that they are worn out (25% vs. 16% overall) and a fifth saying that they received some of their unworn clothes as an unwanted gift (20% vs. 13% overall). People in Greater London are more likely to use fashion issues as an reason for not wearing clothes; over a fifth say this (22%), and one in twelve say that they can’t easily get at the item or that they have moth holes (eight percent each vs. three and five percent overall respectively). People with higher incomes are more likely to say that items are no longer suitable; of those with incomes over £55k annually, over two in five say that unworn clothes are no longer their style (43% vs. 36% overall), and a quarter say that they are no longer fashionable 25% vs. 18% overall). Those with higher value wardrobes are more likely to claim ‘other reasons’ for not wearing some of their clothes; two in five say that they have too many clothes (41%), compared to a quarter overall (24%), and a third claim that they have high value items they don’t want to throw out (33% vs. 17% overall). People who could do more to minimise waste when getting rid of clothes and those who could do more to buy clothes made to last are more likely to cite reasons for not wearing their clothes in the last twelve months. Over eight in ten claim that clothes are no longer suitable (85% and 84% vs. 77% overall), seven in ten that their clothes are just occasional wear (73% and 70% vs. 65% overall), and around six in ten that they haven’t worn them because of clothing wear and tear (61% and 56% vs. 46% overall).
Clothing behaviour research 59
11-049455-01 - Clothing report - v6 FINAL - 16 Mar 2012 - INTERNAL USE (1)
Four out of five have not used clothes because they
Four out of every five adults who have not worn some clothes in the last 12 months own items that they no no longer fit (Q25) longer wear because they no longer fit and/or require altering (80%). Figure 31 (Q25)
How many of the clothes you have not worn would you say no longer fit you and/or require altering? None
19%
Only a few
39%
Some of them (but less than half)
19%
Around half of them
8%
Many of them (not all but more than half)
8%
Nearly all of them
6%
All of them
1%
Don’t know
1%
Base: UK adults who have not worn some of their clothes in the last 12 months (6,577), 7-20 December 2011
Clothes no longer fitting or requiring altering is a more common reason for women not to wear at least some of their clothes, with more than eight in ten owning at least some (84% vs. 76% of men). It is also more common among younger adults, with more of those aged 16-34 not wearing clothes for this reason (84%) than older people (falling steadily to 75% among those aged 66+). Those who live as part of a couple have more clothing that needs altering or that doesn’t fit; more than eight in ten who live as part of a couple (81%), compared to fewer than eight in ten of those who are single (78%). Those who live with other people in the household are also more likely (83% among those with at least three people) than those who live on their own (76%). People with children are also more likely (83% vs. 79% without a child), especially those who have three children living in their household (89%), a child aged 0-3 years (87%) and those who buy clothes for at least one child (86%). Money also plays a part, with those earning less than £10k a year the least likely not to have worn clothes because they no longer fit or need altering (75%) and those earning between £35k and £100k the most likely (83%). Those earning £100k or more break this trend, with fewer not wearing clothes for this reason (78%). It is also more likely to be those with a valuable wardrobe that have at least one item which doesn’t fit or needs altering; almost nine in ten among those worth £5k or more (86%) and worth £3k-£4k (84%), compared to eight in ten overall (80%). Those in employment are also more likely (81% vs. 78%), as are those who have completed a higher level of education (81% with A-levels or better compared to 75% with no formal education). Others who are more likely include those who do not consider themselves the main earner (83% vs. 79%), those who consider themselves to be the main shopper (80% vs. 74%), and those who would be willing to do more to buy clothes that last (85%) and to minimise waste when getting rid of clothes (91%).
Clothing behaviour research 60
11-049455-01 - Clothing report - v6 FINAL - 16 Mar 2012 - INTERNAL USE (1)
Among the reasons why people might wear more of the clothes that they have not worn in the last 12 months, the most common was if their weight changed (64% thought this was ‘likely’ to make them wear more), if they could not afford to buy new clothes (57%) and if they simply checked more often what they actually have in their wardrobe (53%). All of the rest of the items would persuade at least some people to wear more of their unworn clothes but, for each of them, those who said it was ‘unlikely’ outweighed those who said it was ‘likely’. Figure 32 (Q26)
Checking the wardrobe prompt to wear currently For each of the following statements, how likely would each of them make you unworn clothes (Q26) to wear more of the clothes you have not worn in the last 12 months? % Not at all likely
% Not very likely
% Don’t know
% Very likely
% Fairly likely
If my weight changed
16 14
33
31
6%
If I could not afford to buy new clothes
19 16
36
22
8%
37
16
8%
20
If I checked more regularly what I have in my wardrobe
28
If the style came back into fashion If I had the skills to repair/alter more clothes at home If I could get the stains out
19 22
28
11
12%
38
21
20 10
10%
37
19 18 10
16%
39
25
19 8
10%
If I had spare time available to repair or alter my clothes
40
22
19 8
11%
If able to update appearance using new accessories
40
23
19 6
11%
If more High Street shops offered tailoring services
If I added value of clothes I keep but no longer wear
37
28
18 5
12%
More aware of environmental problems caused by clothing waste /production
38
26
18 5
12%
If I had access to a repair kit at home
45
25
14 5
12%
If had access to sewing machine at home
48
23 12 6
11%
Base: UK adults who have not worn some of their clothes in the last 12 months (6,577), 7-20 December 2011
In general, women are much more likely to consider wearing more of their unworn clothes, while men are more reluctant. For example, seven in ten women thought it likely that they would wear more of their clothes if their weight changed (71%) compared to half of men (56%) and six in ten women if they couldn’t afford to buy more clothes (62%), compared to half of men (53%). Almost six in ten women said it was ‘likely’ that they would wear more if they checked more regularly what they had in their wardrobe (58%), while the same was true of fewer than half of men (48%). Three in ten of women would wear more if they were more aware of environmental problems (27% compared to two in ten men, 19%) and two in ten women if they had access to a repair kit or a sewing machine (22% and 23% respectively, vs. 15% and 12% of men). People aged between 25 and 65 are more ‘likely’ to wear more of their unworn clothes if their weight changes; between one in six and one in seven (63%-68%), compared to fewer than one in six for those 16-24 and those aged 66+ (58%). Almost one in six of those aged 16-24 would wear more clothes if they checked more regularly what they had in their wardrobe (57%), falling to just over half of those aged 66+ (51%). Over a third of the youngest age group are ‘likely’ to wear more clothes if they could repair or alter their clothes at a high street retailer (36%), falling to below a fifth among those in the oldest age group (18%). People living in Northern Ireland are generally more likely to consider wearing their unworn clothes more often; over a third would be ‘likely’ to wear more if they were able to update their appearance using new accessories (36%) while the overall UK figure is around a quarter (26%). People in Greater London are also ‘likely’ to wear more of their clothes; a third would if they had more spare time to repair or alter their clothes (33%) compared to just over a quarter of the UK overall (27%). Clothing behaviour research 61
11-049455-01 - Clothing report - v6 FINAL - 16 Mar 2012 - INTERNAL USE (1)
Generally, people in bigger households are more likely to consider wearing more of their clothes when presented with the alternatives given. For example, over four in ten of those living in a household with five or more people in it would wear more of their clothes if they could get stains out (42%), falling to below a quarter of people in single person households (24%), and approaching six in ten would wear more of their clothes if they checked more regularly what they had in their wardrobe (58%) falling to just over half in single person households (51%).
Clothing behaviour research 62
11-049455-01 - Clothing report - v6 FINAL - 16 Mar 2012 - INTERNAL USE (1)
4.3
Repairing clothing
Three in five people with unworn clothes could wear them again if they were repaired (62%). The majority of people who could wear them again say they this applies to only a few of these clothes, with over a third saying this (34%). one inown five people could use over half of their that unworn clothes if they were repaired if (19%), Six Nearly in ten unworn clothes could be worn but only a few say that all of their unworn clothes could be worn if they were repaired (seven percent).
repaired (Q27)
Figure 33 (Q27)
How many of the clothes you have not worn would you say could be used if repaired? None
32%
Only a few
34%
Some of them (but less than half) Around half of them Many of them (not all but more than half) Nearly all of them All of them Don’t know
9% 3% 4% 5% 7% 6%
Base: UK adults who have not worn some of their clothes in the last 12 months (6,577), 7-20 December 2011
Younger adults are more likely to own clothes that could be worn if repaired; almost three-quarters aged 16-24 who have not worn some of their clothes feel that at least some of them could be worn if repaired (72%) falling to just over half of those aged 55+ (55%). Those living in Northern Ireland and in London own the most clothing which could be repaired, around seven in ten say this (71% and 68% respectively have at least some compared to 62% in the UK overall). The larger the household they live in, the more likely the person is to have clothing that could be worn if repaired; over seven in ten who live with at least four other people have at least some (72%) falling to around six in ten who live on their own (60%) or with one other person (59%). Those with a higher level of education have more clothing that could be worn if repaired; almost two-thirds of those who hold FE/HE qualifications have at least some (65%) falling to fewer than six in ten with no formal qualifications (58%). Those who are employed are also more likely to own some clothing which could be worn (65% vs. 59%). Others who own more clothing that could be worn if repaired include those who buy clothes for at least one child (68%) and those would like to do more to minimise waste (78%) and to buy clothes that last (67%).
Clothing behaviour research 63
11-049455-01 - Clothing report - v6 FINAL - 16 Mar 2012 - INTERNAL USE (1)
Nearly three-quarters of people are able to sew a button on (74%) and nearly half can darn or patch a hole or take a hem up or down (47% each). Four in ten are able to dye an item themselves (38%), a quarter are able to replace a zip or redesign an item (25% and 24% respectively) and around one in five are able to replace a pocket (20%) or take the item in or out, i.e. change the size (17%). Almost one in five are unable to perform any ofEight these repairs alterations in orten can(18%). perform home repairs (Q28a) Figure 34 (Q28a)
Below is a list of possible repairs or alterations. Which, if any, would you be able to do yourself? Sew a button on
74%
Darn or patch a hole
47%
Take a hem up or down
47%
Dye an item
38%
Replace a zip
25%
Redesign an item Replace a pocket Take in or out
None of them
24% 20% 17%
18%
Base: UK adults (7,950), 7-20 December 2011
Women are much more likely to be able to alter or repair clothes, with more than nine out of ten able to do at least one repair (92%) compared to seven in ten men (72%). More than four in five women can sew a button on (85%), and almost seven in ten can take a hem up or down (67%), compared to only six in ten and a quarter of men (62% and 26%). While almost eight in ten of those aged 16-34 say that they can do at least one repair (78%), well over eight in ten of those 45 and older claim that they can do at least one (84%). Over half of those 66 and over claim that they can darn or patch a hole (55%) decreasing to only a third of those 16-24 (32%). The only alteration that the younger age groups claim to be able to do better than the older is to redesign an item, where almost three in ten of those 16-24 say they can do it (28%) compared to a quarter of those aged 55+ (25%). Smaller households are more likely to be able to sew a button on and to darn or patch a hole; more than three out of four and half of the people in single person households say this (77% and 50% respectively), falling with the number of people in the household increasing. People who aren’t the main shopper and those not responsible for buying or getting rid of clothes are more likely not to be able to carry out repairs; just below two-thirds say this (63%-66% vs. 82% overall).
Clothing behaviour research 64
11-049455-01 - Clothing report - v6 FINAL - 16 Mar 2012 - INTERNAL USE (1)
Over a third of adults would take their repairs or alterations to a tailor or independent store (36%), and almost three in ten would take them to a dry cleaner (28%). One in five would take them to a grandparent (21%) or a spouse/partner Onewho in eight adults undertake the repair themselves’ (12%),(Q28b) while one in ten Most (19%). know canwould repair clothes for them would not know who to go to ask for repairs or alterations on their behalf (10%). Figure 35 (Q28b)
Who, in your local area, would you be able to ask to undertake repairs or alterations on your behalf? Tailor/independent store
36%
Dry cleaner
28%
My parents/grandparents
21%
Spouse/partner
19%
Neighbours, friends or nearby relatives
13%
High street clothing store My children
None of the above
4% 1%
3%
None would undertake myself Don't know
12% 10%
Base: UK adults (7,950), 7-20 December 2011
While both men and women would seek out a tailor first, women are more likely to approach a dry cleaner for repairs, ask a parent or undertake the work herself (26%, 23%, 19% respectively), while men would turn first to a spouse or partner and then consider using a dry cleaner or asking a parent (35%, 30%, 19% respectively). Young people are the least likely to use a dry cleaners for their repair services; fewer than a fifth of those aged 16-24 would go there if they had anything that needed repairing (17%), compared to between a quarter and a third of those older than 25 (26%-32%). People living in Scotland and Northern Ireland are more likely to go to a tailor; more than half of the population would do this, compared to a third in England and Wales (50% and 55% vs. 34% and 33% respectively). People in England, and Greater London in particular, are more likely to go to a dry cleaner to get things fixed; a third in England (31%) and over half in Greater London (54%) compared to three in twenty in Wales (15%) and one in eight in Scotland (12%). A third of people living in single person households would go to a dry cleaner for repairs or alterations (31%), compared to fewer than one in three overall (28%). People in larger households are more likely to go to their parents or grandparents; over a third of those living in households with four or more people in them (35% vs. 21% overall). The same goes for people with children in their household; around a third of those with children in their household would go to parents or grandparents (31%). Half of people with high incomes (£100k+) would go to a tailor (50%), and four in ten would go to a dry cleaner (43%), falling to around half in the lowest income group, those households making less than £10k annually (28% and 22% respectively). The lower earning households are more likely to undertake repairs themselves; a fifth of those in the lowest income group (20%) falling to fewer than one in ten for those in the highest (eight percent). Four in ten of those who want to do more to buy clothes made to last and minimise waste when getting rid of clothes would go to a tailor to get their clothes fixed (39% and 41%), while three in twenty of those who already do everything they can would undertake such repairs themselves (16% and 15%).
Clothing behaviour research 65
11-049455-01 - Clothing report - v6 FINAL - 16 Mar 2012 - INTERNAL USE (1)
More than a third of those who aren’t the main shopper, and just under a third of those who aren’t the main earner, would go to their family to get their clothes fixed or amended, rather than to a shop (35% and 29% respectively). Those responsible for washing and getting rid of clothes would rather undertake repairs and alterations themselves, just under three in twenty say this (14% and 13% vs. two percent and seven percent respectively for those who aren’t).
Clothing behaviour research 66
11-049455-01 - Clothing report - v6 FINAL - 16 Mar 2012 - INTERNAL USE (1)
Over a third of UK adults are interested in learning more about how to repair clothes (37%), with one in seven being ‘very interested’ (14%). Fewer people thought that their partner or spouse would be interested (15%) and so few people thought that their children would be interested that it has not been included on this chart (1% very interested and 2% fairly interested).
Some interest in repair, notably among young women Figure 36 (Q29) (Q29)
How interested, if at all, would each of the following people be in learning more about how to repair clothes? % Not at all interested
% Not very interested
% Fairly interested
% Very interested % Don’t know/ not applicable
You
Your spouse or partner
33
36
22
16
24
11 4
14
7%
33%
Base: UK adults (7,950), 7-20 December 2011
Women are more interested in learning about how to repair clothes, with over half saying that they want to (52%) and a fifth that they are ‘very interested’ (21%). On the other hand, seven out of ten men say that they are not interested (72%) with almost half saying that they are ‘not at all interested’ (46%), compared to just a fifth of women (20%). Almost half of women believe that their partner would be ‘not at all interested’ in learning more about how to repair clothes (47%), while a quarter of men believe that their partner would be interested (24%). Older people are more likely to believe that their partner isn’t interested (50-54% of those 25 and older), compared to two in five of those aged 16-24 (41%).Younger people are more likely to be interested themselves in mending clothes, with over half of those aged 16-34 interested (54%) compared to just a fifth of those over 65 (20%). Over two-thirds of those aged 66+ claim not to be interested (69%) compared to below half of those between 16 and 24 (47%). There are very few significant differences between the regions. In general, people living in Greater London seem to be more keen to learn about how to repair clothes, with over two in five interested, compared to just over a third in the rest of England (43% compared to between 34%-38% in the other regions). People in larger households are more interested than those living in small households. Half of the people living in households with five or more people in them are interested in learning how to repair clothes (49%) while six in ten of those living in single and two-person households aren’t interested (59%). People with children in the households are more interested, mainly because they are more often in larger households; half of those with at least one child in their household are interested (49%) compared to a third overall (37%). It seems as though having children makes people more interested in learning how to mend clothes; half of single parents would be more interested in learning how to fix clothes (50%). Single people and unmarried couples are also more likely to be interested (44% interested vs. 37% overall), but they are also more likely to be young.
Clothing behaviour research 67
11-049455-01 - Clothing report - v6 FINAL - 16 Mar 2012 - INTERNAL USE (1)
Those with FE/HE qualifications are more interested; four in ten would like to learn more falling to three in ten for those without any formal qualifications (40% vs. 31%).Conversely, those with higher incomes are less interested, only a third of those with an annual household income of more than £100k say that they are (35%), compared to more than two in five of those with an income less than £10k (44%). Half of those responsible for buying clothes for more than one person are interested in learning how to repair clothes (49%) and almost six in ten of those responsible for buying clothes for any child are interested (57%). Those responsible for washing and getting rid of clothes are also more interested than those that aren’t; four in ten say this (41% and 38% respectively). People who would like to do more to minimise clothing waste and buy clothes made to last display more willingness to learn, over half say they would like to (53% and 48% respectively), compared to a fifth of those who could do more but aren’t interested in doing so (17% and 21% respectively).
Clothing behaviour research 68
11-049455-01 - Clothing report - v6 FINAL - 16 Mar 2012 - INTERNAL USE (1)
4.4
Borrowing clothing
One in eight people regularly borrow clothing from at least one person (13%), with the majority not doing so (86%) and a small number of people saying that they don’t know (one percent). Relatives and close friends are the most likely people to share clothing, with the most common being a brother or sister (4%) or a close friend (4%), followed by parents or grandparents (3%), a spouse or partner (2%) or children (2%). Very few borrow from other neighbours, friends or relatives (1%) and fewer still borrow from One in eight borrow clothes from others (Q30) their work colleagues (less than one percent). Figure 37 (Q30)
Do you regularly borrow clothes from any of the following people? My brother(s) or sister(s)
4%
My close friends
4% 3%
My parents or grandparents My spouse or partner
2%
My children
2%
Other neighbours, friends or nearby relatives My work colleagues
1% *
I don’t borrow clothes from anyone Don’t know
86% 1%
Base: UK adults (7,950), 7-20 December 2011
It is more common for women to borrow clothes from people. More than nine in ten men say that they don’t borrow clothes from anyone, while this is true of eight in ten women (92% vs. 80%). Around one in fourteen women regularly borrow clothes from their siblings or their close friends (seven percent), and one in twenty women borrow from their parents or grandparents (five percent), the same is only true for one in fifty and one in one in a hundred men respectively. Young people are more likely to borrow clothes; almost a fifth borrow from their siblings or close friends (18% and 17% respectively), and one in eight borrow from their parents (12%). This falls to almost no-one for the oldest age group. Hardly anyone in the 66+ group borrow any clothes (98% do not borrow from anyone), falling to one in six among those aged 16-24 (59%). Over a third in this group borrow from at least one person (37%), falling to one in fifty for those aged 66+. Those living in Northern Ireland are more likely to borrow from at least one person; a fifth claim to do this (21%), compared to just over one in ten for the other regions (13%). People with children in their households, and bigger households in general, are more likely to borrow clothes. Around a fifth of households with at least one child in them borrow clothes for at least one person (20%), and three out of ten households with a pregnant woman in it borrows clothes (29%), mostly from friends and siblings (11% each). Over a fifth of households with five or more people borrow clothes (22%), falling to under one in ten for two-person and single households (nine percent and eight percent respectively).
Clothing behaviour research 69
11-049455-01 - Clothing report - v6 FINAL - 16 Mar 2012 - INTERNAL USE (1)
4.5
Discarding clothing
4.5.1 Current practice The vast majority of adults in the UK take at least some responsibility for getting rid of their clothes (94%), with over a third taking sole responsibility (36%), and nearly one in five ‘mostly’ taking responsibility (18%). A quarter share Very responsibility (25%) and justtake a few never takeresponsibility responsibility (six percent).for getting few don’t any
rid of clothes (Q44)
Figure 38 (Q44)
Which of the following best describes the extent to which you are responsible for getting rid of clothes in your household? Never take responsibility
6% Sometimes take responsibility
15%
Take sole
36% responsibility
Share equal responsibility
25% 18% Mostly take responsibility
Base: UK adults (7,950), 7-20 December 2011
Women are more likely than men to take at least some responsibility for getting rid of clothes in the household (97% vs. 92% of men), with more women than men taking sole responsibility (45% vs. 27% of men) or mostly taking responsibility (27% vs. nine percent of men). Men are more likely to share responsibility for getting rid of clothes, with a third saying they do this compared to 16% of women. They are also more likely to say they sometimes get rid of clothes, or never do it (22% vs. nine percent of women, and eight percent vs. three percent of women respectively). The youngest age group are less likely than other ages to take at least some responsibility (84% vs. 94% overall), or be solely responsible for this (16% vs. 36% overall). This group are more likely than others to never take responsibility for getting rid of clothes, with 16% saying this compared to six percent overall. Household factors play a role in an expected fashion; people living alone are more likely to take sole responsibility for getting rid of clothes (86% vs. 36% overall), as are single people (63% vs. 20% of people in a couple). People living in households of two are more likely to share responsibility for getting rid of clothes, with over a third saying they do this (36%) this, compared to a quarter overall, as are people in a couple (34% vs. nine percent of single people). People without any children in the household are more likely to take at least some responsibility for getting rid of clothes (95% vs. 93% with at least one child), and particularly are more likely to take sole responsibility (38% vs. 29%).
Clothing behaviour research 70
11-049455-01 - Clothing report - v6 FINAL - 16 Mar 2012 - INTERNAL USE (1)
Income also plays a part, with the tendency of sharing responsibility or sometimes taking responsibility rising steadily with household income; for example one in eight people in households earning less than £10k a year share responsibility (12%) compared to a third of those in households earning between £55,000-£99,999 a year (34%). This trend stops with the highest earners, dropping slightly for those earning over £100k. Equally the likelihood of taking sole responsibility declines as household income increases, with two-thirds of people in households earning less that £10k a year saying they are solely responsible (65%) and a fifth of people in households earning over £100k a year (18%). People who are the main shopper are more likely to take at least some responsibility for getting rid of clothes (96% vs. 81% who are not), and particularly take sole responsibility (39% vs. six percent) or mostly take responsibility (19% vs. nine percent). Furthermore, people who are responsible for buying clothes and washing clothes, are more likely to also take responsibility for getting rid of clothes; 95% of people who are responsible for buying clothes have at least some responsibility for getting rid of clothes, compared to 81% of people who are not responsible for buying clothes; and 97% who wash clothes are also responsible for getting rid of them, compared to 81% who do not wash their own clothes.
Clothing behaviour research 71
11-049455-01 - Clothing report - v6 FINAL - 16 Mar 2012 - INTERNAL USE (1)
More than seven in ten people have donated at least some of their clothes to a charity shop in the last twelve months (73%), with four in ten donating at least half of their unwanted clothes here (41%). Over half of people used at least some of their discarded clothes for rags (53%), and almost half of people put at least some of their clothes in the bin as garbage (48%). Other popular ways of getting rid of clothes in the last 12 months have been doorstep or kerbside collection by a registered charity (42%), by taking them to a textiles bin (37%), donating them to friends or relatives (35%), and taking them to a household recycling centre (33%). Fewer than three in four use other methods, such as donating directly to people in need (22%), selling clothes online (21%), and donating to a jumble sale (16%). Figure 39 (Q45a)
Nearly half put how clothes bin, most take In the last 12 months, many ofin thethe clothes which you got rid of,to have you charity shops (Q45a) done so in the following ways? % All % Some % None, didn't know available
% Many % A few % None, chosen not to
Donated them to a charity shop
9
Used for rags
132
Put them in the bin Doorstep / kerbside collection of clothes organised by registered charity Taken them to textiles / clothing bin (e.g. at supermarket car park) Donated them to friends and relatives Taken them to a household recycling centre / tip (rubbish dump)
25
7
15
2 3 2 10 13
12
Cash for Clothes shop
52
4 4
31
57
5
32
57
4
9
Taken them to clothes swapping parties / events
43
4
15 9 31
Given away online (e.g. Freecycle, Freegle)
49
16
13 2 7
Doorstep / kerbside collection of clothes organised by textile trader
44
42
3 4
2 4 2 11 13 2 7
Doorstep / kerbside collection of clothes organised by the council
22
39
1 4 2 11
Sold clothes online (e.g. eBay)
Car boot sale
11
21
12 15
14 31
31
4 10 3 2 6 3
19
32
Donated directly to people in need (i.e. homeless / neighbours)
Donated to jumble sale
% About half % None, no access % Don't know
5 3
121 6 7 7 2 *11 5 5 6 1 121 4 5
8
1113 4 7 5 *113 3 5 8 1112 3 7 * 2 ** 2 8
10 8
8
65
5
70
5
69
5
75
5 66
5
72
6
74
6
69 74
5 5
Base: UK adults who have at least some responsibility for getting rid of clothes (7,530), 7-20 December 2011
Men and women are not very different when it comes to getting rid of clothes through jumble sale, cash for clothes shops, doorstep/kerbside collection organised by the council or textile traders, selling clothes online, or clothes swapping events. However, in each of the other methods there are differences in behaviour. Men display greater willingness than women to throw away clothes in the bin (51% of men throw at least of some of the clothes they throw away in the bin vs. 46% for women) and nine percent of men throw at least half of their clothes in the bin, compared to five percent of women. Over a third of men take clothes to a household recycling centre or a tip (36% vs. 31% of women) and over half use old clothes for rags (54%, compared to 51% for women). Women are more likely to donate clothes to a charity shop (81% donated at least some of their clothes in the last twelve months vs. 65% of men), participate in doorstep/kerbside collection of clothes organised by a charity (46% vs. 38%), donate to friends or relatives (44% vs. 24%), sell clothes online (27% vs. 14%), donate directly to people in need (24% vs. 20%), and participate in a car boot sale (15% vs. 10%). When it comes to putting clothes in a textile bin, the youngest age group and the older respondents seem more reluctant, whereas the middle age groups, 25-54, seem more likely to do so; two-fifths responding that at least some of their clothes have been disposed of this way (39%), compared to three in ten of those aged 16-24 (28%), and 36% of those older than 55 years.
Clothing behaviour research 72
11-049455-01 - Clothing report - v6 FINAL - 16 Mar 2012 - INTERNAL USE (1)
In the case of the less popular alternatives, young people are more likely to have taken at least some of their clothes to a swap party (nine percent among the 16-24 year olds falling to one percent of those over 65) and participate in doorstep/kerbside collection of clothes organised by a textile trader (13% of those between 16 and 44 having taken part vs. only eight percent of those aged 45 and above). Over one in ten of the youngest age group have used a ‘Cash for Clothes’ shop for at least some of their clothes (12%), falling to fewer than one in twenty of the oldest group (three percent). Similarly, younger people are more likely to participate in car boot sales (16% of the youngest age group have used this for at least some of their clothes in the last twelve months, compared to only six percent of the oldest age group), to give away clothes online (11%, compared to only five percent of those 66 or older), and younger people are more likely to donate clothes directly to people in need (26% of those aged 16-44 have done this for at least some of their clothes, compared to just 20% of those 45 and older). Younger people are more likely to sell clothes online (32% of those aged 16-34 did this for at least some of their clothes in the last twelve months vs. 10% of those 66+) and to put old clothes in the bin (52% of those 16-34 vs. 38% of those 66+). The younger segment of the population is also more likely to donate old clothes to friends (44% of those aged 16-24 have done at for at least some of their clothes in the last twelve months, falling to 24% for those aged 66+). Older people are more likely to use charity shops; almost half of those aged 66+ have used doorstep/kerbside collection of clothes (46%, falling to 36% of the youngest segment) and more than half have donated at least half of their old clothes to a charity shop (53% vs. 38% of the youngest age group). People in Northern Ireland use ‘Cash for Clothes’ shops more frequently than in the rest of the UK; three in ten have used it for at least some of their clothes in the last twelve months (29% vs. eight percent overall), with almost three in twenty using it for more than half of their clothes (14% vs. three percent overall). Northern Irish people are also more likely than the rest of the UK to donate directly to people in need; over a quarter have done this with at least some of their clothes (28%), compared to a fifth overall (22%). Welsh respondents donate old clothes to friends and relatives more frequently than the rest of the UK; almost one in four say this (39% vs. 35% overall), the same number as London which is the highest in England. People living in Scotland use doorstep/kerbside collections by charity and council less than in the rest of the UK; six in ten and over eight in ten have not used it in the last twelve months (59% and 86% vs. 54% and 82% overall respectively). Fewer than half of Scottish people use old clothes for rags (46%), while six in ten Northern Irish people do this (60% vs. 53% overall). People in the highest income group are less likely to have used car boot sales to get rid of clothes; over nine in ten say they haven’t in the last twelve months (91% vs. 82% overall). People with children are more likely to have used the internet to get rid of clothes; over a third have sold clothes online (34% vs. 21% overall) and almost three in twenty have given away clothes for free (13% vs. 8% overall).
Clothing behaviour research 73
11-049455-01 - Clothing report - v6 FINAL - 16 Mar 2012 - INTERNAL USE (1)
Three quarters of those who sometimes get rid of clothes by putting them in the bin state that these clothes could never be used again for any purpose (75%), by far the most common response. More than one in three think that the items they throw away are too personal to dispose of in any other way (37%) and around a quarter do not think that their old clothes have any monetary value (26%). Fewer than one in ten stated any other reason; lack of space to store clothes (eight percent), no nearby facilities for recycling (seven percent), no regular doorstep/kerbside collection (six percent), too inconvenient to use facilities (six percent), too time consuming (five percent) or that they are not aware of any alternatives (three percent). Figure 40 (Q46)
Clothes are put in the bin when they could not be
For those clothing items which you put in the bin, what are the main reasons used any purpose (Q46) why youfor do this?
75%
This item could never be used again for any purpose
37%
Items are too personal to get rid of another way
26%
The items have no monetary value
8%
Lack of space to store until I can recycle /reuse
7%
No nearby facility for recycling or reuse No regular doorstep collection for recycling/reuse
6%
Too inconvenient to use facilities for recycling/reuse
6%
It is too time consuming to use facilities
5% 3%
Not aware of any alternatives Other
*
Don't know
1%
None of the above
1%
Base: UK adults who sometimes get rid of clothes through household waste (3,609), 7-20 December 2011
Women are more likely than men to cite that items put in the bin could not be used for any other purpose (79% vs. 71%) and that items are too personal to dispose of in any other way (44% vs. 30%). Men more often put clothes in the bin because they have no monetary value (29% vs. 23%), and are more likely to claim that it is too inconvenient (eight percent vs. four percent) or time consuming (seven percent vs. four percent) to use recycling facilities. Older people are more inclined to say that their old clothes cannot be used for any other purpose; more than three in four (77%) of those 35 or over use this as their excuse for putting clothes in the bin, compared to seven in ten of those aged 16-34 (70%). Younger people are more likely to cite lack of space (13% of those aged 1624 falling to just three percent of those 66+) and that they were not aware of the alternatives (six percent of those aged 16-24, falling to three percent of those aged 66+). Northern Irish people are less likely than the rest of the UK to answer that items could never be used for any purpose (69% vs. 75% overall), and more likely to answer that the items have no monetary value (38% vs. 26% overall).
Clothing behaviour research 74
11-049455-01 - Clothing report - v6 FINAL - 16 Mar 2012 - INTERNAL USE (1)
The variations in household size are small. Predictably, larger households are more likely to cite lack of space for reasons why clothes are thrown away in the bin (11% of those with five or more people vs. eight percent overall), and single person households are more likely to say that items they throw away have no monetary value (29% vs. 26% overall), that there are no nearby facilities (nine percent vs. seven percent), and that there isn’t a regular doorstep/kerbside collection service available (eight percent vs. six percent). Widows are more likely to say that items are too personal to sell or to get rid of any other way than throwing them in the bin, almost half say this (49%) compared to just over one in three overall (37%). People who claim not to be the main earner in a household are more likely to say that the items they throw away cannot be used for anything else (80% vs. 72% of those who are the main earner) and that the items are too personal to get rid of in any other way (41% vs. 37%). Those who are the main earners are more likely to cite that the items have no monetary value (27% vs. 23% of those who aren’t the main earner). People who aren’t responsible for buying clothes for others are also more likely to cite this as a reason (35% vs. 26% overall). Those responsible for buying clothes for others are more likely to claim that the clothes they throw away are too personal to get rid of any other way (42% vs. 37% overall), and those who are responsible for buying clothes for children more often state that the items couldn’t be used for any other purpose (85% vs. 75% overall). People responsible for washing clothes are more likely to claim that items are too personal to get rid of in any other way (40% vs. 22% of those not responsible) and lack of space (8% vs. two percent). Those with higher value wardrobes are more likely to say that items are too personal to get rid of any other way; almost half of those with a wardrobe full of clothes worth more than £5000 say this (47%), compared to just three in ten for those with clothes worth less than £500 (30%). Those who could do more to minimise waste when getting rid of clothes are more likely to claim that items have no monetary value or that they have lack of space than those who already do everything they can to minimise waste (29% and 13% vs. 26% and eight percent overall). They are also more likely to claim that it is too inconvenient and time consuming to use recycling facilities (eight percent vs. six and five percent overall).
Clothing behaviour research 75
11-049455-01 - Clothing report - v6 FINAL - 16 Mar 2012 - INTERNAL USE (1)
4.5.2 Future practice Almost a third of people would be incentivised to sell more clothes online or through community sales if they thought there was a sufficient financial reward for it (30%), while a quarter would sell more if they had more spare time (25%). One in five would do so if their clothes were of better quality or worth more (20%) and just over one in ten would do so if they knew more about selling items online (11%) or about facilities nearby (also 11%). Fewer than one in ten would sell more clothes if they believed it would help the environment (eight percent) and even fewer would if they had more trust in selling thing online (seven percent), or if they were charged directly for the amount of household waste they produced (five percent). One in twenty people are already selling all of their unwanted clothing online or through community sales (five percent) with a third not interested in selling second hand clothes at all (35%). Figure 41 (Q47)
Money would drive people to sell more second hand
What, if anything, would result in you selling more clothing online or through clothingsales (Q47) community (e.g. car boot)?
30%
If I thought I could get reasonable amount of money
25%
If I had enough spare time available
20%
If my clothes were of better quality /worth If I knew more about selling items online
11%
If I knew more about the different places near me
11% 8%
If I believed it would help the environment
7%
If I had greater trust that selling online is secure
5%
If I was charged directly for amount of household waste If someone I trusted recommended doing it If I was aware of other people I know doing this If most people considered this the right thing to do Other
4% 3% 3% 1%
Don't know
5%
Nothing, I already sell all unwanted clothes online
5% 35%
Nothing, I do not wish to do this
Base: UK adults who have at least some responsibility for getting rid of clothes (7,530), 7-20 December 2011
Men are more likely to be uninterested in selling second hand clothes than women, almost half of men (45%) are unwilling to consider this, compared to just a quarter (26%) of women. Women are more likely to already sell all their unwanted clothes online (six percent vs. three percent of men), and are more likely to be incentivised by the alternatives offered. More than a third of women (35%), compared to just a quarter of men (23%), would sell more clothes if they thought they could get a reasonable amount of money for them, and 29% (vs. 19% of men) would do so if they have more spare time. A quarter would sell clothes if they were of better quality and worth more (25% vs. 16% of men) and 15% (vs. eight percent of men) would be incentivised if they knew more about selling online or more about the nearby facilities than they do now (13% vs. eight percent of men).
Clothing behaviour research 76
11-049455-01 - Clothing report - v6 FINAL - 16 Mar 2012 - INTERNAL USE (1)
In general, younger people are more keen on selling things second hand than older people. Almost half of those in the 16-24 age category would sell more things if they thought they could get a decent amount of money for it (44%), falling to just one in five of those 66+ (18%). Similarly, the younger age categories are more likely to sell second hand clothes if they had more spare time (32% falling to 11%), if their clothes were of better quality (27% falling to 14%) and if they knew more about nearby places to sell clothes (15% falling to eight percent). More than one in ten of the youngest age category would also sell more clothes online if they had more trust in selling things on the internet (12% vs. seven percent overall). Over half of those aged 66 years and older would never sell clothes (56%) falling to just 16% of those aged 16-24. People in Scotland are more likely than the rest of the UK to be reluctant to sell second hand clothes, four in ten saying that they do not wish to do it (40% vs. 35% overall). People in Northern Ireland are the most positive (only 24% saying that they don’t want to). Single person households are more reluctant to sell second hand clothes, almost half do not wish to do it (44%) falling to a quarter of those in a household with five or more people in it (23%). Over a third of those in a household with four or more people in it would sell more clothes if they had more spare time (34%), falling to just one in five of those in a single person household (19%). Unemployed people are less likely to want to take part in selling second hand clothes, as are those who have no qualifications. Over four in ten (42% unemployed and 45% without qualifications) say that they don’t want to (compared to 29% of those who are employed and 33% of those with FE/HE qualifications. However, at the same time, those who are the main earner are more reluctant to take part compared than those who are not, only a quarter would sell clothes if they thought they could get a reasonable amount of money for it (27%), compared to a third of those not being the main earner (36%). Those with children in their household are more likely to sell clothes, whereas four in ten of those without children don’t want to take part (40%). Over half of those not responsible for buying clothes (55%) and almost half of those who aren’t responsible for washing clothes (49%) aren’t interested in selling second hand clothes. Those responsible for buying clothes for more than one person, and for children especially, are more likely to take part; 40% and 48% respectively would sell clothes if they thought they could get a reasonable amount of money for them. People who would like to do more to buy clothes made to last and to minimise waste when buying clothes are more likely to consider selling clothes than those who aren’t interested in doing so; around a fifth don’t want to (23% and 19% respectively), compared to almost half of those who are not interested (45% and 47%).
Clothing behaviour research 77
11-049455-01 - Clothing report - v6 FINAL - 16 Mar 2012 - INTERNAL USE (1)
One in five people who had already admitted to putting at least some of their unwanted clothing in the bin went on to say that they already give all their unwanted clothes to an organisation which reuses or recycles them (21%). This anomaly might be explained by the slight change in wording of the question, where before we asked about ‘clothes they have got rid of’ and later ‘unwanted clothes’. Very few do not wish to give their clothes away for recycling or reuse (seven percent) and over a third of people would be happy to give clothes to such organisations if they thought that they would be of value (35%). Almost a quarter would do so if there was a facility for putting it in a bin was near their home (24%), around one in five would if doorstep/kerbside collection by charities was extended (20%), or if they could get loyalty points for a household retailer (18%), a high street voucher (also 18%) or a small amount of money in return (15%). One in eight people would give more unwanted clothes to these organisations id they believed it would help the environment (13%) and a further seven percent would do so if someone else that they trust recommended doing it. Charging people directly for the amount of household waste that they throw out would result in one in fourteen people who get rid of clothes through household waste giving more to these organisations (seven percent). Figure 42 (Q48)
Clothing would be recycled for money or if it were What, if anything, would result in you giving unwanted clothes to an made easier organisation which(Q48) reuses or recycles them rather than put them in your household waste collection? 35%
If I thought that damaged /heavily worn clothing was of value
24%
If there was a communal bin for old clothes / textiles near my home
20%
If more charities were to organise a doorstep / kerbside collection If I could get loyalty points for a household retailer
18%
If they gave me a high street voucher in exchange
18% 15%
If they gave me a small amount of money
13%
If I believed it would help the environment If I was charged directly for amount of household waste
7%
If someone I trusted recommended doing it
7%
If I was aware of other people I know doing this
3%
If most people considered this the right thing to do
3%
Other Don't know
1% 5% 21%
Nothing I already give all my unwanted clothes to organisations Nothing, I do not wish to do this
7%
Base: UK adults who sometimes get rid of clothes through household waste (3,609), 7-20 December 2011
On average, women are more likely to consider alternatives that would make them give away more clothes to an organisation which reuses or recycles them; over a third would if they thought heavily used clothes were of value (37% vs. 34% of men), Over a quarter would if there was a textile bin clothes to their house (26% vs. 22% of men), and only four percent are not interested, compared to nine percent of men.
Clothing behaviour research 78
11-049455-01 - Clothing report - v6 FINAL - 16 Mar 2012 - INTERNAL USE (1)
Older people are more likely to be motivated by believing that their old worn clothes are of value to organisations that reuse or recycle clothes. Fewer than one in three of those in the youngest age group give this as a motivator (29%), whereas the number increases to almost two in five for those in the 66+ category (38%). Younger people are more likely to give clothes away; around a quarter say this if they could get loyalty points for it (23% of those aged 16-34 falling to seven percent of those 66 and over), if they got a high street voucher in exchange (25% of 16-34 falling to seven percent), and if they got a small amount of money for it (22% of 16-24 falling to five percent of those 66 and over). Older people are more likely to say they aren’t interested (10% of those 66 and over vs. seven percent overall) but are also more likely to be giving away most of their clothes to organisations already; more than one in four say this (27%, falling to 14% of those aged 16-24). There are few regional differences within the UK. People in Northern Ireland are more likely to be incentivised if they believed that it helped the environment (21% vs. 13% overall) and if they were aware of other people doing it (seven percent vs. three percent overall). People living in Greater London would be significantly more likely to give away clothes if there was a communal textile bin close to their house (31% vs. 24% overall), if more charities organised doorstep/kerbside collection (30% vs. 20% overall), or if they got loyalty points or a high street voucher for it (24% and 20% vs. 18% and 15% respectively overall). Larger households are more likely to be incentivised by loyalty points and high street vouchers. More than one in five (21% and 23% respectively) of households with five or more people in them would be incentivised by this (vs. 15% and 16% of single person households). Households with young children are more likely to be incentivised by high street vouchers, with a quarter of households with a child between 0 and 3 saying this (27%, compared to 18% overall). Unemployed people and those who aren’t the main earner are more likely to already give all their unwanted clothes to organisations (23% each vs. 21% overall). People who could do more to minimise waste when buying clothes are more likely to be incentivised, only three percent not wishing to do any of the alternatives, compared to 14% of those who aren’t interested in doing more to minimise waste.
Clothing behaviour research 79
11-049455-01 - Clothing report - v6 FINAL - 16 Mar 2012 - INTERNAL USE (1)
Almost two-thirds of people claim that they already do everything they can to minimise their contribution to clothing waste (65%). More than one in ten could do more but they aren’t interested in doing so (11%), while almost a quarter could do more and would like to do so (24%).
One quarter would like to do more to cut back on waste (Q49)
Figure 43 (Q49) clothing
Which of the following best describes your view about getting rid of clothes? I could do more to change my current purchasing and use of clothing in order to reduce waste BUT I am not interested in doing so
11% I could do more to cut back on unnecessary clothing purchases and to repair and maintain clothes AND would like to do so
24% 65%
I already do everything I can to minimise my contribution to clothing waste
Base: UK adults (7,950), 7-20 December 2011
Women are more likely to claim that they do everything they can (66% vs. 64% for men) and want to do more (26% vs. 22%). Men are more likely to not be interested in doing more than they do now; 14% say this compared to seven percent of women. Older people are more inclined to say that they do everything they can, three quarters saying that they do this (75%), falling to just under half of those aged 16-24 (47%). Younger people are more likely to say that they could do more (36% of those aged 16-24, falling to 15% of those aged 66+) but are also the most likely group to say that they aren’t interested in doing so (17% of those aged 16-24 vs. 11% overall). People living in Northern Ireland are the most likely to say that they could do more (37% vs. 24% overall), and they are the least likely to say that they do not wish to do so (eight percent vs. 11% overall). Almost three in ten of those living in Greater London could do more to minimise clothing waste (28% vs. 24% overall). Larger households are more likely to say that they could do more, more than one in three of those living in a household with five or more people say this (34%), falling to just a fifth of those living in a single person household (20%). Over two-thirds of single and two person households claim that they already do everything they can to minimise waste (68%), falling to 57% for those in households of five or more people. Those unemployed are more likely to claim that they already do everything they can to minimise clothing waste (69% vs. 62% employed) and those who aren’t the main shopper are more likely to say that they aren’t interested in doing more than they currently do. Households with small children are more likely to say that they could do more; 31% of those with a child 0-3 in the household say this. The same goes for those responsible for washing and getting rid of clothes (25% and 24% vs. 19% for those who aren’t).
Clothing behaviour research 80
11-049455-01 - Clothing report - v6 FINAL - 16 Mar 2012 - INTERNAL USE (1)
5.0
Laundry
This final section reports on people’s laundry practices, including sorting clothes, wash loads and temperatures, drying and ironing. Questions were asked about what might encourage people to engage in practices such as sorting clothes more often prior to washing, washing clothes less often, washing at a low temperature, using more full loads, tumble drying less often and ironing clothes less often, and to identify the behaviours that they were most likely to change. They were also asked about their laundry facilities. A key initial finding is the influence of gender in laundry practices. Two-thirds of women take sole responsibility for washing clothes (66%), whereas only one in four men do likewise (26%). One in five men never take responsibility for washing clothes (20%), whereas in the case of women the proportion is minimal (three percent). Questions about people’s laundry facilities reveal that most own a washing machine (85%) or washer drier (16%) and an iron (90%), whereas well under half own a tumble drier (44%) and very few own a spin drier (six percent) or twin tub (less than one percent). Over two-thirds have an outdoor clothes line (69%) and a similar proportion a clothes rack for indoors (69%); just under one in five have a clothes line indoors (18%). Some evidence of good practice was revealed. For example, around nine in ten respondents wait for a full load either ‘always’ or ‘more often than not’ (89%) and almost two-thirds wash clothing at 30 degrees or less at least ‘half the time’ (64%). Older people are less likely always to use a full load (39% of people aged over 65 vs. 45% overall), whereas the practice of washing at a low temperature is not age-related. Some, however, wash clothing at a high temperature; around one in six respondents ‘mostly’ use a temperature above 40°C (16%). In addition, only a small majority sort their washing according to temperature requirements at least ‘half the time’ (61%); those who did so are more likely to be older (72% of people aged over 55). One in five of those who own a tumble drier use it in summer at least ‘half the time’ (21%); this was especially likely for men (25% vs. 18% of women). Lastly, ironing is considered important by nearly two-thirds of respondents (64%), particularly older people (71% of those over 55). The survey then addressed people’s willingness to change their behaviour and the means by which this might be achieved. In all cases older people are more likely to express unwillingness to change. Nearly four in ten respondents would ‘seriously consider’ washing items worn only once less often (39%), with young people more likely to change their behaviour (44% of people aged 16-34). Attitudes are strictly divided, however; more than one in three do not wish to change their current practice (37%). The greatest influence is odour; nearly half of respondents would do so ‘if my clothes smelt fresher for longer’ (47%). This was especially true for younger people (58% of 16-34 year olds) and women (50% vs. 44% of men). Around a third of respondents would seriously consider washing their clothes at 30 degrees more often (34%) and only one in eight are unwilling (12%). The key factor is cleanliness; six in ten would wash at 30 degrees more often ‘if I felt my clothes would be clean’ (59%), while just over a third would do so if more labels said that the recommended temperature was 30 degrees (36%) and just under a third if clothes smelt fresher for longer (31%). Most people already wash full loads. Of those who do not, a third do not wish to change (34%). Those willing to change are more likely to be aged 55-65 (35% vs. 31% overall). One in five of those who use a tumble drier do so in the summer at least ‘half the time’ (21%) but only a quarter of those who use a tumble drier do not wish to change their behaviour (24%). The main factor that would lead to change, cited by over a third of respondents who use a tumble drier, is if more clothing was made of fabrics that dry quickly (35%). Other influences are having more space to hang clothes (cited by just under a third – 32%) and if energy prices continue to increase (30%).
Clothing behaviour research 81
11-049455-01 - Clothing report - v6 FINAL - 16 Mar 2012 - INTERNAL USE (1) Finally, there are several types of behaviour for which change appears less likely. Many people expressed a reluctance to sort washing more often according to the appropriate temperature or length of wash (only 15% would consider the former, 18% the latter). Many of those who do not always sort between clothes that require a longer a wash and those that don’t would not seriously consider changing (44%). Likewise, over a third of respondents would be unwilling to iron clothes less often (35%), although a similar proportion would do so if clothes were made out of fabrics that ‘kept their shape more’ (36%). In summary, laundry practices appear in transition. There is evidence of good practice, in that a high proportion of people wash full loads and at low temperatures, but there are also many people who do not normally sort clothes and some who use tumble driers in summer. In general, changing the behaviour of older people is likely to prove more difficult. Lastly, the behavioural change in which the greatest proportion of people expressed an interest is wearing clothes for longer before putting them in the laundry.
Clothing behaviour research 82
11-049455-01 - Clothing report - v6 FINAL - 16 Mar 2012 - INTERNAL USE (1)
5.1
Current practice
Almost nine in ten adults have at least some responsibility for washing clothes (89%) and nearly half take sole responsibility (47%). Only one in ten never take responsibility for washing clothes (11%).
Nine in ten have at least some responsibility for washing (Q31) Figure 44 (Q31)
Which of the following best describes the extent to which you are responsible for washing clothes in your household, whether this is done at home or in a laundrette? Never take responsibility
11% Sometimes take responsibility
14% sole 47% Take responsibility
Share equal responsibility
15% 13% Mostly take responsibility
Base: UK adults (7,950), 7-20 December 2011
Women are more likely than men to have at least some responsibility for washing clothes (97% vs. 80% of men). They are also more likely to take sole responsibility for washing clothes; two-thirds of women (66%) compared to only a quarter of men (26%). People aged between 25 and 54, rather than people at the older or younger extremes, are most likely to take at least some responsibility for washing clothes in their household (93% vs. 89% overall); over nine in ten 35-44 year olds have at least some responsibility (95%), compared to just over three-quarters of people aged over 65 (76%). Younger people, on the other hand, are more likely to sometimes take responsibility for washing clothes (26% of 16-24 year olds vs. 14% overall), or share responsibility for washing clothes (22% of people aged 16-24 vs. nine percent of people aged 66+). Individual responsibility for washing clothes declines with the size of the household, with nearly all people living alone taking at least some responsibility for washing clothes (96%), compared to just under nine in ten overall (89%). This figure is largely due to the fact that over nine in ten people living alone take sole responsibility for their washing (92% vs. 47% overall). Similarly, single people are more likely to take sole responsibility for washing their clothes (67% vs. 35% of people in a couple) and people in a couple are more likely to share responsibility for washing clothes (18% vs. nine percent of single people). Over half of all unemployed people take sole responsibility for the washing compared to two in five employed people (51% compared to 43%). Those who see themselves as the main shopper are more likely to take at least some responsibility for washing clothes (91% vs. 61% who are not the main shopper), and it is also far more likely that they take sole responsibility for laundry (51% vs. three percent who are not the main shopper). This probably reflects the gender differences, with women more likely to be the main shopper in the household.
Clothing behaviour research 83
11-049455-01 - Clothing report - v6 FINAL - 16 Mar 2012 - INTERNAL USE (1)
The majority of adults will wear at least some clothes more than once before putting them in the laundry (97%), leaving a small proportion who will wash all of their clothes after just one wear (three percent). Within this question, it must be noted that the figures presented here are the average for the UK population so, while some items (such as skirts) might not be owned by very many men, the percentage quoted within Figure 45 is the average across both genders. More in-depth analysis is shown below the chart. Figure 45 (Q32)
Most clothing worn more than once (Q32)
Which, if any, of the following types of clothes do you tend to wear more than once before putting it in the laundry? Jeans Trousers Jumper/Knitwear (e.g. cardigan/sweater) Fleece/bodywarmer Nightwear Sweatshirt/Hoodie Suit Ties Shorts/cropped trousers T-shirt/polo shirt Skirt Top Shirt Dress Leggings Socks Blouse Underwear/lingerie Sportswear Swimwear Other Never wear clothes more than once before laundry
77% 73% 67% 54% 52% 49% 45% 38% 36% 33% 29% 28% 24% 21% 15% 14% 12% 10% 10% 8% * 3%
Base: UK adults (7,950), 7-20 December 2011
Clothing behaviour research 84
11-049455-01 - Clothing report - v6 FINAL - 16 Mar 2012 - INTERNAL USE (1)
The vast majority of adults who have at least some responsibility for washing clothes, own an iron (90%) and likewise a washing machine (85%). The majority also have an outside clothes line and/or a clothes rack at home (69% for both) and just under half have an airing cupboard (44%) or a tumble dryer (44%). Fewer than one in five have an indoor clothes line (18%) or a combined (16%) and very few have a spin dryer in Most household items arewasher/dryer prevalent (Q34) their home (six percent). Figure 46 (Q34)
Which, if any, of the following do you have at home? An iron
90%
A washing machine
85%
A clothes line (outside)
69%
A clothes rack
69%
An airing cupboard
44%
A tumble dryer
44%
A clothes line (inside)
18%
A washer/dryer
16%
A spin dryer
6%
A twin tub
*
None of the above
*
Don't know
*
Base: UK adults who have at least some responsibility for washing clothes (7,068), 7-20 December 2011
Women are more likely than men to have an iron (91% vs. 88%), a washing machine (88% vs. 82%), an outside clothes line (70% vs. 67%), a clothes rack (70% vs. 66%) and a tumble dryer (46% vs. 42%) at home, whereas men are more likely to have an airing cupboard (45% vs. 43%), a washer-dryer (18% vs.15%) or a spin dryer (eight percent vs. four percent). The ownership of irons, outside clothes lines, and airing cupboards increases with age. For instance over nine in ten people aged over 65 have an iron at home (95%) compared to around four in five people 25-34 (85%), three-quarters of people aged over 65 years have an outside clothes line at home (75%), compared to around three in five people aged 25-34 (58%) and over three in five people aged over 65 have an airing cupboard (62%) compared to under a third of 25-34 year olds (30%). Those living in Northern Ireland are more likely to own a tumble dryer than the rest of the UK (65% vs. 44% overall), and those living in Northern Ireland and Wales are more likely to have an outside clothes line than the rest of the UK (78% vs. 69% overall). People who live in Greater London are least likely to have an outside clothes-line (45%) or a tumble dryer (28%). The likelihood of having these items at home also varies with household size. People living alone are generally less likely to have these items with the exception of a washer dryer (18% vs. 16% overall). In a similar fashion, people in a couple are more likely than single people to have these household items at home, such as a tumble dryer (49% vs. 36% of single people) or an outside clothes line (74% vs. 61% of single people). Larger households (of 4 or more) are more likely to own a tumble dryer (56% vs. 44% overall). People with children are more likely than people without to have a tumble dryer (50% vs. 41%), and also an outside clothes line (73% vs. 67%). However, almost half of those people with no children have an airing cupboard, compared to fewer than four in ten people with children (46% vs. 39%).
Clothing behaviour research 85
11-049455-01 - Clothing report - v6 FINAL - 16 Mar 2012 - INTERNAL USE (1)
The ownership of these items is also related to household income, with greater proportions of people with higher incomes owning these things. Just over half the people in a household earning less than £10k have an outside clothes line (56%) compared to seven in ten people earning over £10k (70%). The likelihood that someone owns a clothes rack also increases with income (74% of households with an income of over £35k vs. 58% of households with an income of less than £10k), as with an airing cupboard (47% vs. 33%) and a tumble dryer (50% vs. 34%).
Clothing behaviour research 86
11-049455-01 - Clothing report - v6 FINAL - 16 Mar 2012 - INTERNAL USE (1)
Most people wash at a full load at least half of the time (95%), and almost two-thirds of adults wash their clothes at 30 degrees or less, or on an eco setting, at least half the time (64%). Three in five people regularly sort their washing between those which require a hot wash and those that don’t (61%), and over half sort their washing between those that require a longer wash and those that don’t (55%). Of those who own a tumble dryer, almost two-thirds use it at least half the time during the winter (63%), however over two in five never use it during the summer (44%). Figure 47 (Q35a)
When washing clothes, how often, if at all, do you do each of the following? % Always
% More often than not
% About half
45
Wash a full load
21
26
Wash at 30 degrees or less, or on an eco-setting (if available)
21
27
**
Sort washing between those which require a hot wash and those that don’t
**
16
36
Sort washing between those which require a longer wash and those that don’t
28
6
7
32
6
12
11
21
13
26
44
3 12
9
19
8
8
% DK/NA
26
16
18
19
9
% Never
44
Dry clothes in a tumble dryer in the winter
Dry clothes in a tumble dryer in the summer
% less than half
2
5
6
6
3
Base: UK adults who have at least some responsibility for washing clothes and own dryer (4,127), 7-20 December 2011 ** Base: UK adults who have at least some responsibility for washing clothes (7,068), 7-20 December 2011
Women are more likely than men to carry out most of these activities when they wash clothes; the majority will wash on a full load at least half the time, marginally more than men (96% vs. 93% of men), and nearly half will always wash on a full load (49%) compared to fewer than two in five men (39%). However, men are more likely to wash on a full load ‘more often than not’ (47% vs. 42% of women). Women are also more likely to sort washing between those which require a longer wash and those that don’t, most of the time (58% vs. 51% of men), and clothes that require a hot wash and those that don’t (64% vs. 58%). A third of women always sort their clothes by different lengths of wash compared to one in five men (33% vs. 21%), and two in five will always sort according to temperature (41%), compared to three in ten men (29%). More men, however, say they do this ‘more often than not’ (19% vs. 17% women). Almost seven in ten women will wash at 30 degrees or less at least half the time (67%) compared to just over six in ten men (62%), and men are more likely never to wash at these temperatures (13% vs. 10%). Men, on the other hand, use tumble dryers more than women; two-thirds will tumble dry their clothes during winter (66%) compared to three in five women (61%), and a quarter use it during the summer time (25%) compared to one in five women (18%).
Clothing behaviour research 87
11-049455-01 - Clothing report - v6 FINAL - 16 Mar 2012 - INTERNAL USE (1)
Different laundry habits are also influenced by age. For example the likelihood of sorting washing according to the length and temperature of wash increases with age; two-thirds of people aged over 65 sort according to length of wash (66%) compared to fewer than half of 25-34 year olds (44%), and half of 16-24 will sort between hot and cold washes (51%), rising to almost three-quarters of those over 55 (72%). Washing at a temperature under 30 degrees is less determined by age, however older people tend to say they do this ‘more often than not’ as oppose to younger people; a third of people over 55 say this (30%) compared to a quarter of people aged 1624 (26%). Additionally almost three-quarters of people aged 16-24 tumble dry their clothes in the winter time (73%), a quarter ‘always’ using it (25%), a figure that falls for older people with fewer than three in five people over 55 using their tumble dryer (57%). Younger people are also marginally more likely to use their tumble dryer during the summer (25% of 25-34 year olds vs. 17% of 55-65 year olds), whereas around half the people over 55 (49%) will never use their tumble dryer in summer. Household factors play a role for certain things. People in couples are more likely to wash a full load at least half the time (96% vs. 93% of single people). Greater numbers of those who are separated (70%), widowed (69%) or divorced (68%) will wash at 30 degrees or less, than those who have never been married (61%). Those living in a household of two are most likely to sort their washing most of the time; three in five sorting according to the length of wash at least half the time (61%) compared to half overall (55%), and over two-thirds doing this according to temperature (67%) compared to three in five overall (61%). In a similar fashion, people living in a couple are more likely to do this (59% sort according to length of wash and 66% according to temperature vs. 48% and 54% of single people), particularly married people (62% sort between length and 69% between temperature). People with children are just as likely as people without to wash on a full load, however, they are more likely to say they always do this (49% vs. 43% without children). This likelihood increases with the number of children these people have; for instance, over two-thirds of people with four or more children wash at a full load (68%) compared to under half of people with only one child (47%). Parents are also more likely to use tumble dyers, seven in ten using most of the time them in winter (71%) compared to six in ten without any children (60%). Consequently, the use of tumble dryers increases with household size; three quarters of people in households with more than 5 people use them in winter (74%) dropping to half of single-person households (54%), who are more likely to ‘never’ use a tumble dryer in winter (14% vs. 9% overall), but this minority are also more likely than other households to say that they ‘always’ use a tumble dryer in winter (26% vs. 21% overall). Additionally two in five of those living in households of four or more will use their tumble dryer in the summer occasionally (‘less than half the time’ - 38%), compared to just one in five single-person households (22%), who are more likely to never use it during the summer (49% vs. 44% overall). Income has some bearing on the figures. People are more likely to wash on a full load the higher their income is (96% of people with incomes over £55k vs. 94% of people with incomes lower than £20k). However, nearly half the people with lower incomes say that they ‘always’ wash on a full load (48% with incomes lower than £20k), compared to fewer than two in five people from households with incomes over £55k (40%). These people are instead more likely to say they wash at full loads ‘more often than not’ (50% of people with incomes over £55k vs. 40% with less than £20k). Similarly the tendency to sort between longer and shorter washes, and between the temperature of washes, also increases with income; around half the people earning less than £10k a year will sort according to length of wash (47%) or temperature (52%) rising to almost two-thirds of people earning over £100k sorting between long and short washes (64%), and over three-quarters sorting according to temperature (76%). Those on lower incomes are, however, more likely to say that they ‘always’ wash at 30 degrees or less; a quarter of those with households incomes less than £10k do this (26%), compared to one in ten people with household incomes over £100k (12%). The use of tumble dryers also increases with income, two-thirds of household earning over £100k using them most of the time in winter (66%) dropping to less six in ten people from households earning less than £10k (58%). Almost two-thirds of those who own a tumble dryer and have at least some responsibility for washing clothes use their tumble dryer to dry clothes in the winter at least half the time (63%), but this falls if there is a clothes rack available in the house (59%) or if there is a clothes line inside (58%). While over a fifth of these adults ‘always’ dry their clothes in the tumble dryer in the winter (21%), this falls if the household has access to an indoor clothes line (14%), a clothes rack (16%), an outside clothes line (18%) or an airing cupboard (18%). Clothing behaviour research 88
11-049455-01 - Clothing report - v6 FINAL - 16 Mar 2012 - INTERNAL USE (1)
In the summer, just over a fifth of those who own a tumble dryer and have responsibility for washing clothes dry clothes using a tumble dryer at least half of the time (21%), but this drops among those who own an outside clothes line (14%), an indoor clothes line (16%) or a clothes rack (17%). While few do this ‘always’ (six percent), even fewer do it if they own an outdoor clothes line (two percent), an indoor clothes line (three percent), a clothes rack (four percent) or an airing cupboard (five percent). People who describe themselves as the ‘main shopper’ are more likely to always wash on a full load, with two in five doing this (45%) compared to one third of those who are not the ‘main shopper’ (36%). People who are not the main earner are more likely to wash on a full load, nearly half (47%) always doing this compared to two in five who are the main earners (43%), more likely to tumble dry their clothes in the summer (23% vs. 19%), and sort their washing according to temperature (65% vs. 60% who are the main earner). People in Scotland and Greater London use their tumble dryer less often than those in other parts of the UK; almost three in five using it at least half the time in the winter (58% and 59% respectively) compared to around two-thirds overall (63%). Those in Northern Ireland will use their tumble dryer in the summer more than others around the UK (25% vs. 21% overall). Those who could do more to buy clothes made to last but are not interested in doing so are less likely to be washing their clothes at 30 degrees or less; three in five currently do so (59%) compared to almost seven in ten who already do everything they can (69%), or would like to do more (67%). They are also less likely to sort their clothes according to temperature (50% vs. 59% who would like to do more), but these people are also less likely to use their tumble dryer in winter (57% vs. 63% overall). The same is true for those who do not wish to do more to get rid of clothes to minimise waste; half wash at 30 degrees or less (47% vs. 65% and 63%), and sort according to temperature (52% vs. 64% and 62%). Those who would like to do more to buy clothes made to last are less likely to tumble dry their clothes in the summer time (18% vs. 25% of those who already do everything they can).
Clothing behaviour research 89
11-049455-01 - Clothing report - v6 FINAL - 16 Mar 2012 - INTERNAL USE (1)
The most common temperature at which clothes are washed is between 31 and 40°C; nearly half of all adults with a responsibility for washing clothes wash at this temperature (46%). A third wash their clothes at 30 degrees or less, or on the eco-setting (33%) and one in ten wash their clothes at a temperature of 41 to 50°C (11%). One in twenty wash their clothes at a temperature above 50°C (five percent). Figure 48 (Q35b)
When washing clothes, what temperature do you mostly wash your clothes at? Less than 30
2%
30
27%
31-40
46%
41-50
11%
51-60 61-90
4% 1%
The eco-setting (not sure of temperature) Another setting (not sure of temperature) I do not wash most of my clothes at any one temperature Other (specify) Don’t know
4% 1% 2% * 2%
Base: UK adults who have at least some responsibility for washing clothes (7,068), 7-20 December 2011
Around a third of women wash their clothes at 30 degrees (30%) compared to a quarter of men (24%). Men are more likely to wash at higher temperatures; nearly one in five men wash at a temperature above 40°C (19%) compared to fewer than one in six women (14%). Additionally, more men than women don’t know which setting they wash their clothes at (four percent vs. one percent). There are few significant age differences when it comes to what temperature people wash their clothes. In general, people aged 25-44 are more likely to wash clothes at 31-40°C, with nearly half doing this (48%), while 16-24 year olds are more likely to wash their clothes at 30 degrees, with nearly a third doing this (30%). People living in Scotland are more likely to wash their clothes at 30 degrees or less, or on the eco setting, than the rest of the UK (38% vs. 33% overall). In terms of household differences, smaller households with one to three people are more likely to wash clothes at 30 degrees (28%) than households of five or more people (22%). Households with children are more likely to wash their clothes at warmer temperatures than those without children (70% of households with children wash at a temperature over 30 degrees vs. 64% of people without children). People who believe they are already doing everything they can to minimise clothes waste are more likely to be washing their clothes at 30 degrees (29%) than those who feel they could do more (21%).
Clothing behaviour research 90
11-049455-01 - Clothing report - v6 FINAL - 16 Mar 2012 - INTERNAL USE (1)
Almost two-thirds of UK adults consider it important that their clothes are ironed (64%), with nearly a third considering it very important (30%). Over a third do not consider it important to iron their clothes (36%), with over one in ten believing it is not at all important (12%). it important that their Almost two-thirds consider
clothes are ironed (Q36)
Figure 49 (Q36)
How important, if at all, is it that your clothes are ironed? Don’t know
Not at all important
12%
*
30%
Very important
Not very important 24%
33% Fairly important Base: UK adults (7,950), 7-20 December 2011
Marginally more men than women consider ironing important (65% vs. 62% of women), although women are more likely to believe that ironing is ‘very’ important (31% vs. 29%) while men are more likely to say it is ‘fairly’ important (37% vs. 30% women). The likelihood of considering ironing important increases with age; seven in ten people over 65 years old say it is important (70%) compared to just over half of 16-34 year olds (53%). People aged 25 -34 are most likely to say ironing is ‘not at all important’ (17% vs. 12% overall). People in Northern Ireland are more likely than people in the rest of the UK to consider ironing important (73% vs. 64% overall). People’s marital status also plays a role; two-thirds of people living in a couple consider ironing important (67%) compared to fewer than three in five single people (57%), particularly married couples (71%) as opposed to people living with a domestic partner (55%). Household income and education also play a part. People with a higher household income are more likely to say that ironing is important; three in four people with a household income above £100k say it is important (75%) compared to half of people with an income less than £10k (50%). More educated people tend to consider ironing unimportant; two in five of those with FE/HE qualifications say this (39%) compared to a third of those without any qualifications (32%). The clothes people own also has an effect on whether they think ironing is important or not. People who estimate the value of their clothes to be high consider ironing more important than those with a lower estimated value; seven in ten people who estimate the value to be between £2000-2999 (71%) or above £5000 (also 71%) compared to just over half of those who estimate it to be less than £500 (56%). Furthermore, people who feel they already buy clothes made to last are more likely to see ironing as important than those who feel they could do more to achieve this (65% vs. 59%). People who buy clothes for others are more likely to believe that ironing is important, with two-thirds saying this (66%), compared to those who do not buy clothes for others (61%).
Clothing behaviour research 91
11-049455-01 - Clothing report - v6 FINAL - 16 Mar 2012 - INTERNAL USE (1)
5.2
Potential for change and drivers
Almost half of all adults would delay putting their clothes in the laundry if their clothes smelt fresher for longer (47%), nearly a quarter would do so if they felt it would help to preserve the look or feel of the garment (24%), and one in five would do so as a result of energy prices continuing to rise (20%). Between one in ten and two in ten would do so if their clothes were more stain resistant (19%), if they knew how much money they would save by running the washing machine less often (17%), if they felt it would help the environment (15%) or if they had somewhere convenient to store/air clothes once worn (13%). Almost a third would not be persuaded to wear their clothes for longer before putting them in the laundry than they currently do (31%). Figure 50 (Q33)
Almost half would wear clothes for longer if they
What, if anything, would result in you wearing your clothes for longer before smeltthem fresher (Q33) putting in the laundry? If my clothes smelt fresher for longer If I thought it would help preserve the look or feel of the garment If energy prices continue to increase If my clothes were more stain resistant If knew how much money I’d save by running washing machine less often If I felt it would help the environment If had somewhere convenient to store/air clothes I have worn If someone I trusted recommended it If I was aware of other people doing this
Other Don't know Nothing, don't want to wear longer than I do
47% 24% 20% 19% 17% 15% 13% 4% 3%
1% 5% 31%
Base: UK adults (7,950), 7-20 December 2011
Women could be encouraged more than men; seven in ten women are interested in changing (71%), compared to two-thirds of men (66%). Half of women would be more convinced if their clothes smelt fresher for longer (50% vs. 44% of men), one in five would be encouraged if the clothes were more stain resistant (20% vs. 18%) and if they thought it would help preserve the look and feel of the garment (27% vs. 20%). Men would be more likely than women to do so if someone they trusted recommended it to them (five percent vs. three percent). As already seen, older adults wear their clothes for longer before washing them and younger adults are more open to doing this more often than they currently do; eight out of ten of those aged 16-24 are interested in wearing their clothes for longer (80%) compared to just over half of those aged 66+ (56%). These younger adults would be most easily persuaded if their clothes smelt fresher for longer (56% among those aged 16-24 and 58% aged 25-34), if their clothes were more stain resistant (25% aged 16-24 vs. 19% overall), if they knew how much money they could save (21% vs. 17% overall) or if they had somewhere convenient to store clothes (18% vs. 13% overall). They would also be more likely to be persuaded by their peers; nearly one in ten would do it if they were aware of other people they know doing it (eight percent vs. one percent aged 66+) and just over one in twenty would if someone they trusted recommended it (six percent vs. four percent aged 66+).
Clothing behaviour research 92
11-049455-01 - Clothing report - v6 FINAL - 16 Mar 2012 - INTERNAL USE (1)
Those living in England are less motivated, with almost one in three not wanting to do more to wear their clothes for longer (32%). This compares to just over a quarter in both Wales and Scotland (28%) and just over one in five in Northern Ireland (22%). Willingness to wear clothes for longer increases with household size; more than three in four of those with five or more people would consider wearing them for longer (77%), dropping to fewer than two-thirds of those living on their own (64%). They would prefer the items to smell fresher for longer (52% with a household of five or more, 55% with four vs. 42% on their own), be more stain resistant (22%, 23% and 17%) and would need somewhere convenient to store or air the clothes (17% vs. 12%). The same pattern can be found among those with children in the household; three-quarters with at least one child would consider wearing clothes for longer (75%) compared to two-thirds among those with no children (67%). Those who used to be in a couple and are now divorced or widowed are less likely to want to change their behaviour; two in five of those who are widowed or divorced would not be willing to change (42% and 41% respectively, compared to 31% on average). We also note that an increase in energy prices would be less likely to motivate households with a higher income to wash clothes than it would for those with lower incomes; over a quarter of those in households with less than £10k say this would encourage them (26%) compared to fewer than one in ten people with a household income over £100k (nine percent). The majority of those who do not have any responsibility for washing clothes could be persuaded to wear their clothes for longer; four in ten do not wish to (40%), compared to three in ten of those who do have responsibility (30%). The same is true of those who do not get rid of unwanted clothing from their household; almost half do not wish to do more (46%), compared to a third of those who do (32%).
Clothing behaviour research 93
11-049455-01 - Clothing report - v6 FINAL - 16 Mar 2012 - INTERNAL USE (1)
Almost two in five people with some responsibility for washing clothes would consider washing items that have only been worn once less often (39%), over a third would consider washing their clothes at 30 degrees or on an eco-setting more often in the future (34%) and nearly a third would consider waiting for a full load more often (31%). One in five would consider ironing their clothes less (20%), and fewer than one in five would consider sorting items into those which require a longer wash more often (18%) or a hotter wash (15%) and tumble areornot to become more dryingOnly less oftenone-third in the summer (16%) winter willing (11%).
environmentally friendly (Q37 and Q38)
Figure 51 (Q37 and Q38)
Which, if any, of the following behaviours might you seriously consider doing more/less often in future? MORE
LESS
Wash at 30 or ecosetting
34%
Wash with full load
31%
Sort items - longer wash
Wash items only worn once Iron clothes
20%
18% Tumble dry in summer
Sort items - hot wash
16%
15% Tumble dry in winter
None of the above Already do all of these things
39%
11%
28% 7%
None of the above
37%
Base: UK adults who have at least some responsibility for washing clothes (7,068), 7-20 December 2011
Women are more susceptible to changing their behaviour in a positive way overall; more would consider washing their clothes at 30 degrees or less than men (36% vs. 32%) but men would consider ensuring that they have a full load more than women (32% vs. 29%), sorting their clothes between length of wash (19% vs. 17%) and temperature of wash (16% vs. 14%). Older adults are less likely to want to change, with around a third of those aged over 65 not wanting to do any of the suggested good behaviours more often (31% vs. 26% of those aged 16-24) and almost half not wanting to reduce the bad behaviours (45% vs. 26% of those aged 16-24). The only behaviour where older people were more open to change was in ensuring that they wash with a full load (35% aged 55-65 vs. 26% aged 16-24). Those living in England are the least motivated, with almost three in ten saying that they do not wish to do any of the good behaviours more often than they currently do (28% vs. 25% in Wales and Scotland and 15% in Northern Ireland) and almost four in ten not willing to consider doing the bad behaviours less often (38% vs. 35% in Wales, 33% in Scotland and 25% in Northern Ireland). However, more of those in Northern Ireland are already doing all of these good things already (11% vs. seven percent in England, eight percent in Wales and five percent in Scotland). Those living on their own and those who are single are less likely to want to undertake these behaviours; over a third of those living on their own are not interested in doing any of the good behaviours more often (35%), compared to just under a quarter in households with four or more people (23%) and a third of single people are not interested (32%) compared to a quarter of those in a couple (25%). Smaller households are also less likely to want to cut down on these bad behaviours; almost a half of those living on their own would not consider cutting down on any of those listed (47%) compared to a quarter of those with four or more members (26%). The same occurs with those who are single; two in five not interested in cutting down (41%) compared to a third of those in a couple (35%).
Clothing behaviour research 94
11-049455-01 - Clothing report - v6 FINAL - 16 Mar 2012 - INTERNAL USE (1)
People with children are more likely to consider changing; 24% are not interested in considering any of the good behaviours (vs. 29% of those with no children) and almost three in ten are not interested in cutting down on the bad ones (28% vs. 40% of those with no children). Those in the lowest income bracket claim that they are doing the most (10% already doing all of the good things vs. three percent in the highest bracket) but are also the least likely to want to change their behaviour (37% would not do any of the good things more often compared to 27% in the highest bracket and 22% in the £35k£55k bracket). Over half of those in the top income bracket would consider washing at 30 degrees more often (52% vs. 34% overall). Those who admit to being able to do more to buy clothes that are made to last but do not want to are also less likely to want to make any of these changes (41% don’t want to do any good changes and 48% don’t want to do any bad ones less often), as do those who could do more to reduce clothing waste but don’t want to (46% won’t consider doing more good things and 49% won’t consider doing fewer bad things). A third of those who own a tumble dryer would consider tumble drying fewer clothes in the summer, (32% vs. 16% overall) and a fifth would consider tumble drying fewer clothes in the winter (20% vs. 11% overall). Those with an indoor clothes line would be more likely to consider tumble drying less in the winter (15% vs. 11% overall), as would those with an outdoor clothes line (13%). In the summer, those with an outdoor clothes line would be more likely to consider cutting down on tumble drying (17% vs. 16% overall).
Clothing behaviour research 95
11-049455-01 - Clothing report - v6 FINAL - 16 Mar 2012 - INTERNAL USE (1)
More than eight in ten adults who don’t always wash at an eco-setting would consider doing so more often in the future (83%), with one in eight not interested in doing so (12%) and the rest unsure (five percent). Around three in five adults would be encouraged to do so if they were confident that their clothes would definitely be clean (59%). Over a third would wash their clothes at an eco-setting if more of their clothes labels recommended it (36%), and around a third would consider it if their clothes smelt fresher for longer as a result (31%). Around a quarter would be persuaded if energy prices continue to increase (28%), if their washing machine had an appropriate setting (27%), if they knew how much money they could save (24%), if cheaper brands were available for use at 30 degrees (22%) or if they felt that it would help the environment (21%). Figure 52 (Q39)
Eco-setting would be used if clothes would What, if anything, would result in you washing your clothes on an eco-setting definitely be clean (e.g. at 30oC) more often? (Q39) If I felt my clothes would be clean after washing at 30 or less If more of my clothes labels said recommended wash was 30 If my clothes smelt fresher for longer
59% 36% 31% 28%
If energy prices continue to increase
27%
If the washing machine had a programme for 30 or less
24%
If I knew how much money I could save by washing at 30 If cheaper brands of washing power / liquid were available for use at 30 If I felt it would help the environment
22% 21% 6%
If someone I trusted recommended it If most people considered this the right thing to do If I was aware of other people I know doing this
Other Don't know Nothing, do not wish to
4% 3%
1% 5% 12%
Base: UK adults who do not always wash their clothes at 30 degrees or less (5,591), 7-20 December 2011
Younger adults are more disposed towards switching to washing their clothes at 30 degrees or less or on the eco-setting; whilst as many as four out of five of those aged 66+ would at least consider changing their behaviour (80%), this rises to nine out of ten of those aged 16-24 (90%). Granted, a larger proportion of this age group don’t know if they would make changes but they do not rule it out (nine percent vs. four percent of those aged 55+). These younger groups would be more likely to be persuaded by cheaper brands of washing powder (25% vs. 16% of those aged 66+), if they were aware of other people they know doing this (five percent vs. two percent), if most people considered this the right thing to do (six percent vs. two percent), if they were aware of more people they know doing this (five percent vs. two percent) or if someone they trusted recommended it (nine percent vs. six percent overall). In contrast, older adults would be more encouraged if energy prices continue to increase (30% of those aged 45+ vs. 22% aged 16-24) and if more of the labels recommended this setting was used (42% of those aged 66+ vs. 30% aged 25-34).
Clothing behaviour research 96
11-049455-01 - Clothing report - v6 FINAL - 16 Mar 2012 - INTERNAL USE (1)
The middle aged are the least trusting that washing at 30 degrees or less would clean their clothes; almost twothirds of those aged 35-44 would use this setting more often if they could be persuaded that this was the case (65%), with those aged 45-54 just behind (63%) and 55-65 still higher than average (61%). This drops to half of those aged 16-24 (50%). Men and women are equally likely to consider making changes but women are more sceptical that their clothes would be clean after washing on this setting; two-thirds of women would use the setting more often if they thought their clothes would be clean (63% vs. 54% of men). Men are more susceptible to peer group pressure; more would be persuaded to change behaviour if someone they trusted recommended it (seven percent vs. five percent), if most people considered it the right thing to do (four percent vs. three percent) and if they were aware of other people they know doing this (three percent vs. two percent). Those households with fewer members are the most resistant to change; around one in six of those living on their own do not wish to use this setting more often than they do (17%), dropping steadily to just over one in fourteen of those living with at least four other people (seven percent). This is also true of those who are single (14% vs. 11% in a couple) and also of those without children (14% vs. eight percent of those with at least one child). People in the lowest income bracket (less than £10k) are the least likely to want to make a change to this setting (15% vs. 12% average) but those on lower incomes would generally be more interested if energy prices continue to rise; a third of people with household incomes between £10k-£19999 would be motivated by this (31%) compared to one in five people with household incomes above £100k (19%). This low income group would also be persuaded if washing powder for this setting was a bit cheaper (25% vs. 14%). Those who could do more to buy clothes that last but are not interested in doing so also disagree that they would change to washing on the eco-setting or at 30 degrees or less (19% don’t want to vs. eight percent of those who could do more and would like to). The same is true of those who could do more to minimise household waste but don’t want to (20% vs. five percent of those who could do more and would like to).
Clothing behaviour research 97
11-049455-01 - Clothing report - v6 FINAL - 16 Mar 2012 - INTERNAL USE (1)
Three in five UK adults who do not always wash with a full load would consider doing so more often in the future (59%). Over a third of adults would not be influenced by anything to wash more full loads (34%) and seven percent are not sure. A quarter of adults would wash with a full load more often if energy prices continue to increase (25%) and just under a quarter would be encouraged to do so if their washing machine warned them when they had less than a full load (23%). Almost one in five would do more full loads if they knew how much more it cost them to run half loads (18%) and around one in six adults would do more if their clothes smelt fresher for longer (16%), if they felt it would help the environment (15%), or if they were more informed about washing different types of clothes (15%). Figure 53 (Q40)
Range of drivers for washing more full loads, What, if anything, would saving result in you washing more full loads? including money ideas (Q40) 25%
If energy prices continue to increase
23%
If the washing machine warned when less than a full load
18%
If I knew how much extra it costs to run half loads
16%
If my clothes smelt fresher for longer If I felt it would help the environment
15%
If I knew more about washing different types of clothes If I had more space where I could store smelly/dirty clothes If I or others in my household owned more clothes
15% 11% 7% 5%
If I had the time to do more hand washing If someone I trusted recommended doing so
3%
If most people considered this the right thing to do
2%
If I was aware of other people I know doing this
2%
Other
2%
Don't know
7% 34%
Nothing, I do not wish to Base: UK adults who do not always wash with a full load (3,947), 7-20 December 2011
Younger adults are more likely to consider washing more full loads than they currently do; only a quarter of those aged 16-24 rule this out (24%), compared to nearly half of those aged 66+ (44%). These young people would be more easily persuaded by having more space (17% vs. six percent aged 66+), if they owned more clothes (11% vs. four percent), if they had more time to do hand washing (11% vs. three percent) or if someone they trusted recommended it (seven percent vs. two percent). Older adults were more concerned about energy prices continuing to rise (28% of those aged 66+ vs. 15% aged 16-24). Those living in England are most likely not to want to do this more often, with over a third saying this (35%) and rising to around two in five of those who live in the Midlands (39%). This compares to around three in ten who live in Wales or Scotland (29%) and fewer than a quarter of those in Northern Ireland (23%). People living in larger households are more likely to want to change; almost one in five of those living in a household of five or more do not wish to change (18%), compared to two in five of those who live on their own (40%). This rises to nearly half of those who are widowed (46%) and two in five of those who are divorced (41%), and is a more prevalent view among those with no children (36% vs. 26% of those with at least one child).
Clothing behaviour research 98
11-049455-01 - Clothing report - v6 FINAL - 16 Mar 2012 - INTERNAL USE (1)
Those who could do more to buy clothes that last but are not interested in doing so also disagree that they would change to washing full loads (46% don’t want to vs. 25% of those who could do more and would like to). The same is true of those who could do more to minimise household waste but don’t want to (33% vs. 19% of those who could do more and would like to and 41% among those who already do everything they can).
Clothing behaviour research 99
11-049455-01 - Clothing report - v6 FINAL - 16 Mar 2012 - INTERNAL USE (1)
Seven in ten adults who currently tumble dry their clothes would consider doing it less for at least one of the following reasons (70%). In contrast, nearly a quarter would not be influenced by anything to reduce their tumble drying (24%). Around a third would tumble dry less often if their clothes were made from fabrics that dried quicker (35%), if they had more space to hang their clothes (32%), or if energy prices continue to increase (30%). Other measures which would encourage people to tumble dry less often include if people knew how much it costs to tumble dry clothes (15%), if they owned an indoor clothes airer (13%) or if they owned a line that they could put up outdoors (nine percent). Figure 54 (Q41)
A change in fabric, more space and money saving What, if anything, result in you tumble drying your clothes less often? could reducewould tumble drying (Q41)
If more of my clothes were made out of fabrics that dried quicker
35% 32%
If I had more space to hang clothes
30%
If energy prices continue to increase
15%
If I knew how much extra it costs to tumble dry clothes
13%
If I had an indoor clothes airer
9%
If I had a line I could put up outdoors If most people considered this the right thing to do
2%
If someone I trusted recommended it
2%
If I was aware of other people I know doing this
1%
Other
4%
Don't know
4%
Nothing, I never use the tumble/washer dryer
2%
Nothing, I do not wish to
24%
Base: UK adults who sometimes tumble dry (3,712) , 7-20 December 2011
Those in the older age groups were more likely to say they would not consider tumble drying their clothes less often; over a third of those aged 66+ said this (36%) compared to fewer than one in six of those aged 16-24 (15%). The same is true for men, a quarter of whom would not consider it (25%), compared to around one in five women (22%). Both women and younger adults were particularly interested if clothes were made more from fabrics that dried quicker (43% of those aged 16-24 and 37% of women vs. 35% overall) and if they had more space to hang clothes (44% of those aged 25-34 and 36% of women vs. 32% overall). Again, people living in larger households are more open to change; one in ten who live in a household of five or more do not wish to change (12%), compared to over a third who live on their own (36%). This includes around a third of those who are divorced (35%) and who are widowed (33%) and is a more prevalent view among those who are single (27% vs. 22% in a couple) and those with no children (27% vs. 15% of those with at least one child). Those who could do more to buy clothes that last but are not interested in doing so also disagree that they would tumble dry clothes less often (37% don’t want to vs. 15% of those who could do more and would like to). The same is true of those who could do more to minimise household waste but don’t want to (27% vs. 13% of those who could do more and would like to and 28% among those who already do everything they can).
Clothing behaviour research 100
11-049455-01 - Clothing report - v6 FINAL - 16 Mar 2012 - INTERNAL USE (1)
People who have a washer/dryer are more likely to be encouraged to tumble dry their clothes less often if they had an outdoor clothes line (13% vs. 9% overall). Those owning a spin dryer would be most encouraged and around one in six would tumble dry less if they had an outdoor clothes line (16%).
Clothing behaviour research 101
11-049455-01 - Clothing report - v6 FINAL - 16 Mar 2012 - INTERNAL USE (1)
Just under a half of all adults in the UK would consider ironing less than they currently do (47%), with a third not wishing to do it at all (35%) and one in eight admitting that their clothes are never ironed (13%). Four percent are not sure. Over a third would iron less often if their clothes were made from fabrics that held their shape more (36%) and around one in ten would reduce their ironing if they thought it damaged their clothes (12%), if energy prices continue to rise (10%) or if they felt less pressure to look a particular way at work or when going out (nine percent). Knowing how much extra it costs to iron clothes would persuade around one in fourteen to iron less often (seven percent). Figure 55 (Q42)
Half would consider ironing less, mostly if fabrics
What, anything, would result in you ironing your clothes less often? keptif their shape better (Q42) If my clothes were made out of fabrics that kept their shape more
36% 12%
If I thought it might damage my clothes in the long run
10%
If energy prices continue to increase If I felt less pressure to look a particular way at work or when going out
9% 7%
If I knew how much extra it costs to iron clothes If most people considered this the right thing to do
3%
If someone I trusted recommended doing it
2%
If I was aware of other people I know doing this
2%
Other Don't know Nothing, clothes never ironed Nothing, I do not wish to
1% 4% 13% 35%
Base: UK adults (7,950), 7-20 December 2011
Men’s clothes are more likely to be ironed than women (89% of men vs. 85% of women) and they are also less likely to want to iron less than they do at the moment (37% vs. 33%). Women would be more likely than men to consider ironing less often if the fabrics kept their shape better (39% vs. 33%). Ironing clothes is engrained in almost half of those aged 66+, with nearly half not willing to iron their clothes less often than they do at the moment (46%), falling to a quarter among those aged 16-24 (25%). These older adults are more likely to iron their clothes currently, with as few as one in twelve of those aged 66+ never ironing clothes (eight percent vs. 19% among those aged 25-34 and 17% aged 16-24). The young are more likely than the old to mention most of the things as drivers to ironing less, with the exception of clothes being made from fabrics that keep their shape better (30% of those aged 16-24, rising to 39% among those aged 5565). Those living in England are the least likely to be open to change; over a third are not interested (36%) compared to exactly a third in Wales (33%) and fewer than a third in Scotland (31%) and Northern Ireland (28%). The proportion of people not interested in reducing their ironing rises to almost two in five of those living in South East and Anglia regions (38%).
Clothing behaviour research 102
11-049455-01 - Clothing report - v6 FINAL - 16 Mar 2012 - INTERNAL USE (1)
People living in larger households are more likely to consider ironing less; for example, around one in six people living in households of five or more would cut down if energy prices continue to increase (14%) compared to only one in twelve of those in a single person household (eight percent), and one in ten of those in a two person household (nine percent). Those in smaller households are more likely not to want to iron their clothes less often than they do already; two in five of those in a two person household (40%), compared to fewer than a quarter of those living in households with five or more people (23%). Households without children are significantly more likely than households with children to be averse to ironing less, over a third not wishing to do this (37%), compared to three in ten people from households with at least one child (30%). Those with lower incomes iron their clothes less; one in five of those who earn less than £10k do not iron their clothes at all (18%), compared to one in ten of those who earn over £55k a year (nine percent). Almost half of those in the highest income group do not wish to iron their clothes less than they do at present (47% vs. 35% overall). People with higher value wardrobes are more likely to be protective about their ironing; two in five people with an estimated wardrobe value of £5k or more do not wish to iron their clothes less (41%), compared to three in ten who estimate their wardrobe to be worth less than £500 (29%). People who are not responsible for washing clothes are less likely to be open to reducing their ironing; two in five do not wish to iron less than they already do (40%), compared to a third who are responsible for washing (35%). Those who could do more to buy clothes made to last and would like to are more likely to be positive about reducing their ironing; a quarter say they do not wish to reduce their ironing (26%), compared to nearly half of those who aren’t interested in buying clothes made to last (45%). The figure rises to half of those who are not interested in getting rid of clothes to minimise waste (50%).
Clothing behaviour research 103
11-049455-01 - Clothing report - v6 FINAL - 16 Mar 2012 - INTERNAL USE (1)
Just under half who do not always sort laundry between longer and shorter washing would consider doing it more often in the future (48%). The remainder either do not wish to separate their clothes more than they do (44%) or are not sure (eight percent). Around one in five would be encouraged to do so if their experience of shorter washes were just as effective as longer washes (21%), or if they felt it was worth spending the time and effort involved (18%). Around one in ten would be persuaded by a greater understanding of the various programmes on their washing machine (12%), if energy prices continue to increase (12%), if they knew how much extra it costs (10%) or if they had more space for storing clothes that need to be washed (10%). Figure 56 (Q43)
Over half would consider separating washing if
What, if anything, would result in you separating your clothes more often into shorter washes effective those that require longerwere washesmore and those that don’t? (Q43) If my experience was that shorter washes are just as effective at cleaning certain clothes
21% 18%
If I felt it was worth spending the time and effort involved If I understood in more detail the various programmes on the washing machine
12%
If energy prices continue to increase
12%
If I knew how much extra it costs to wash clothes for longer than necessary
10%
If I had more space for storing clothes that need to be washed
10% 5%
If I or others in my household had more clothes If someone I trusted recommended doing it If most people considered this the right thing to do
3% 2%
If I was aware of other people I know doing this
1%
Other
1%
Don't know
8% 44%
Nothing, I do not wish to separate my clothes more than I do
Base: UK adults who don’t always sort washing into clothes that require longer washes (5,074), 7-20 December 2011
Men and women are relatively similar in terms of their opinions on separating clothes; there are no significant differences between men and women regarding those who do not want to separate clothes more often, for instance. However, men are more likely to separate clothes if they felt it was worth spending the time and effort involved (20% vs. 16% of women) and if energy prices continue to increase (14% vs. 10% of women). Women are more likely if their experiences of washing shorter washes was that they were just as effective as cleaning certain clothes (23% vs. 19% for men). On the surface, older adults are less willing to separate their clothes more often than they currently do; almost half of those aged 66+ do not rule it out (45%), rising to two-thirds among those aged 16-24 (67%). However, as we have seen earlier, older adults are more likely to be performing this action than the young. Older adults are more likely to be persuaded to do it more often by knowing that the shorter washes are just as effective (24% of people aged 55-65 vs. 18% of 16-24 year olds), and younger adults would appreciate more space for storage (11% of 16-24 year olds vs. seven percent of people over 65), if they had more clothes in the first place (nine percent vs. two percent) and if someone they trusted recommended it (seven percent vs. one percent). Those living in England are the least motivated, with nearly half not wishing to do more than they currently do (45%) compared to two in five in Wales (42%) and Scotland (40%), and just three in ten in Northern Ireland (28%). People living in Greater London are more likely to consider separating clothes more often (37% do not wish to separate clothes more, compared to 44% overall). Clothing behaviour research 104
11-049455-01 - Clothing report - v6 FINAL - 16 Mar 2012 - INTERNAL USE (1)
Larger households are, in general, more willing to consider separating clothes. More than half of people in single person households do not wish to separate clothes more often than they do now (52%), while a third of households with four or more people say the same (33%). Almost half of households without children do not wish to separate clothes more often that they do (47%), higher than the third of households with children who do not wish to separate their clothes more (35%). Half the people with no qualifications do not wish to separate their clothes more often than they do (49%), whereas people with A-levels and FE/HE qualifications are more likely to be open to separating clothes (42% of each do not wish to separate clothes more than they do). Unemployed people are less willing to consider separating clothes more often than they currently do, with almost half saying this (48% vs. 41% of employed people). Lower income households are less willing to separate clothes more often than higher income households (48% of households earning less than £10k vs. 39% of people in households earning between £55k-£99,999). People who aren’t responsible for buying clothes are less inclined to separate clothes more often than they do now (52% vs. 43% of people who are responsible). Also, two-thirds of those who could do more to buy clothes made to last and would like to (66%), and nearly three-quarters of those who could do more to get rid of clothes to minimise waste and would like to (73%), would be more willing to separate their clothes for washes more often in the future, compared to those who are not interested or those that already do everything they can.
Clothing behaviour research 105
11-049455-01 - Clothing report - v6 FINAL - 16 Mar 2012 - INTERNAL USE (1)
Appendix 1 6.0
Technical details
6.1
Questionnaire design
6.1.1 Ensuring the questionnaire was fit for purpose The questionnaire was designed by the Ipsos MORI Environment team, with specialist input from Professor Tim Cooper of Nottingham Trent University. Overall steer and sector specific knowledge was provided by WRAP. Interviews were then conducted with a range of members of the public on Wednesday 30th November 2011 to test comprehension of the scripted questionnaire. Each respondent attended Ipsos MORI’s head office and completed an online version of the questionnaire. Respondents were recruited in the street by Ipsos MORI’s experienced field team and a good spread of ages, level of education and sex took part. Criteria Gender Age
Education level
Computer skills
Achieved Men
9
Women
11
18-24
4
25-34
2
35-44
5
45-54
3
55-64
4
65+
2
Masters or above
3
Degree level
4
A levels
2
GCSE
6
No qualifications
5
All to be at least fairly confident in using the internet on a computer / laptop
An experienced Ipsos MORI project team member was present during each interview and made detailed notes of any areas where the respondent had difficulty understanding a question, instruction, or the wording used. The interviewer was also given specific places within the survey to prompt discussion. Each interview lasted between 35 and 45 minutes and each respondent was taken through either the first half of the questionnaire (‘Purchasing’ and ‘Alternative to new purchase’ sections) or the second half (‘Current wardrobe – reuse’, ‘Laundry’ and ‘Discard’ sections). Respondents were asked to think about question wording and to mention any areas where they were not sure what the question was asking or where they thought there was room for improvement of any kind. All comments were marked onto hard copies of the questionnaire and collated. These comments were entered onto a revised version of the questionnaire to be used in the main stage. The final questionnaire can be found at appendix 2.
Clothing behaviour research 106
11-049455-01 - Clothing report - v6 FINAL - 16 Mar 2012 - INTERNAL USE (1)
6.1.2 Questionnaire timings and versioning The agreed questionnaire was estimated to be approximately 40 minutes. For this reason, it was decided that the questionnaire would be versioned in order to keep the length for each respondent to around 20-25 minutes. The questionnaire was split into six versions, with each respondent randomly allocated to one of the following versions: Demographics, Q1 and Q50 (15,900)
Purchasing (7,950)
Alternatives to new purchase (7,950)
Reuse and Discard (7,950)
Laundry (7,950)
Version 1 (2,650) Version 2 (2,650) Version 3 (2,650) Version 4 (2,650) Version 5 (2,650) Version 6 (2,650)
6.1.3 Allowing respondents to give an answer that wasn’t in the questionnaire (coding) Some questions allowed the respondent to give an answer that was not specified within the questionnaire. These took the form of an ‘other (please specify)’ option. After back-coding (allocating ‘other’ responses back into the original codes), the largest ‘other’ response was four percent and it was agreed that no further coding was necessary.
Clothing behaviour research 107
11-049455-01 - Clothing report - v6 FINAL - 16 Mar 2012 - INTERNAL USE (1)
6.2
Conducting the fieldwork
6.2.1 Online panels The research was conducted via an internet survey between 7th December and 20th December 2011 using the Ipsos online panels. The following numbers of interviews were achieved in each of the countries: ENGLAND
11,001
SCOTLAND
2,213
WALES
2,209
N IRELAND Total
477 15,900
Ipsos has an excellent pedigree in online research, with over ten years experience of operating online survey panels. Ipsos Interactive Services (IIS) has panels in 43 countries in North America, Europe, South America and Australia. Ipsos panels take great care in creating a panel that is authentic and from which we can build robust samples. Our panels are not just lists or databases of individuals, but managed Access Panels. All online data collection was conducted via websites. Panellists were preselected to answer the survey and received an invitation email to request that they take part; the survey was not “open access” (i.e., respondents were not self-selected), and respondents did not know the survey content. Respondents were automatically routed to relevant questions according to their answers. The survey was controlled so that all respondents answered the sections of the questionnaire that were relevant to him/her.
6.2.2 Data quality and validation Respondents recruited to the panel have to pass heavy vetting practices, including a pre-panel stage of checking and regular checks on their survey responses. In particular, some are removed if they exhibit any of the following ‘bad practices’:
Speeding: completing the survey in a very short period of time Straight-lining / zigzagging in grid questions Contradictory answers Too many “None of the above” or “Don’t know” answers Age and gender mismatch with the info from panel registration Selecting too many items which normally have low incidence and vice versa
Once final data were collected, thorough checks were performed on the resulting data set.
Clothing behaviour research 108
11-049455-01 - Clothing report - v6 FINAL - 16 Mar 2012 - INTERNAL USE (1)
6.3
Ensuring that the results are representative of the UK population (weighting)
Quotas were set during fieldwork to ensure that the profile of those who responded was as close as possible to the profile of each participating country. These quotas allowed a small range within which the number of interviews could fall (e.g. the target number of interviews with men in England was 5,372, however, a small deviation was allowed and 5,224 were interviewed.) Final data were weighted to match the known population profile for region, age, gender and social profile. This was done within each of the four UK countries and one overall UK weight was then applied. UK Source of statistics: Census 2001 (using ONS mid-year estimates 2010 where available) Country
% in population
England
83.62%
Scotland
8.71%
Wales
4.93%
N Ireland
2.74% ENGLAND
SCOTLAND
WALES
N IRELAND
Gender
% in population
% in population
% in population
% in population
Male
48.84%
47.88%
48.33%
48.53%
Female
51.16%
52.12%
51.67%
51.47%
Age
% in population
% in population
% in population
% in population
Age 15 – 34
31.92%
30.61%
30.00%
34.72%
Age 35 – 54
34.09%
34.58%
32.28%
34.28%
Age 55+
33.99%
34.81%
37.72%
31.00%
Region
% in population
% in population
% in population
% in population
North and Yorkshire
15.23%
0.00%
0.00%
0.00%
North West
13.31%
0.00%
0.00%
0.00%
Midlands
19.04%
0.00%
0.00%
0.00%
South West
10.23%
0.00%
0.00%
0.00%
South East & Anglia
27.36%
0.00%
0.00%
0.00%
Greater London
14.83%
0.00%
0.00%
0.00%
Scotland
0.00%
100.00%
0.00%
0.00%
Wales
0.00%
0.00%
100.00%
0.00%
N Ireland
0.00%
0.00%
0.00%
100.00%
% in population 42.72%
% in population 41.48%
% in population 37.90%
% in population 40.32%
57.28%
58.52%
62.10%
59.68%
Work status Working full-time Not working full-time
Clothing behaviour research 109
11-049455-01 - Clothing report - v6 FINAL - 16 Mar 2012 - INTERNAL USE (1)
6.4
Accuracy of reported differences between sub-groups (statistical reliability)
The sample tolerances that apply to the percentage results in this report are given in the table below. This table shows the possible variation that might be anticipated because a sample, rather than the entire population, was interviewed. As indicated, sampling tolerances vary with the size of the sample and the size of the percentage results. Table 3: 95% Confidence Intervals 10% or 90%
30% or 70%
50%
Approximate size of Sample on Which Survey Results are Based
±
±
±
UK adults answering each section (7,950)
1
1
1
Adults living in Greater London (1,546)
2
2
3
Adults living in Northern Ireland (477)
3
4
5
Pregnant women living in UK (205)
4
6
7
Source: Ipsos MORI
Tolerances are also involved in the comparison of results from different parts of the sample, or of results from this survey and another survey. A difference, in other words, must be of at least a certain size to be considered statistically significant. The following table is a guide to the sampling tolerances applicable to comparisons. Table 4: 95% Confidence Intervals 10% or 90%
30% or 70%
50%
Sample sizes being compared (sub-groups or trends)
±
±
±
4,000 on 4,000
1
2
2
2,000 on 2,000
2
3
3
1,000 on 1,000
3
4
4
500 on 500
4
6
6
150 on 150
7
10
11
Source: Ipsos MORI
Clothing behaviour research 110
11-049455-01 - Clothing report - v6 FINAL - 16 Mar 2012 - INTERNAL USE (1)
Appendix 2 7.0
Copy of the final questionnaire
Demographic questions QDEM1 – Age Age 16 – 24 Age 25 – 34 Age 35 – 44 Age 45 – 54 Age 55 – 65 Age 66 – 100 QDEM2 – Gender Male Female QDEM3 – Standard Region North & Yorkshire North West Midlands South West Wales South East & Anglia Greater London Scotland Northern Ireland QDEM4 – Household size 1 2 3 4 5 or more QDEM5 – Marital status Never married (single) Domestic partner (living as a couple) Married Separated (not divorced) Divorced Widowed QDEM6 – Income/year/household Under £5 000 £5 000 - 9 999 £10 000 - 14 999 £15 000 - 19 999 £20 000 - 24 999 £25 000 - 34 999 £35 000 - 44 999 £45 000 - 54 999 £55 000 - 99 999 £100 000 or more Prefer not to answer
Clothing behaviour research 111
11-049455-01 - Clothing report - v6 FINAL - 16 Mar 2012 - INTERNAL USE (1) QDEM7 – Employment Status Employed full time Employed part time Self employed Unemployed but looking for a job Unemployed and not looking for a job / Permanently disabled / Housewife Retired Pupil / Student / In full time education QDEM8 –Main Shopper Main shopper Not main shopper Me, together with another household member QDEM9 –Main Earner Main earner Not main earner Me, together with another household member QDEM10 – Age of Children in Household Pregnant women Up to 1 year 1 year 2 year 3 year 4 year 5 year 6 year 7 year 8 year 9 year 10 year 11 year 12 year 13 year 14 year 15 year QDEM11 – Education level Primary school Secondary school (age under 15 years old) NVQ3 / SCE Higher Grade / Scottish Certificate of Sixth Year Studies / General National Vocational Qualification Advanced Level / GCE Advanced Level (GCE A/AS) General National Vocational Qualification Foundation or Intermediate Level (GNVQ, GSVQ) / GCSE/ SCE standard NVQ1, NVQ2 NVQ4 / Higher National Certificate (HNC) / Higher National Diploma (HND) / Diploma in HE (iNVQ5 / Master's degree (MSc, MA, MBA, etc.) / Post-graduate diplomas and certificates / Doctorate (Ph.D.) NVQ4 / Higher National Certificate (HNC) / Higher National Diploma (HND) / Diploma in HE (including nurses training) / Bachelor's degree (BA, BSc, BEd, BEng, MB, BDS, BV, etc.) QDEM12 OE ASK ALL ALLOW DON’T KNOW OR REFUSED Could you please tell me what your postcode is? The only reason we are collecting this information is so that we can analyse the results by area, your answers will be anonymous and confidential and will not be used for any other purpose. QDEM13 OE ASK ALL WHO REFUSED OR DON’T KNOW AT QDEM12 ALLOW DON’T KNOW OR REFUSED Would you be willing to tell me the first part of your postcode please?
Clothing behaviour research 112
11-049455-01 - Clothing report - v6 FINAL - 16 Mar 2012 - INTERNAL USE (1)
Purchasing Q1 MA ASK ALL Who in your household are you mainly responsible for when buying clothes? By clothes we mean items which you wear, including underwear and outerwear but not footwear or accessories such as hats, gloves, belts, handbags and jewellery. Please select all that apply No one, someone else buys my clothes (SA) Myself My spouse / partner Other adults in my household My eldest child (IF 1 CHILD AT QDEM10) My second eldest child (IF 2 CHILDREN AT QDEM10) My third eldest child (IF 3 CHILDREN AT QDEM10) Another child in my household (IF MORE THAN 3 CHILDREN AT QDEM10)
Q2 SA FOR EACH ROW ROTATE ORDER OF STATEMENTS ASK ALL WHO BUY CLOTHES (EXCEPT CODE 1 AT Q1) Thinking about the last 12 months, how often, if at all, have you bought clothes for yourself or someone in your household through each of the following? Please select one option for each row DOWN SIDE OF GRID: Catalogues (e.g. Freemans, Littlewoods, isme) Charity shops Department stores (e.g. Debenhams, House of Fraser, John Lewis) Designer clothes stores Factory outlet stores From a friend or acquaintance High street clothing retailers in store (e.g. Next, Primark, H&M) High street clothing retailers online (e.g. Next, Primark, H&M) Jumble sales / car boot sales Online retailers for new items (e.g. ASOS, eBay) Online sites for used items (e.g. eBay, Gumtree) Outdoor clothing specialists (e.g. Blacks, Millets) Supermarkets Vintage clothes shops ACROSS TOP OF GRID: Every week Every 2-3 weeks About once a month About once every two to three months About once every four to six months Less often I have not bought clothes here in the last 12 months I never buy clothes here
Clothing behaviour research 113
11-049455-01 - Clothing report - v6 FINAL - 16 Mar 2012 - INTERNAL USE (1)
Please think about the last item of clothing you bought for yourself or someone in your household, excluding Christmas presents. Please do not include footwear or accessories such as hats, gloves, belts, handbags and jewellery. Q3 SA ASK ALL WHO BUY CLOTHES (EXCEPT CODE 1 AT Q1) What type of item was this? Please select the option that applies Baby clothes Blouse Coat Dress Fleece / bodywarmer Jacket (casual) Jacket (formal, lounge) Jacket (waterproof) Jeans Jumper / Knitwear (e.g. cardigan, sweater) Leggings Nightwear Shirt Shorts / cropped trousers Skirt Socks Sportswear Suit Sweatshirt / Hoodie Swimwear Tie Top Trousers T-shirt / polo shirt Underwear / lingerie Other (specify) Don’t know
Clothing behaviour research 114
11-049455-01 - Clothing report - v6 FINAL - 16 Mar 2012 - INTERNAL USE (1)
Q4 SA ASK ALL WHO BUY CLOTHES FOR MORE THAN ONE PERSON (MORE THAN ONE CODE AT Q1) Who was the item for? Please select the option that applies Me My spouse / partner Another adult in my household An adult outside of my household My eldest child (IF 1 CHILD AT QDEM10) My second eldest child (IF 2 CHILDREN AT QDEM10) My third eldest child (IF 3 CHILDREN AT QDEM10) Another child in my household (IF MORE THAN 3 CHILDREN AT QDEM10) None of the above Q5 SA ASK ALL WHO BUY CLOTHES (EXCEPT CODE 1 AT Q1) What was the main purpose for which you bought the item? Please select the option that applies Every day use in and around the home Every day use at work Going out / socialising Gift for someone else School Special occasion (e.g. wedding, funeral, etc.) Sports / outdoor wear Other (specify)
Q6 SA FOR EACH ROW ROTATE ORDER OF STATEMENTS REVERSE SCALE FOR 50% ASK ALL WHO BUY CLOTHES (EXCEPT CODE 1 AT Q1) Still thinking about the same item, on a scale of 1 to 5, where 1 is of no importance, and 5 is extremely important, how important in hindsight were each of the following when you bought it? Please select one option for each row DOWN SIDE OF GRID: Low environmental impact (caused minimal harm to the environment during its production) Ethically produced (made in a way considered fair to workers involved in the process e.g. ‘fair trade’) Fashionable Look and feel of the material Machine washable at a low temperature (e.g. 300c) Made to last and look good for longer (e.g. colour fast, doesn’t shrink, good quality fabric and manufacture, stitching) Non-iron Quick drying (e.g. it would not need much / any tumble drying) Recognised brand Something that you (or the recipient) would wear frequently The right fit / provided room to grow Value for money ACROSS TOP OF GRID: 1 – No importance 2 3 4 5 – Extreme importance
Clothing behaviour research 115
11-049455-01 - Clothing report - v6 FINAL - 16 Mar 2012 - INTERNAL USE (1)
Q7 MA ROTATE ORDER OF STATEMENTS ASK ALL WHO BUY CLOTHES (EXCEPT CODE 1 AT Q1) Did you check any of the following before buying the item? Please select all that apply The recommended temperature at which to wash the item The drying instructions (if any) The ironing instructions (if any) The type of fabric it was made out of, by reading a label either on or alongside the item The type of fabric it was made out of, by looking at and feeling the item Whether the item was dry clean only Whether the item was made in an ethical way (e.g. fair trade label) Whether the item was made from materials which have a low impact on the environment Whether it had spare buttons (if relevant) None of the above (SA) The following questions ask you about the clothes you buy in general for yourself and others in your household. Q8 SA FOR EACH ROW ROTATE ORDER OF STATEMENTS REVERSE SCALE FOR 50% ASK ALL WHO BUY CLOTHES (EXCEPT CODE 1 AT Q1) IN GENERAL, how important, if at all, is each of the following to you when deciding which clothes to buy for yourself or others in your household? Please answer on a scale of 1 to 5 where 1 is of no importance and 5 is extremely important. Please select one option for each row DOWN SIDE OF GRID: Low environmental impact (caused minimal harm to the environment during its production) Ethically produced (made in a way considered fair to workers involved in the process e.g. ‘fair trade’) Fashionable Look and feel of the material Machine washable at a low temperature (e.g. 300c) Made to last and look good for longer (e.g. colour fast, doesn’t shrink, good quality fabric and manufacture, stitching) Non-iron Quick drying (e.g. it would not need much / any tumble drying) Recognised brand Something that you (or the recipient) would wear frequently The right fit / provided room to grow Value for money ACROSS TOP OF GRID: 1 – No importance 2 3 4 5 – Extremely important
Clothing behaviour research 116
11-049455-01 - Clothing report - v6 FINAL - 16 Mar 2012 - INTERNAL USE (1)
Q9 SA FOR EACH ROW ROTATE ORDER OF STATEMENTS REVERSE SCALE FOR 50% ASK ALL WHO BUY CLOTHES (EXCEPT CODE 1 AT Q1) To what extent do you agree or disagree with the following statements? Please select one option for each row DOWN SIDE OF GRID: Shopping for clothes is one of my main leisure activities Before shopping for clothes I decide what I need and stick to it I regard good quality clothes as a sound investment I get a buzz when I buy new clothes for myself It is important to have a wide range of clothes to choose from when going out I usually examine the seams and stitching when buying new items of clothing I buy more clothes than I need I am willing to pay extra for clothes that have less impact on the environment I worry about what my friends and family think of my clothes There is too little information on the environmental impact of specific items of clothing My decisions on which clothes to purchase are influenced by the latest trends in fashion It is important to have a new outfit / item when going out for an occasion ACROSS TOP OF GRID: Strongly agree Tend to agree Neither agree nor disagree Tend to disagree Strongly disagree Don’t know Q10 SA ASK ALL WHO BUY CLOTHES (EXCEPT CODE 1 AT Q1) Which of the following best describes your view about buying clothes that are made to last and look good for longer? Please select the option that applies I already do everything I can to buy items that are made to last I could do more to buy items that are made to last AND would like to do so I could do more to buy items that are made to last BUT I am not interested in doing so Q11 MA ROTATE ORDER OF OPTIONS ASK ALL WHO BUY CLOTHES AND DON’T ALREADY DO EVERYTHING THEY CAN TO BUY CLOTHES THAT LAST (EXCEPT CODE 1 AT Q1 OR CODE 1 AT Q10) Which of the following, if any, would result in you buying clothes which last and look good for longer, even if each item were more expensive? Please select all that apply If there was a clothing ‘quality mark’ on the label If there was a ‘durability index’ on the label to allow comparison between garments (e.g. lasts up to 50 washes, 50-100 washes, 100 washes or more) If there was a lengthy guarantee against faults such as fading, unstitching or shrinkage (e.g. 2 years or more) If I had confidence in a brand associated with long lasting products If there was more information on the clothing label or packaging or in store (e.g. on colourfastness, shrinkage, rub resistance) If there was greater availability of clothing in ‘classic’ designs that would not quickly become dated If I had greater awareness of environmental problems caused by clothing waste If I was charged directly for the amount of household waste I throw out If I had an increase in my income – SWAPPED ORDER If I had a reduction in my income Other (specify) None of the above (SA) Clothing behaviour research 117
11-049455-01 - Clothing report - v6 FINAL - 16 Mar 2012 - INTERNAL USE (1)
Q12 SA ASK ALL WHO BUY CLOTHES (EXCEPT CODE 1 AT Q1) Which of the following fabrics do you consider to be better for the environment? Please select the option that applies Cotton Poly cotton (a mix of cotton and polyester) About the same Don’t know Q13 SA ASK ALL WHO BUY CLOTHES (EXCEPT CODE 1 AT Q1) If an alternative fabric to cotton was shown to be better for the environment but looked, felt and cost the same, would you be prepared to buy those alternative clothes rather than cotton? Please select the option that applies Definitely Very likely Fairly likely Not very likely Not at all likely I do not buy cotton clothes Don’t know
Clothing behaviour research 118
11-049455-01 - Clothing report - v6 FINAL - 16 Mar 2012 - INTERNAL USE (1)
Alternatives to new purchase Q14 SA FOR EACH ROW ROTATE ORDER OF STATEMENTS (GROUP FIRST THREE CODES TOGETHER IN TERMS OF ROTATION) ASK ALL WHO BUY CLOTHES (EXCEPT CODE 1 AT Q1) Thinking about the last 12 months, how often have you bought or received the following types of clothes for yourself or others in your household second hand? By second hand we mean items that were used by someone else previously (e.g. handed down through family, purchased second hand online, through a charity shop, etc.) Please select one option for each row DOWN SIDE OF GRID: Baby clothes [IF CHILDREN IN HOUSEHOLD] School wear [IF CHILDREN IN HOUSEHOLD] Other children’s wear [IF CHILDREN IN HOUSEHOLD] Clothes for daytime leisure Clothes for work Clothes for going out and socialising Designer clothing Fancy dress Formal wear (e.g. weddings, evening wear, etc.) Clothes for sporting or outdoor activities (e.g. ski wear) Maternity wear ACROSS TOP OF GRID: Every week Every 2-3 weeks About once a month About once every two to three months About once every four to six months Less often I have not bought or received these items second hand in the last 12 months
Q15 MA ROTATE ORDER OF OPTIONS ASK ALL WHO BUY CLOTHES (EXCEPT CODE 1 AT Q1) Which of the following, if any, would result in you wearing more second hand clothes? Please select all that apply If prices were cheaper If I had a better shop experience (e.g. clean, free of clutter) If I could buy them from a leading high street retailer If styles were not so subject to changes in fashion If a guarantee against faults was provided If there was a better choice of clothes available If there was a bigger range of sizes available If I could buy the brands I trust If more fashionable items were available If I felt it was the right thing to do (e.g. to prevent waste) If I was aware of other people I know doing this Other (specify) Nothing, I already buy many / all of my clothes second hand (SA) Nothing, I’m not interested in purchasing more second hand clothes than I already do (SA) Nothing, I’m not interested in purchasing second hand clothes at all (SA)
Clothing behaviour research 119
11-049455-01 - Clothing report - v6 FINAL - 16 Mar 2012 - INTERNAL USE (1)
Q16 SA FOR EACH ROW ROTATE ORDER OF STATEMENTS (GROUP FIRST THREE CODES TOGETHER IN TERMS OF ROTATION) ASK ALL Thinking about the last 12 months, how often have you hired the following types of clothes for yourself or others in your household? By hire, we mean a short term rental from one night up to a few weeks. Please select one option for each row DOWN SIDE OF GRID: Baby clothes [IF CHILDREN IN HOUSEHOLD] School wear [IF CHILDREN IN HOUSEHOLD] Other children’s wear [IF CHILDREN IN HOUSEHOLD] Clothes for daytime leisure Clothes for work Clothes for going out and socialising Designer clothing Fancy dress Formal wear (e.g. weddings, evening wear, etc.) Clothes for sporting or outdoor activities (e.g. ski wear) Winter or summer clothes Maternity wear ACROSS TOP OF GRID: Every week Every 2-3 weeks About once a month About once every two to three months About once every four to six months Less than every six months Never Q17a MA ROTATE ORDER OF STATEMENTS (GROUP FIRST THREE CODES TOGETHER IN TERMS OF ROTATION) ASK ALL It has been suggested that it should be made easier to hire all types of clothes through the major high street retailers. If this was the case which, if any, of the following types of clothing might you consider hiring on a more frequent basis? Please select all that apply Baby clothes [IF CHILDREN IN HOUSEHOLD] School wear [IF CHILDREN IN HOUSEHOLD] Other children’s wear [IF CHILDREN IN HOUSEHOLD] Clothes for daytime leisure Clothes for work Clothes for going out and socialising Celebrity / designer dresses Fancy dress Formal wear (e.g. weddings, evening wear, etc.) Clothes for sporting or outdoor activities (e.g. ski wear) Winter or summer clothes Maternity wear None, I would not consider hiring clothes on a more regular basis than I do currently (SA) None, I would never consider hiring clothes (SA)
Clothing behaviour research 120
11-049455-01 - Clothing report - v6 FINAL - 16 Mar 2012 - INTERNAL USE (1)
Q17b MA ROTATE ORDER OF OPTIONS ASK ALL THOSE WHO WOULD CONSIDER HIRING AN ITEM AT Q17a (ANY CODES 1-12) Why might you consider hiring an item of clothing? Please select all that apply For a special occasion / as a ‘one off’ Greater choice / variety in my wardrobe To keep up with the latest fashion To reduce the risk of having items I dislike after wearing them a few times To be able to wear something I normally couldn’t afford to buy To avoid having lots of nearly-new clothes which my child / baby has grown out of [PARENTS ONLY] To avoid ending up with a wardrobe full of clothes that I don’t wear (e.g. if my size changes) To reduce the overall amount of money I spend on clothes Other (specify) None of the above (SA) Q18a MA ROTATE ORDER OF STATEMENTS (GROUP FIRST THREE CODES TOGETHER IN TERMS OF ROTATION) ASK ALL Which of the following types of clothing, if any, have you leased in the last 12 months? Leasing is different from hiring in that it involves a longer term rental (typically one to six months). Please select all that apply Baby clothes [IF CHILDREN IN HOUSEHOLD] School wear [IF CHILDREN IN HOUSEHOLD] Other children’s wear [IF CHILDREN IN HOUSEHOLD] Clothes for daytime leisure Clothes for sporting or outdoor activities (e.g. ski wear) Clothes for work Clothes for going out and socialising Designer clothing Fancy dress Formal wear (e.g. weddings, evening wear, etc.) Maternity wear Winter or summer clothes None of the above (SA)
Clothing behaviour research 121
11-049455-01 - Clothing report - v6 FINAL - 16 Mar 2012 - INTERNAL USE (1)
Q18b MA ROTATE ORDER OF STATEMENTS (GROUP FIRST THREE CODES TOGETHER IN TERMS OF ROTATION) ASK ALL And which, if any, of the following types of clothing might you consider leasing if it was made easier? Please select all that apply Baby clothes [IF CHILDREN IN HOUSEHOLD] School wear [IF CHILDREN IN HOUSEHOLD] Other children’s wear [IF CHILDREN IN HOUSEHOLD] Clothes for daytime leisure Clothes for sporting or outdoor activities (e.g. ski wear) Clothes for work Clothes for going out and socialising Designer clothing Fancy dress Formal wear (e.g. weddings, evening wear, etc.) Maternity wear Winter or summer clothes None, I would not consider leasing clothes on a more regular basis than I do currently (SA) None, I would never consider leasing clothes (SA) Q19 MA ROTATE ORDER OF OPTIONS ASK ALL THOSE WHO WOULD CONSIDER LEASING AN ITEM AT Q18b (ANY CODES 1-12) Why might you consider leasing an item of clothing? Please select all that apply For a special occasion / as a ‘one off’ Greater choice / variety in my wardrobe To keep up with the latest fashion To reduce the risk of having items I dislike after wearing them a few times To be able to wear something I normally couldn’t afford to buy To avoid having lots of nearly-new clothes which my child / baby has grown out of [PARENTS ONLY] To avoid ending up with a wardrobe full of clothes that I don’t wear (e.g. if my size changes) To reduce the overall amount of money I spend on clothes If I became pregnant [WOMEN ONLY] Other (specify) None of the above (SA) Q20 SA FOR EACH ROW ROTATE ORDER OF STATEMENTS REVERSE SCALE FOR 50% ASK ALL THOSE WHO WOULD CONSIDER LEASING AN ITEM AT Q18b (ANY CODES 1-12) To what extent do you agree or disagree with the following statement? Please select the option that applies DOWN SIDE OF GRID: I would only consider leasing an item if it was new and unused ACROSS TOP OF GRID: Strongly agree Tend to agree Neither agree nor disagree Tend to disagree Strongly disagree Don’t know Clothing behaviour research 122
11-049455-01 - Clothing report - v6 FINAL - 16 Mar 2012 - INTERNAL USE (1)
Q21a SA REVERSE SCALE FOR 50% ASK ALL It has been suggested that consumers should be able to sell back clothing in good condition to high street and online retailers. If such a scheme was introduced near you, how likely, if at all, would you be to use it? Please select the option that applies Definitely Very likely Fairly likely Not very likely I would never do this Don’t know Q21b MA ROTATE ORDER OF STATEMENTS (GROUP FIRST THREE CODES TOGETHER IN TERMS OF ROTATION) ASK ALL THOSE WHO WOULD CONSIDER BUY BACK SCHEME (CODES 1-4 AT Q21a) If this service was available, what type of clothes might you sell back, if any? Please select all that apply Baby clothes [IF CHILDREN IN HOUSEHOLD] School wear [IF CHILDREN IN HOUSEHOLD] Other children’s wear [IF CHILDREN IN HOUSEHOLD] Clothes for daytime leisure Clothes for sporting or outdoor activities (e.g. ski wear) Clothes for work Clothes for going out and socialising Designer clothing Fancy dress Formal wear (e.g. weddings, evening wear, etc.) Maternity wear Winter or summer clothes None, I would not consider selling back clothes (SA) Q21c WRITE IN AMOUNT FOR EACH ROW ASK ALL THOSE WHO WOULD CONSIDER BUY BACK SCHEME (CODES 1-4 AT Q21a AND NOT ‘NONE’ AT Q21b) For each of the following items what would be the minimum amount you might expect to receive to make it worth your while to sell it back? Please enter the amount or select the option that applies [ITEMS TO APPEAR ON INDIVIDUAL SCREENS, NOT GRID, REPEAT QUESTION ON EACH SCREEN] An item of clothing you had paid £15 for An item of clothing you had paid £50 for An item of clothing you had paid £100 for [INSERT IN POUNDS] I would not bother to sell it back in this instance Don’t know
Clothing behaviour research 123
11-049455-01 - Clothing report - v6 FINAL - 16 Mar 2012 - INTERNAL USE (1)
Q22 MA ROTATE ORDER OF STATEMENTS (GROUP FIRST THREE CODES TOGETHER IN TERMS OF ROTATION) ASK ALL WHO BUY CLOTHES (EXCEPT CODE 1 AT Q1) Assuming they had been returned to the retailer in good condition by another customer after being worn, which, if any, of the following types of clothing would you consider buying at a discount from a major high street or online retailer? Please select all that apply Baby clothes [IF CHILDREN IN HOUSEHOLD] School wear [IF CHILDREN IN HOUSEHOLD] Other children’s wear [IF CHILDREN IN HOUSEHOLD] Clothes for daytime leisure Clothes for sporting or outdoor activities (e.g. ski wear) Clothes for work Clothes for going out and socialising Designer clothing Fancy dress Formal wear (e.g. weddings, evening wear, etc.) Maternity wear Winter or summer clothes None, I would not consider doing this (SA)
Clothing behaviour research 124
11-049455-01 - Clothing report - v6 FINAL - 16 Mar 2012 - INTERNAL USE (1)
Current wardrobe – reuse The following questions ask you about clothes that you own, either at home, in storage or elsewhere, which you NO longer wear. Please consider all of the clothes that you own, even if they no longer fit you. Q23 ENTER TWO VALUES FOR EACH ROW ROTATE ORDER OF STATEMENTS ASK ALL For each of the following types of clothing, please can you say how many you own and how many you have NOT worn in the last 12 months? When answering the question please consider all of the items that you own, even if they no longer fit or you no longer store them at home. Please enter a value in each empty box DOWN SIDE OF GRID: Blouse Coat / Jacket Dress Fleece / bodywarmer Jeans Jumper / Knitwear (e.g. cardigan, sweater) Leggings
Nightwear
Shirt Shorts / cropped trousers Skirt Sportswear Suit Sweatshirt / Hoodie Swimwear Ties Top Trousers T-shirt / polo shirt Underwear / lingerie ACROSS TOP OF GRID: I own [ENTER AMOUNT (UP TO 500)] and I have not worn [ENTER AMOUNT (UP TO 500)] in the last 12 months [ENSURE THAT THE NUMBER THEY HAVE NOT WORN DOES NOT EXCEED THE NUMBER THEY OWN] Don’t know
Clothing behaviour research 125
11-049455-01 - Clothing report - v6 FINAL - 16 Mar 2012 - INTERNAL USE (1)
Q24 MA ASK ALL THOSE WHO HAVE NOT WORN SOME OF THEIR CLOTHES IN THE LAST 12 MONTHS (EXCLUDE ONLY IF THEY ENTER ‘0’ FOR ALL THE SECOND AMOUNTS AT Q23) For which of the following reasons have you NOT worn at least some of your clothes in the last 12 months? Please select all that apply Clothing wear & tear Can’t get stains out Colours have run / faded in the wash Misshapen following washing Moth holes Needs repairing for some other reason (e.g. torn, damaged) Shrunk in the wash Some aspect has failed (e.g. zip, elastic, lost buttons) Worn out (e.g. cuffs, sleeve, collar, seat) No longer suitable Change of culture / religion Change of location (e.g. moved somewhere with a different climate) Change of gender identity Maternity wear No longer fashionable No longer fits me No longer my style / taste Occasional wear For formal occasions only (e.g. job interviews, funerals) For outdoor / sports activities only (e.g. skiing) For special occasions only Sentimental value (e.g. wedding dress) Other reasons I received the item as an unwanted present I have been living away from home I can’t easily reach / access /get at the clothes I haven’t got round to throwing them out It is a high value item that I don’t want to throw out I lent this item to someone else I have too many clothes Other (specify) None of the above [SA] Q25 SA REVERSE SCALE FOR 50% ASK ALL THOSE WHO HAVE NOT WORN SOME OF THEIR CLOTHES IN THE LAST 12 MONTHS (EXCLUDE ONLY IF THEY ENTER ‘0’ FOR ALL THE SECOND AMOUNTS AT Q23) How many of the clothes you have not worn would you say no longer fit you and / or require altering? Please select the option that applies None Only a few Some of them (but less than half) Around half of them Many of them (not all but more than half) Nearly all of them All of them Don’t know Clothing behaviour research 126
11-049455-01 - Clothing report - v6 FINAL - 16 Mar 2012 - INTERNAL USE (1)
Q26 SA FOR EACH ROW ROTATE ORDER OF STATEMENTS REVERSE SCALE FOR 50% ASK ALL THOSE WHO HAVE NOT WORN SOME OF THEIR CLOTHES IN THE LAST 12 MONTHS (EXCLUDE ONLY IF THEY ENTER ‘0’ FOR ALL THE SECOND AMOUNTS AT Q23) For each of the following statements, how likely would each of them make you to wear more of the clothes you have not worn in the last 12 months? Please select one option for each row DOWN SIDE OF GRID: If I was able to update their appearance using new accessories If I added up the value of all the clothes I keep but no longer wear If I had the skills to repair or alter more of my clothes at home If I had access to a repair kit at home (e.g. needle and thread) If I had access to a sewing machine at home If I was more aware of environmental problems caused by clothing waste or production If more High Street shops offered tailoring services to repair or alter clothes If I could not afford to buy new clothes If my weight changed If I could get the stains out If I checked more regularly what I have in my wardrobe If the style came back into fashion If I had spare time available to repair or alter my clothes ACROSS TOP OF GRID: Very likely Fairly likely Not very likely Not at all likely Don’t know Q27 SA REVERSE SCALE FOR 50% ASK ALL THOSE WHO HAVE NOT WORN SOME OF THEIR CLOTHES IN THE LAST 12 MONTHS (EXCLUDE ONLY IF THEY ENTER ‘0’ FOR ALL THE SECOND AMOUNTS AT Q23) How many of the clothes you have not worn would you say could be used if repaired? Please select the option that applies None Only a few Some of them (but less than half) Around half of them Many of them (not all but more than half) Nearly all of them All of them Don’t know
Clothing behaviour research 127
11-049455-01 - Clothing report - v6 FINAL - 16 Mar 2012 - INTERNAL USE (1)
Q28a MA ASK ALL Below is a list of possible repairs or alterations. Which, if any, would you be able to do yourself? Please select all that apply Darn or patch a hole Dye an item Redesign an item (e.g. make shorts from jeans) Replace a pocket Replace a zip Sew a button on Take a hem up or down Take in or out (change the fit / size) None of them (SA) Q28b MA ROTATE ORDER OF OPTIONS ASK ALL Who, in your local area, would you be able to ask to undertake repairs or alterations on your behalf? Please select all that apply My spouse or partner My parents or grandparents My children Other neighbours, friends or nearby relatives High street clothing store Dry cleaner Tailor / independent store offering repair and alterations None of the above (SA) None, I would undertake all repairs or alterations myself (SA) Don’t know (SA) Q29 SA FOR EACH ROW ROTATE ORDER OF STATEMENTS REVERSE SCALE FOR 50% ASK ALL How interested, if at all, would each of the following people be in learning more about how to repair clothes? Please select one option for each row DOWN SIDE OF GRID: You Your spouse or partner My eldest child (IF 1 CHILD AGED 10 OR OVER AT QDEM10) My second eldest child (IF 2 CHILDREN AGED 10 OR OVER AT QDEM10) My third eldest child (IF 3 CHILDREN AGED 10 OR OVER AT QDEM10) Another child in my household (IF MORE THAN 3 CHILDREN AGED 10 OR OVER AT QDEM10) ACROSS TOP OF GRID: Very interested Fairly interested Not very interested Not at all interested Don’t know Not applicable
Clothing behaviour research 128
11-049455-01 - Clothing report - v6 FINAL - 16 Mar 2012 - INTERNAL USE (1)
Q30 MA ROTATE ORDER OF OPTIONS ASK ALL Do you regularly borrow clothes from any of the following people? Please select all that apply My spouse or partner My parents or grandparents My children My brother(s) or sister(s) My close friends Other neighbours, friends or nearby relatives My work colleagues I don’t borrow clothes from anyone (SA) Don’t know (SA)
Clothing behaviour research 129
11-049455-01 - Clothing report - v6 FINAL - 16 Mar 2012 - INTERNAL USE (1)
Laundry Q31 SA ASK ALL Which of the following best describes the extent to which you are responsible for washing clothes in your household, whether this is done at home or in a laundrette? By being responsible, we mean that you wash at least some of the clothes yourself. Please select the option that applies I I I I I
never take responsibility for washing clothes in my household sometimes take responsibility for washing clothes in my household share responsibility for washing clothes in my household mostly take responsibility for washing clothes in my household take sole responsibility for washing clothes in my household
Q32 MA ROTATE ORDER OF STATEMENTS ASK ALL Which, if any, of the following types of clothes do you tend to wear more than once before putting it in the laundry? Please select all that apply Blouse Dress Fleece / bodywarmer Jeans Jumper / Knitwear (e.g. cardigan / sweater) Leggings Nightwear Shirt Shorts / cropped trousers Skirt Socks Sportswear Suit Sweatshirt / Hoodie Swimwear Ties Top Trousers T-shirt / polo shirt Underwear / lingerie Other (specify) I never wear clothes more than once before putting them in the laundry [SA]
Clothing behaviour research 130
11-049455-01 - Clothing report - v6 FINAL - 16 Mar 2012 - INTERNAL USE (1)
Q33 MA ROTATE ORDER OF OPTIONS ASK ALL What, if anything, would result in you wearing your clothes for longer before putting them in the laundry? Please select all that apply If my clothes were more stain resistant If my clothes smelt fresher for longer If I was aware of other people I know doing this If someone I trusted recommended it If I thought it would help preserve the look or feel of the garment If I knew how much money I would save by running the washing machine less often If energy prices continue to increase If I had somewhere convenient to store or air clothes I have worn If I felt it would help the environment (e.g. reduce energy and water consumption) Other (specify) Don’t know (SA) Nothing, I do not want to wear my clothes any longer than I do (SA) Q34 MA ROTATE ORDER OF OPTIONS ASK ALL WHO HAVE SOME RESPONSIBILITY FOR WASHING CLOTHES (CODES 2-5 AT Q31) Which, if any, of the following do you have at home? Please select all that apply A washing machine A washer dryer A twin tub A tumble dryer A spin dryer An iron An airing cupboard A clothes rack A clothes line (inside) A clothes line (outside) None of the above (SA) Don’t know (SA)
Clothing behaviour research 131
11-049455-01 - Clothing report - v6 FINAL - 16 Mar 2012 - INTERNAL USE (1)
Q35a SA FOR EACH ROW ROTATE ORDER OF STATEMENTS ASK ALL WHO HAVE SOME RESPONSIBILITY FOR WASHING CLOTHES (CODES 2-5 AT Q31) When washing clothes how often, if at all, do you do each of the following? Please select one option for each row DOWN THE GRID: Wash at 30oC or less, or on an eco-setting (if available) Wash a full load Sort washing between those which require a longer wash and those that don’t Sort washing between those which require a hot wash and those that don’t Dry clothes in a tumble dryer in the winter [ASK IF HAVE TUMBLE DRYER OR WASHER DRYER AT Q34] Dry clothes in a tumble dryer in the summer [ASK IF HAVE TUMBLE DRYER OR WASHER DRYER AT Q34] ACROSS THE GRID: Always More often than not About half the time Less than half the time Never Don’t know Not applicable Q35b SA REVERSE SCALE FOR 50% ASK ALL WHO HAVE SOME RESPONSIBILITY FOR WASHING CLOTHES (CODES 2-5 AT Q31) When washing clothes, what temperature do you mostly wash your clothes at? Please select the option that applies Less than 30oC 30oC 31-40oC 41-50oC 51-60oC 61-90oC The eco-setting (but I’m not sure of the temperature) Another setting (but I’m not sure of the temperature) I do not wash most of my clothes at any one temperature Other (specify) Don’t know Q36 SA REVERSE SCALE FOR 50% ASK ALL How important, if at all, is it that your clothes are ironed? Please select the option that applies Very important Fairly important Not very important Not at all important Don’t know
Clothing behaviour research 132
11-049455-01 - Clothing report - v6 FINAL - 16 Mar 2012 - INTERNAL USE (1)
Q37 MA ASK ALL WHO HAVE SOME RESPONSIBILITY FOR WASHING CLOTHES (CODES 2-5 AT Q31) Which, if any, of the following behaviours might you seriously consider doing more often in future? Please select all that apply LIST ACTIONS DON’T ALWAYS DO (FROM Q35a): Ensure that, when you wash, the temperature is 30oC or less, or on an eco-setting (if available) [ASK IF OWN WASHER DRYER / WASHING MACHINE AT Q34] Ensure that, when you wash, you have a full load [ASK IF OWN WASHER DRYER / WASHING MACHINE AT Q34] Sort items between those which require a longer wash and those that don’t Sort items between those which require a hot wash and those that don’t None of the above (SA)
Q38 MA ASK ALL WHO HAVE SOME RESPONSIBILITY FOR WASHING CLOTHES (CODES 2-5 AT Q31) Which, if any, of the following behaviours might you seriously consider doing less often in future? Please select all that apply Iron your clothes LIST ACTIONS SOMETIMES DO (FROM Q35a): Wash items that have only been worn once Tumble dry clothes in the winter [ASK IF OWN WASHER DRYER / TUMBLE DRYER AT Q34] Tumble dry clothes in the summer [ASK IF OWN WASHER DRYER / TUMBLE DRYER AT Q34] None of the above (SA) Q39 MA ROTATE ORDER OF OPTIONS ASK ALL THOSE WHO DO NOT ALWAYS WASH CLOTHES AT 30oC OR LESS (ASK ALL EXCEPT CODE 1 AT Q35a PART 1) What, if anything, would result in you washing your clothes on an eco-setting (e.g. at 30oC) more often? Please select all that apply If more of my clothes labels said the recommended wash was 30oC If I knew how much money I could save by washing at 30oC compared to higher temperatures If cheaper brands of washing power / liquid were available for use at 30oC If most people considered this the right thing to do If my clothes smelt fresher for longer If I was aware of other people I know doing this If someone I trusted recommended it If the washing machine had a programme for 30oC or less (eco-setting) If energy prices continue to increase If I felt it would help the environment If I felt that my clothes would be clean after washing at 30oC or less Other (specify) Don’t know (SA) Nothing, I do not wish to wash clothes at 30oC more often than I do (SA)
Clothing behaviour research 133
11-049455-01 - Clothing report - v6 FINAL - 16 Mar 2012 - INTERNAL USE (1)
Q40 MA ROTATE ORDER OF OPTIONS ASK ALL THOSE WHO DO NOT ALWAYS WASH WITH A FULL LOAD (ASK ALL EXCEPT CODE 1 AT Q35a PART 2) What, if anything, would result in you washing more full loads? Please select all that apply If I had more space where I could store smelly or dirty clothes If I had the time to do more hand washing If I knew how much extra it costs to run half loads If I or others in my household owned more clothes If most people considered this the right thing to do If my clothes smelt fresher for longer If I was aware of other people I know doing this If someone I trusted recommended it If the washing machine warned me when I had less than a full load If energy prices continue to increase If I felt it would help the environment If I knew more about washing different types of clothes (i.e. which colours / fabrics you can wash together) Other (specify) Don’t know (SA) Nothing, I do not wish to wash more full loads than I do (SA) Q41 MA ROTATE ORDER OF OPTIONS ASK ALL THOSE WHO SOMETIMES TUMBLE DRY (ANY CODE 1-4 AT Q35a PART 5 OR PART 6) What, if anything, would result in you tumble drying your clothes less often? Please select all that apply If I had more space to hang clothes If I had a line I could put up outdoors If I had an indoor clothes airer If more of my clothes were made out of fabrics that dried quicker If I knew how much extra it costs to tumble dry clothes If most people considered this the right thing to do If I was aware of other people I know doing this If someone I trusted recommended it If energy prices continue to increase Other (specify) Don’t know (SA) Nothing, I never use the tumble dryer / washer dryer to dry clothes (SA) Nothing, I do not wish to tumble dry less than I do (SA)
Clothing behaviour research 134
11-049455-01 - Clothing report - v6 FINAL - 16 Mar 2012 - INTERNAL USE (1)
Q42 MA ROTATE ORDER OF OPTIONS ASK ALL What, if anything, would result in you ironing your clothes less often? Please select all that apply If I felt less pressure to look a particular way at work or when going out If my clothes were made out of fabrics that kept their shape more If I knew how much extra it costs to iron clothes If I thought it might damage my clothes in the long run If most people considered this the right thing to do If I was aware of other people I know doing this If someone I trusted recommended doing it If energy prices continue to increase Other (specify) Don’t know (SA) Nothing, my clothes are never ironed (SA) Nothing, I do not wish to iron my clothes less often (SA) Q43 MA ROTATE ORDER OF OPTIONS ASK ALL THOSE WHO DO NOT ALWAYS SORT WASHING INTO CLOTHES THAT REQUIRE LONGER WASHES AND THOSE THAT DON’T (ASK ALL EXCEPT CODE 1 AT Q35a PART 3) What, if anything, would result in you separating your clothes more often into those that require longer washes and those that don’t? Please select all that apply If I felt it was worth spending the time and effort involved If my experience was that shorter washes are just as effective at cleaning certain clothes If I understood in more detail the various programmes on the washing machine If I had more space for storing clothes that need to be washed If I or others in my household had more clothes If I knew how much extra it costs to wash clothes for longer than necessary If most people considered this the right thing to do If I was aware of other people I know doing this If someone I trusted recommended doing it If energy prices continue to increase Other (specify) Don’t know (SA) Nothing, I do not wish to separate my clothes more than I do (SA)
Clothing behaviour research 135
11-049455-01 - Clothing report - v6 FINAL - 16 Mar 2012 - INTERNAL USE (1)
Discard – once you’ve decided to remove an item from your wardrobe Q44 SA ASK ALL Which of the following best describes the extent to which you are responsible for getting rid of clothes in your household? Please select the option that applies I I I I I
never take responsibility for getting rid of clothes in my household sometimes take responsibility for getting rid of clothes in my household share equal responsibility for getting rid of clothes in my household mostly take responsibility for getting rid of clothes in my household take sole responsibility for getting rid of clothes in my household
Q45a SA FOR EACH ROW ROTATE ORDER OF STATEMENTS ASK ALL THOSE WITH SOME RESPONSIBILITY FOR GETTING RID OF CLOTHES (CODES 2-5 AT Q44) In the last 12 months, how many of the clothes which you got rid of, have you done so in the following ways? Please select one option for each row DOWN THE GRID: Cash for Clothes shop Car boot sale Donated directly to people in need (i.e. homeless / neighbours) Donated them to a charity shop Donated them to friends and relatives Donated to jumble sale Doorstep / kerbside collection of clothes organised by registered charity Doorstep / kerbside collection of clothes organised by textile trader Doorstep / kerbside collection of clothes organised by the council Given away online (e.g. Freecycle, Freegle) Put them in the bin Sold clothes online (e.g. eBay) Taken them to a household recycling centre / tip (rubbish dump) Taken them to clothes swapping parties / events Taken them to textiles / clothing bin (e.g. at supermarket car park) Used for rags ACROSS THE GRID: All of them Many of them About half of them Some of them A few of them None of them, I don’t have access to this service None of them, I didn’t know this service was available None of them, I have chosen not to use this service Don’t know
Clothing behaviour research 136
11-049455-01 - Clothing report - v6 FINAL - 16 Mar 2012 - INTERNAL USE (1)
Q46 MA ROTATE ORDER OF OPTIONS ASK ALL THOSE WHO GET RID OF CLOTHES THROUGH HOUSEHOLD WASTE (CODES 1-5 AT Q45a, PART 11) For those clothing items which you put in the bin, what are the main reasons why you do this? Please select all that apply It is too inconvenient to use facilities for recycling or reuse The items have no monetary value Not aware of any alternatives No nearby facility for recycling or reuse No regular doorstep collection for recycling or reuse It is too time consuming to use facilities for recycling or reuse Lack of space to store them until I can recycle or reuse them Items are too personal to get rid of another way (e.g. underwear) This item could never be used again for any purpose (e.g. too damaged or dirty) Other (specify) Don’t know (SA) None of the above (SA) Q47 MA ASK ALL THOSE WITH SOME RESPONSIBILITY FOR GETTING RID OF CLOTHES (CODES 2-5 AT Q44) What, if anything, would result in you selling more clothing online or through community sales (e.g. car boot)? Please select all that apply If I thought I could get a reasonable amount of money from it If my clothes were of better quality and worth more than they are If I knew more about the different places near me that I could do this If I knew more about selling items online If I had greater trust that selling online is secure If I was charged directly for the amount of waste I throw out If most people considered this the right thing to do If I was aware of other people I know doing this If someone I trusted recommended doing it If I believed it would help the environment (e.g. to reduce waste) If I had enough spare time available Other (specify) Don’t know (SA) Nothing, I already sell all of the unwanted clothes I can online or through community sales (SA) Nothing, I do not wish to do this (SA)
Clothing behaviour research 137
11-049455-01 - Clothing report - v6 FINAL - 16 Mar 2012 - INTERNAL USE (1)
Q48 MA ROTATE ORDER OF OPTIONS ASK ALL THOSE WHO GET RID OF CLOTHES THROUGH HOUSEHOLD WASTE (CODES 1-5 AT Q45a, PART 11) What, if anything, would result in you giving unwanted clothes to an organisation which reuses or recycles them rather than put them in your household waste collection? Please select all that apply If they gave me a high street voucher in exchange If I thought that damaged or heavily worn clothing was of value to them If they gave me a small amount of money If I could get loyalty points for a household retailer (such as Nectar or Tesco Clubcard) If more charities were to organise a doorstep / kerbside collection of old clothes / textiles in my area If there was a communal bin for old clothes / textiles near my home which went to this type of organisation If I was charged directly for the amount of household waste I throw out If most people considered this the right thing to do If I was aware of other people I know doing this If someone I trusted recommended doing it If I believed it would help the environment Other (specify) Don’t know (SA) Nothing, I do not wish to do this (SA) Nothing I already give all my unwanted clothes to organisations that recycle or reuse them (SA) Q49 SA ASK ALL Which of the following best describes your view about getting rid of clothes? Please select the option that applies I already do everything I can to minimise my contribution to clothing waste I could do more to cut back on unnecessary clothing purchases and to repair and maintain clothes AND would like to do so I could do more to change my current purchasing and use of clothing in order to reduce waste BUT I am not interested in doing so
Clothing behaviour research 138
11-049455-01 - Clothing report - v6 FINAL - 16 Mar 2012 - INTERNAL USE (1)
Q50a WRITE IN AMOUNT ASK ALL Please estimate the value of replacing all of the clothes that you own at home or elsewhere (for example in storage) which were bought for your own personal use. Please do not include footwear or accessories such as hats, gloves, belts, handbags and jewellery within your estimate. Please enter the amount. If you are unsure, please do your best to provide an estimate. £ [INSERT IN POUNDS] – LIMIT £1,000,000 Don’t know Refused The following list may help you. Include: Blouses, Coats/Jackets, Dresses, Fleeces / bodywarmers, Jeans, Jumpers / Knitwear (e.g. cardigans, sweaters), Leggings, Nightwear, Shirts, Shorts / cropped trousers, Skirts, Socks, Sportswear, Suits, Sweatshirts / Hoodies, Swimwear, Ties, Tops, Trousers, T-shirts / polo shirts, Underwear / lingerie. Q50b SA ASK ALL WHO REFUSE OR DON’T KNOW AT Q50a We appreciate that it may be difficult or uncomfortable to estimate the value of all of the clothes that you own. Would you mind estimating using the categories below? Please select the option that applies Less than £500 £500-999 £1000-1999 £2000-2999 £3000-3999 £4000-4999 £5000-9999 Over £10000 Don’t know Refused
Clothing behaviour research 139


![Technical report templates version B FINAL - Wrap [PDF]](https://m.moam.info/img/260x300/technical-report-templates-version-b-final-wrap-pd_6479b433098a9e6a0c8b45d7.jpg)