Indian Journal of Science and Technology, Vol 8(31), IPL0686, November 2015
ISSN (Print) : 0974-6846 ISSN (Online) : 0974-5645
Temperature Prediction using Finite Element Modeling on Friction Stir Welding of AA6061-AZ61 L. A. Kumaraswami Dhas1*, D. Raguraman2, D. Muruganandam3 and B. Senthilkumar3 1
Department of Mining Machinery Engineering, Indian School of Mines, Dhanbad-826 004, Jharkhand, India;
[email protected] 2 Department of Production Engineering, Sri Sairam Engineering College, Chennai-600 044, Tamil Nadu, India;
[email protected],
[email protected],
[email protected]
Abstract Background/Objectives: The objective of this paper is on developing a thermo-mechanical model to predict the thermal histories of the FSW butt joint of AA 6061-AZ61. Methods/Statistical Analysis: The FEM model is developed for the temperature and residual stress characteristics of the weld material. The friction serves as the heat source which exists between the pin and plate as well as the shoulder and plate. To understand the dynamics of the Friction Stir Welding thermal and residual effects,the thermal history and the evolution of longitudinal, lateral residual stresses in the friction stirred weld are simulated using ANSYS. Findings: The temperature influences on Von-mises stress and strain on the different zones are analyzed. The contour technique using Coordinate Measuring Machine (CMM) is used to measure the residual stress of the welded plate.It is found that the proposed model is correlated with experimental result. Application/ Improvements: The developed FEM model can be used as one of the tool for correlating the temperature and residual stresses on the weld zone. The CMM also can be used to predict the residual stresses through contour measurement.
Keywords: Finite Element Method, Friction Stir Welding, Residual Stress, Temperature Distribution,Thermo-Mechanical Model
1. Introduction Advanced joining technology is the current research interest in the manufacturing processes of light weight structures.he design of lightweight structures like aircrat panels and vehicle body shells can be welded efectively. Considerable efort by researchers has been made to develop various joining processes and their assessment on suitability for use in lightweight structures1–5. Apart from the advantages of FSW as a new welding technique for welding dissimilar alloys, the knowledge of temperature gradient and residual stresses are still not completely understood. It is well known that the residual stresses of the weld will negatively afects the fatigue character and anti corrosion efects6,7. Several investigations of the residual stress distribution in FSW weld were conducted by experimental methods. * Author for correspondence
Webster et al.8 reported a measurement of residual stress in FSW welded Al 7108 by the synchrotron X-ray technique,which shows that the longitudinal residual stress varies in the range from 60 to 140 MPa and also shows a correlation between the detailed residual stress features and the heat low in the weld. Sutton et al.9 investigated the residual stress in 2024-T3 aluminum friction stir butt welds using the neutron difraction technique and the results show that the highest stresses occur near the crown side of the weld over the entire FSW region. To gain physical perception of the Friction Stir Welding process and the prediction of the residual stresses, it is a need to develop numeric models or simulation. It will also be advantageous that developed model (s)/simulation used to minimize the residual stresses in the weld. he developed method with optimal parameters will guide the
Temperature Prediction using Finite Element Modeling on Friction Stir Welding of AA6061-AZ61
implementation of the process. Song and Kovacevic have studied the heat transfer in FSW using the inite diference method10,11. Few papers have directly involved with the modeling of the thermo-mechanical stress analysis in FSW. Chao12 proposed a model to predict the thermal history and the subsequent thermal stress and distortion of the workpiece without involving the mechanical efect of the tool. Dong13 developed several models to separately deal with the subproblems of heat transfer, material low and plastic low. From the point of physics for the FSW process, the mechanical efect of the tool needs to be included into the thermomechanical model. he Finite Element Method (FEM) is proposed for model on this paper to study the thermal impact and evolution of the residual stresses in the weld and tool. his study is accomplished by parametrically studying the efects of varying welding parameters, primarily the traverse speed of the tool. he entire welding process is simulated using the commercial inite element package ANSYS. Experiments on a welding of Al 6061-T6 and AZ61 are also carried out. he temperature history and the residual stresses for the welded plates are measured by the contour technique for a comparison with the calculated results.
he rate of heat generation at shoulder and the top surface of the base metal is a function of the angular velocity w, coeicient of friction m and radius r. As the m (T) and p (T) are dependent on the local temperature and the radius r, Equation 3 is diicult to evaluate. he coeicient of friction is expected to decrease as the temperature increases and the plastic deformation increases. A constant value of the coeicient of friction is used to approximate the comprehensive efect of plastic and thermal efects during Friction Stir Welding. he predicted temperature gradients are veriied with the measured temperature values. he heat generation in the surface area of the probe is considered the same as that of the shoulder surface area with a radius equal to that of the probe.
1.1 Model Description
1.1.2 Mechanical Model
1.1.1 Heat Transfer Model he heat transfer in FSW contains conduction, convection and radiation. he governing equation for transient heat transfer analysis during the FSW process is given as follows: rC
¶T ¶ ¶T = (K ) + Q pd + Q pin ¶t ¶x ¶x
(1)
Where, p is the density of material; C is the speciic heat capacity; K is the thermal conductivity of the workpiece; he term Qpd is the heatgeneration rate caused by plastic deformation in the work piece far from the interface and Qpin is heat generation at the tool’s pin side with workpiece interface that are inserted as a rate per unit volume at near the tool pin. he heat generated at the interface between horizontal surfaces of the tool (shoulder and pin tip) will be applied as a boundary condition. he friction between the rotating tool and the base metals to be welded is considered as the main heat source in Friction Stir Welding. Considering an elemental friction at the contact surface between the tool shoulder and the 2
Vol 8 (31) | November 2015 | www.indjst.org
top surface of base metal, the rate of heat generation derived in the element at radius r is: (2)
dQ = 2pwr 2 m(T ) p(T )dr
he heat generation rate over the entire interface of the contact on the pin surface will be: Rp
2 Q = ò 2pwr 2 m(T ) p(T )dr = pwm(T ) p(T )R 3p 3 0
(3)
he force equilibrium on an arbitrary volume results in the following governing equation known as the equilibrium equation: (4) Div(W) + F = r.a V
Where Ὠ is the stress tensor, p is the equivalent density, a is the acceleration and FV is the volume force intensity. he inertia efect is neglected in this model since a constant rotational speed and a constant longitudinal speedare used during FSW. In the displacement formulation, the essential boundary conditions are speciied as follows: For the clamed portion of the plate surface and the normal displacement, U=0 (5) For the bottom of the plate at y = 0, Uy= 0 (6)
1.1.3 Finite Element Model he ANSYS 14 is used as a commercial FEM sotware to carry out the numerical simulation. For the prediction
Indian Journal of Science and Technology
L. A. Kumaraswami Dhas, D. Raguraman, D. Muruganandam and B. Senthilkumar
of temperature and multi-linear strain hardening efects Lagranrian’s model is incorporated in this simulation. he element topology used is eight nodes and has stress stifening, plasticity, large strain capabilities and large delection14. Symmetry along the weld line is assumed in the numerical evaluation, so the welded plate is meshed with a total of 12649 nodes. he moving heat sources of the pin and the shoulder are represented as moving nodes of the heat generation in each computational time step. he relatively larger contact region of the shoulder and the work piece is expected to contribute a large part of the mechanical stress, especially in the upper half part of the weld. he temperature gradient is large around the welding zone and seriously changes the materials properties. In order to increase the accuracy of the mechanical solution, the thermal and mechanical solutions are coupled with the temperature data at each increment time and is used to evaluate the mechanical properties and the thermal parameters.
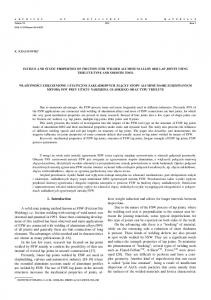
2. Experimental Setup 2.1 FSW implementation he 6061-T6 Al alloy plates and AZ61 plates, each with a dimension of 100 x 50 x 6 mm are butt welded in the Friction Stir Welding machine. he schematic sketch of the Friction Stir Welding process is shown in Figure 1.
Figure 1. Schematic illustration of friction stir welding process.
In this experimental work, ten thermal couples are embedded in retreating side of plate on which ive are located 1.2 mm below the upper surface and the other ive are located 1.2 mm from the root surface, with a distance of 12, 15, 18 and 21 mm respectively from the weld nugget. he gap between the thermocouples in the longitudinal
Vol 8 (31) | November 2015 | www.indjst.org
direction is 12 mm. A micrometer measurement unit attached with sensor is used to monitor the plunge depth of the tool. Temperatures are acquired and recorded in a time-duration of 100 milli seconds by a LABVIEW. he specimens, each having dimensions of 25 x 25 mm are cut with a waterjet cutting machine and are subsequently polished. To minimize the mechanical efect induced by the sample polishing at least 0.015 mm depth of the outer layer of the specimen was etched away with Keller’s reagent.
2.2 Residual Stress Measurement using CMM To determine the residual stress over a cross-section contour method can be used. he contour method is working with the principle that when a work material is cut into two halves along a straight line and the cut portions will deform as the residual stresses normal to the surface are released during cutting. he deformations of the cut portions can be measured as contour measurement technique and helps to determine the initial residual stress on the cut plane. he contour method is being unique as it provides a full two dimensional details of the residual stress component normal to the cross section15,16. From References15,16, main procedures of the contour method include: 1. specimen preparation by cutting, 2. contour measurement, 3. data processing and 4.inite element analysis to determine residual stress.
Figure 2. Contour measurement using CMM.
he measurement of the weld surfaces in the present study was performed using a HEXAGON GLOBAL Coordinate Measuring Machine (CMM). he selection of point spacing is very important for the proile measurement of the weld surface. For the stress measurement in the weldment, both halves of the welds were measured with a point spacing of approximately 0.5 mm in the transverse as well as axial directions of tool
Indian Journal of Science and Technology
3
Temperature Prediction using Finite Element Modeling on Friction Stir Welding of AA6061-AZ61
and in the weld region a dense point spacing of 0.25 mm was used17. In Reference18, the measurement points were designed in a fashion with 1 mm increment. For 6 mm thick specimen, the 0.5 mm point spacing is applied for entire cut portions. he contour measurement is shown in Figure 2, the measured raw data for 6 mm thick specimens are shown in Figure 3.
Zone (TMAZ); 3. Heat Afected Zone (HAZ); and 4. he base metal. In the NZ, the reined grains get equiaxed and are responsible to the dynamic re-crystallization. he HAZ usually contains a vast amount of coarsened grains with relatively lesser yield strength than that in the NZ and the TMAZ.
3.2 Study of Temperature–Time History in FSW
Figure 3. Contour measurement data from CMM for the weld surface.
Figure 5 shows the temperature and temperature gradient contours in the cross-section perpendicular to the welding direction. In the Nugget Zone the highest temperature is observed from the lateral surface of shoulder to the pin root side as the rotation of the shoulder and pin contacts with the plate and responsible for higher heat lux. he relative heat generation and dissipation at the contact surfaces causes the temperature contour in the NZ to make a “V” shape of distribution.
he most important criterion on data analysis is the alignment of measured data with the average of the two sets of measurements as it is essential to remove shear stress efects on cutting imperfections.
3. Result and Discussion 3.1 Typical Microstructure of the FSW Weld he micro structure of the weld is resulted from a dynamics of the physical process and is strongly relevant to the history of thermal efects and/or the plastic deformation on the weld region. he residual stress distribution is afected due to temperature distribution and plastic deformation.
Figure 4. Optical micrograph for the weld surface.
Figure 4 shows a typical optical micro graph taken from the prepared specimen for metallography. he optical micro-graph reveals four unique regions: 1. Nugget Zone (NZ); 2. hermo-Mechanically Afected 4
Vol 8 (31) | November 2015 | www.indjst.org
Figure 5. Temperature gradient with the loading of pin and its transient low on z-direction (V = 100 mm/min, ω = 800 rpm).
Figure 6. Temperature gradient with the loading of pin and its transient low on y-direction (V = 100 mm/min, ω = 800 rpm).
Figure 6 shows that the maximum temperature gradient in the lateral direction (y-direction) observed in the region nearer to the edge of the shoulder. Indian Journal of Science and Technology
L. A. Kumaraswami Dhas, D. Raguraman, D. Muruganandam and B. Senthilkumar
Figure 7. Contour Temperature gradient with the loading of pin and its transient low on x-direction (V = 100 mm/ min, ω = 800 rpm).
he highest heat generation in the NZ region and the highest heat dissipation from the NZ region to nearby shoulder edge contact regions. he temperature gradient contours in the x-direction (longitudinal direction) on the upper surface during welding are revealed in Figure 7, which proves that the region contacted with the lateral surface of the shoulder is subjected to the higher temperature gradient efect. It is believed that the “V”type of temperature gradient distribution in the weld zones contributes to coarsening of grains in the HAZ and the TMAZ shown in Figure 4. Figure 8 shows a comparison of the calculated and the measured temperature–time history at the location 10 mm to the weld center-line and 1.6 mm below the upper surface of the weld plate. he respective rotational and the traverse speeds of the tool are 500 rpm and 140 mm/min. In the beginning stage of the welding, the calculated
(a)
values are higher than the measured values, but they are lesser than the measured values once the maximum temperature is reached, which may be due to the assumption for the backing plate’s constant temperature. Actually, the temperature of the backing plate rises because of the rise in heat during welding and the decrements of cooling rate in the later stage of welding. However, the calculated temperature gradient values are in a reasonable agreement with the measured ones for the entire welding process. Figure 8 (b) shows a temperature distribution along the lateral direction (for nodes 1.6 mm below the top surface of the plate) at the impact when the shoulder’s center is passing over this location. It is clear that there is a decrement of temperature when there is a increments of the traverse speed especially in the weld zone. A good agreement between the measured and calculated temperature gradient values implies that this developed model can be used for the prediction of temperature history.
3.3 Analysis of Stress Distribution in the Weld he residual stresses will be raised in the weld zones during welding due to contraction during the cooling of the welds. Furthermore, the combined transverse and the rotational movements of the tool will cause additional stresses in the weld zone due to the mechanical constraints by the ixture on the weld plates .
(b)
Figure 8. A comparison of the calculated and measured temperature history. (a) Temperature – time proile for the location 15 mm to the weld centre line (V = 100 mm/min, ω = 800 rpm). (b) Temperature prole along the weld nugget to HAZ distance.
Vol 8 (31) | November 2015 | www.indjst.org
Indian Journal of Science and Technology
5
Temperature Prediction using Finite Element Modeling on Friction Stir Welding of AA6061-AZ61
Figure 9. Predicted three-dimensional residual stress distribution in the welded plate. (V = 100 mm/min, ω = 800 rpm).
the experimental values validate the eiciency of the proposed model. he prediction and measurement shows that the maximum temperature gradients in longitudinal and lateral directions are located just beyond the limits of shoulder edge and also shows that the longitudinal residual stress is greater than the lateral residual stress at the upper surface of the weld. he prediction implies that the higher stress is located in the region from top surface of weld zones to the mid depth of the weld plate. A higher traverse speed forces a more accumulation of high longitudinal stresses and a minor amount lateral stress ield in the weld zone, which make agreements with the previously reported measurements with the neutron techniques. Further development of the FSW requires further research of the mechanical action of the probe and the ixture condition to the residual stress distribution on the weld zones.
5. References
Figure 10. Predicted residual stress contour in the welded plate perpendicular to the cross section AA. (V = 100 mm/ min, ω = 800 rpm).
Figure 9 shows the residual stress contours in all three x-y-z directions of the welded plate. he predicted stress distribution in Figure 10 is like the one encountered in steel welds and also complies with measurements on friction stir welded AA 6061- AZ61 with the cut compliance method reported by Dalle Donne, et al.6. It is noticed that the initial contact portion and inal relieving portion of the weld have diferent stress distributions as compared with the nugget zone of the plate, which may be caused by the variation in the correlated thermomechanical process during the welding. At the end of the weld, the tool is lited up and it leaves the keyhole above the weld region due to compression stress.
4. Conclusion A three-dimensional modeling and measurement of the temperature and stress evolution in the FSW of 6061-T6 Al alloy and AZ 61 Magnesium alloy is conducted and 6
Vol 8 (31) | November 2015 | www.indjst.org
1. He X, Gu F, Ball A. Recent development in inite element analysis of self-piercing riveted joints. International Journalof Advanced Manufacturing Technology. 2012 Jan; 58(5):643–9. 2. He X. Finite element analysis of laser welding: A state of art review. Material Manufacturing Process. 2012; 27(12):1354–65. 3. He X. A review of inite element analysis of adhesively bonded joints. International Journalof Adhesion and Adhesives. 2011 Jun; 31(4):248–64. 4. He X. Recent development in inite element analysis of clinched joints. International Journal of Advanced Manufacturing Technology. 2010 May; 48(5):607–12. 5. He X, PearsonI, Young K. Self-pierce riveting for sheet materials: State of the art. Journal of Material Processing Technology. 2008 Apr; 199(1-3):27–36. 6. Dalle Donne C, Biallas G, Ghidini T, Raimbeaux G. Effect of welding imperfections and residual stresses on the fatigue crack propagation in friction stir welded joints.In: Second International Symposium on Friction Stir Welding;Gothenburg, Sweden: TWI; 2000 Jun 26–8. 7. Zucchi F, Trabanelli G, Grassi V. Pitting and stress corrosion cracking resistance of friction stir welded AA 5083. Materials Corrosion. 2001 Nov; 52(11):853–9. 8. Webster PJ, Djapic OL, Browne PA, Hughes DJ, Kang WP, Withers PJ, Vaughan GBM. Synchrotron X-ray residual strain scanning of a friction stir weld. Journal of Strain Analysis. 2001 Jan; 36(1):61–70. 9. Sutton MA, Reynolds AP, Wang DQ, Hubbard CR. A study of residual stresses and microstructure in 2024-T3 aluminum friction stir butt welds. Journal of Engineering Materials and Technology. ASME. 2002 Mar; 124(4):215–21.
Indian Journal of Science and Technology
L. A. Kumaraswami Dhas, D. Raguraman, D. Muruganandam and B. Senthilkumar
10. Song M, Kovacevic R.hermal modeling of friction stir welding in a moving coordinate and its validation. International Journal of Machine Tool and Manufacturing. 2003 May; 43(6):605–15. 11. Song M, Kovacevic R. Numerical simulation and experimental analysis of heat transfer process in friction stir welding process. Proceeding of Institution of Mechanical Engineers, Part B, Journal of Engineering Manufacture.2003 Jan; 217(1):p. 73–85. 12. Cao Y, QiX. hermal and thermo-mechanical modeling of friction stir welding of aluminum alloy 6001-T6. Journal of Materials Processing and Manufacturing Science. 1998: 7(10):215–33. 13. Dong P, Lu F, Hong JK, Cao Z. Coupled thermomechanical analysis of friction stir welding process using simpliied models. Science and Technology of Welding and Joining. 2001 Oct; 6(5):281–7.
Vol 8 (31) | November 2015 | www.indjst.org
14. Alcan. Handbook of Aluminum.Alcan Aluminum Corporation; 3rd edition 1970. 15. Prime MB. Cross-sectional mapping of residual stresses by measuring the surface contour ater a cut. Journal of Engineering Materials Technology. 2000 Nov; 123(2):162–8. 16. Prime MB, Sebring RJ, Edwards JM, Hughes DJ, Webster PJ. Laser surfacecontouring and spline data-smoothing for residual stress measurement. Experimental Mechanics. 2004 Apr; 44(2):176–84. 17. Dewald AT, Rankin JE, Hill MR, Lee MJ, Chen HL. Assessment of tensile residual stress mitigation in alloy 22 welds due to laser peening. Journal of Engineering Materials Technology. 2004 Nov; 126(4):465–73. 18. Zhang Y, Ganguly S, Edwards L, Fitzpatrick ME. Cross-sectional mapping of residual stresses in a VPPA weld using the contour method. Acta materialia. 2004 Oct; 52(17):5225–32.
Indian Journal of Science and Technology
7