SYNAPSE 41:40 – 48 (2001)
Temporal Profiling of MethamphetamineInduced Changes in Gene Expression in the Mouse Brain: Evidence From cDNA Array JEAN LUD CADET,* SUBRAMANIAM JAYANTHI, MICHAEL T. MCCOY, MARQUIS VAWTER, AND BRUCE LADENHEIM Molecular Neuropsychiatry Section, NIH/NIDA, Intramural Research Program, Baltimore, Maryland
KEY WORDS
cDNA array; neurotoxicity; apoptosis; transcription factors
ABSTRACT Methamphetamine (METH) is a neurodegenerative drug of abuse. Its toxicity is characterized by destruction of monoaminergic terminals and by apoptosis in cortical and striatal cell bodies. Multiple factors appear to control METH neurotoxicity, including free radicals and transcription factors. Here, using cDNA arrays, we show the temporal profile of gene expression patterns in the cortex of mice treated with this drug. We obtained two patterns of changes from 588 genes surveyed. First, an early pattern is characterized by upregulation of transcription factors, including members of the jun family. Second, a delayed pattern includes genes related to cell death and to DNA repair. A number of trophic factors were also activated at the later timepoint. These observations suggest that METH can activate a multigene machinery that participates in the production of its toxic effects. The resulting degenerative effects of the drug are thus the result of a balance between protoxic and antiapoptotic mechanisms triggered by its administration to these animals. These observations are of clinical relevance because of the recent identification of degenerative changes in the brains of METH abusers. Synapse 41:40 – 48, 2001. © 2001 Wiley-Liss, Inc.
INTRODUCTION Methamphetamine (METH) is an amphetamine analog that is widely abused for its psychostimulant effects. However, the drug can also produce neurotoxic effects in the mammalian nervous system. For example, METH causes permanent decrements in neostriatal dopamine (DA) levels and in DA transporters (Cadet et al., 1994; Deng et al., 1999; O’Callaghan and Miller, 1994; Wagner et al., 1979). In addition to the changes in monoaminergic terminals, it has recently been shown that METH can cause degeneration of cell bodies both in vitro (Cadet et al., 1997; Stumm et al., 1999) and in vivo (Deng and Cadet, 2000; Deng et al., 1999; Eisch et al., 1998; Schmued and Boywer, 1997). The cell body loss has been shown to occur via a process that resembles apoptosis (Cadet et al., 1997; Deng et al., 1999; Deng and Cadet, 2000; Stumm et al., 1999). Furthermore, humans who have abused METH also show degenerative damage in their brains (Ernst et al., 2000; McCann et al., 1998; Wilson et al., 1996). Several studies have implicated oxygen-based free radicals in METH-induced neurotoxicity (Cadet et al., 1994; Cubells et al., 1994; Deng and Cadet, 2000; ©
2001 WILEY-LISS, INC.
Fumagalli et al., 1999; LaVoie and Hastings, 1999). These oxygen-based radicals are thought to be secondary to METH-induced changes in DA turnover (see Cadet and Brannock, 1998, for review). In addition, glutamate (Sonsalla et al., 1989) and nitric oxide (Deng and Cadet, 1999; Itzhak et al., 1998; Sheng et al., 1996) might also play a significant role in the long-term effects of the drug. c-Fos might act as a protective factor because c-fos knockout mice show exacerbation responses to the deleterious effects of METH (Deng et al., 1999). Finally, p53 (Hirata and Cadet, 1997) and the bcl-2 family of cell death-related genes (Cadet et al., 1997; Stumm et al., 1999) appear to be involved in the degenerative effects of the drug. The accumulated evidence thus hinted at the possibility of complex mechanisms being involved in METH neurotoxicity. Therefore, an approach that provides a more general view of METH-induced molecular events should help to elucidate the long-term pathobiology *Correspondence to: Jean Lud Cadet, M.D., Molecular Neuropsychiatry Section, NIH/NIDA Intramural Research Program, 5500 Nathan Shock Drive, Baltimore, MD 21224. E-mail:
[email protected] Received 22 November 2000; Accepted 29 December 2000
GENE EXPRESSION IN METH NEUROTOXICITY
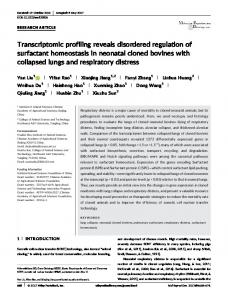
Fig. 1. Cluster analysis of the effects of METH on the mouse brain. A: Dendrogram showing the effects of METH at 2, 4, and 16 h after administration of a single dose (40 mg/kg) of the drug. Each column represents the expression of that specific gene of the indicated time after METH administration. A pseudocolor intensity scale is provided on the left of the dendrogram. Correlation is indicated by the length of the lines, with shorter lines expressing greater correlations. B: Venn
41
diagram of METH-induced upregulation. Genes upregulated by greater than 1.9-fold are shown with some degree of overlap between the three timepoints. Several of the genes that are upregulated at 16 h have been implicated in causing or in preventing apoptosis. C: Venn diagram of METH-induced repression genes. METH caused repression (⬍1.9) of very few genes. Most of the repression occur at the later timepoint.
42
J.L. CADET ET AL. TABLE I. Summary of METH-induced upregulation in gene expression No. of genes above 1.90-fold
Class/function Transcription factor & DNA-binding proteins Oncogenes & tumor suppressors Cell cycle regulators Apoptosis-associated proteins DNA synthesis, repair & recombination proteins Growth factor, cytokine, chemokine & receptors Modulators, effectors & intracellular transducers Cytoskeleton, adhesion & Motility proteins Protein turnover Stress response proteins Ion channels & transport proteins Interleukin, interferon & receptors Neurotransmitter receptors Hormone receptors Total
Percent of the total genes above 1.90-fold
2h
4h
16 h
2h
4h
16 h
50 35 10 8 3 15 3 8 1 5 0 3 7 1
41 17 7 6 3 17 4 6 4 2 0 5 3 1
25 8 6 31 20 39 23 24 17 5 3 9 7 2
33.557 23.490 6.711 5.369 2.013 10.067 2.013 5.369 0.671 3.356 0.000 2.013 4.698 0.671
35.345 14.655 6.034 5.172 2.586 14.655 3.448 5.172 3.448 1.724 0.000 4.310 2.586 0.862
11.416 3.653 2.740 14.155 9.132 17.808 10.502 10.959 7.763 2.283 1.370 4.110 3.196 0.913
149
116
219
100.000
100.000
100.000
associated with the chronic use of the drug. Herein, we examined the temporal characteristics of transcriptional responses to METH administration to mice using the cDNA array approach (DeRisi et al., 1996; DeRisi and Iyer, 1999). We found that METH injections result in potent and delayed activation of genes known to be involved in apoptosis, DNA repair, as a well as in trophic responses. MATERIALS AND METHODS Animals and drug treatment Male CD-1 mice (Charles River, Raleigh, NC), weighing 30 – 45 g, were used. Mice received a single dose of 40.0 mg/kg METH or saline via the intraperitoneal route (Fukumura et al., 1998). All animal use procedures were according to the NIH Guide for the Care and Use of Laboratory Animals and were approved by the local Animal Care Committee. The mice were sacrificed at various timepoints after drug treatment. Brain tissues were processed for use in cDNA array and RT-PCR analyses as described below. cDNA array analysis and reverse transcription (RT)-PCR Gene expression was analyzed using the mouse Atlas cDNA Expression Array (Clontech Laboratories, Palo Alto, CA). Total RNA was isolated using the procedures described in the Atlas pure RNA isolation kit (Clontech Laboratories) from the frontal cortex of saline-treated and of METH-treated mice sacrificed at 2, 4, and 16 h after the single dose of saline or METH. After confirmation of the integrity of total RNA on an agarose gel, mRNA was isolated using the Oligotex mRNA mini kit (Qiagen, Santa Clarita, CA) according to the manufacturer’s instructions. mRNA isolated was reverse-transcribed and labeled with [␣-32P]dATP. Radiolabeled cDNA probes were hybridized to Atlas cDNA Expression Array membrane using ExpressHyb™ Hybridization solution according to the manufacturer’s instructions. After a high-stringency wash the membranes
were exposed to a phosphor screen and scanned using a Storm 840 Phosphoimager (Molecular Dynamics, Sunnyvale, CA). Autoradiographic intensity was analyzed using Array Vision v. 4.0 for Windows NT. The expression level for each gene was quantified after background correction. Data obtained from Array Vision was imported into Gene Spring (Silicon Genetics, CA) for further analyses. Cluster analyses and Venn diagrams were generated using Gene Spring. RT-PCR with gene-specific Custom Atlas Array primers obtained from Clontech Laboratories was also used to confirm changes in the levels of expression of some genes of interest. These were carried out according to the manufacturer’s protocol. RESULTS We compared the cortices of adult mice treated with saline or METH using a Clontech mouse array which contains 588 genes. Figure 1A shows a dendrogram of the results obtained from the cortices of mice treated with METH and sacrificed at 2, 4, 16 h after the administration of the drug. Although there were distinct patterns of mRNA alterations at these three timepoints (Table I, Fig. 1A), there was still some degree of overlap between the two early times since genes within the families of transcription factors and tumor suppressors were more affected (see Table I and below). However, only 10 genes showed persistent increases at all three timepoints (Fig. 1B). These are c-jun, transcription termination factor 1 (TTF1), elk3, Mph-1 nuclear transcriptional repression for hox genes, forkheadrelated transcription factor 1 (FREAC1), c-src, insulinlike growth factor II precursor, nonhistone chromosomal protein HMG-14, interleukin-9 receptor, and A-raf. Early activation of transcription factors after METH administration Table I shows that at 2 h 33.6% of the 149 genes that showed greater than 1.9-fold increases in ex-
43
GENE EXPRESSION IN METH NEUROTOXICITY TABLE II. Methamphetamine-induced increases in gene expression at 2 h Fold
Encoded protein
Function
Transcription factor & DNA-binding proteins 11.67 9.13 4.52 4.15 3.81 3.48 3.38 3.05 2.89 2.78 2.72 2.58 2.57 2.57
activating transcription factor 4 (mATF4) epidermal growth factor receptor kinase substrate EPS8 c-fos junD Ets-related protein PEA 3 AT motif-binding factor (ATBF1) non-histone chromosomal protein HMG-14 lung Kruppel-like factor (LKLF) CCAAT-binding transcription factor (C/EBP) TTF1 junB c-jun Mph-1 forkhead-related transcription factor 1 (FREAC1)
cellular stress response growth and proliferation immediate early/stress response immediate early/cellular stress response chromosomal translocation myb-interacting protein assembling of chromatin fiber cell survival cell cycle & development transcription termination immediate early/stress response immediate early/stress response nuclear transcriptional repressor for hox genes organogenesis
Oncogenes & tumor suppressors 12.15 6.33 6.02 5.02 3.72 3.31 2.72 2.68 2.51 2.15 2.00
Ear-2; v-erbA related vascular endothelial growth factor receptor 1 (VEGFR1, Flt1) SHC-transforming protein L-Myc retinoblastoma-like protein 1 NF-kappa B/c-rel c-Myc N-Myc B-Raf c-Src A-Raf
growth/differentiation oxidative stress response signal transduction blockage of cell differentiation/induction of apoptosis inhibition of cell proliferation inflammatory/immune/stress responses proto-oncogene/apoptosis proto-oncogene/apoptosis/neuroblastoma MEK kinase tyrosine protein kinase cell growth/proliferation
Stress response proteins 2.99 2.24
oxidative stress-induced protein mRNA Osp94 osmotic stress protein; APG-1; hsp70-related
oxidative stress response heat shock factor/stress response
Apoptosis-associated proteins 2.48 2.33 2.03
DAD1 programmed cell death 1 protein precursor (PDCD-1; PD-1) glutathione S-transferase Pi 1
cell death antagonist cell death agonist oxidative stress/free radical scavenger
Growth factors, cytokines & chemokines 2.61 2.22
insulin-like growth factor binding protein 4 precursor (IGFBP4) insulin-like growth factor II precursor
pression levels were transcription factors/DNA binding proteins. In contrast, only 5.4% of apoptosisassociated proteins showed similar increases at that time. Table II shows a partial list of the METH upregulated genes at 2 h. These include c-jun, c-fos, jun B, as well as jun D, all of which are members of the AP-1 transcription factors (Walton et al., 1999). Both c-fos and c-jun have previously been shown to be induced by amphetamines (Hirata et al., 1998). They are also induced by manipulations that can cause hypoxic-ischemia brain damage (Walton et al., 1999). Another transcription factor of interest is ATF4, which was increased by 11.67-fold. AFT4 can form heterodimers with various bZIP proteins such as the AP-1 and C/EBP families of transcription factors (Fawcett et al., 1999; Talukder et al., 2000). Several genes (23.5% of 149) that code for oncogenes or tumor suppressors were also induced at 2 h postdrug treatment (Tables I, II). These include c-Src, A-raf, B-raf, and N-Ras. The coordinated upregulation of these proteins suggest that they might act in concert to affect the long-term effects of METH through the activation of phosphorylation events, including the MAPK
potent inhibitor of IGF protection against cytokine-induced apoptosis
cascades (Bromberg and Darnell, 2000; Hagemann and Rapp, 1999; Kerkhoff and Rapp, 1998). At 4 h after the METH injection, 116 genes showed increases greater than 1.9-fold, with the clustering of genes being somewhat similar to that observed at the 2-h timepoint (Fig. 1A, Table I). Table III provides a short list of the METH-induced genes at 4 h. Several transcription factors that were induced at 2 h remained elevated at 4 h. These include c-jun, Sox 3, and Etsrelated protein PEA 3. A number of oncogenes also remained elevated. These included retinoblastoma-like protein 1 and 2, N-myc, c-myc, SIC, and Fas antigen. All of these play important roles in cell proliferation, differentiation, neurodegeneration, and death (Dagnino et al., 1995; Ferrer and Blanco, 2000; Wagner et al., 1994). Some of these responses also occur secondary to oxidative stress (Kamata and Hirata, 1999). Delayed activation of cell death and immune response genes after METH administration The pattern of changes was quite different at the 16-h timepoint (Fig. 1A, Table I). Of the 588 genes
44
J.L. CADET ET AL. TABLE III. Methamphetamine-induced increases in gene expression at 4 h
Fold
Encoded protein
Function
Transcription factor & DNA-binding proteins 3.62 3.56 3.37 2.67 2.64 2.39 2.32 2.27 2.27
Mph-1 c-jun heat shock transcription factor 2 (HSF 2) fos-B interferon regulatory factor 2 (IRF 2) ets-domain protein elk3 homeobox protein D4 (HOXD4); HOX-4.2; HOX-5.1 homeobox protein 1.1 (Hox-1.1) PAX-8
nuclear transcriptional repressor for hox genes immediate early/stress response differentiation/development immediate early response cytokine signaling oxidative stress response homeobox gene/embryogenesis homeobox gene/craniofacial abnormalities transcription factor
Oncogenes & tumor suppressors 11.17 6.00 5.52 2.92 2.68 2.59 2.53 2.50 2.25
retinoblastoma-like protein 1 NF-kappa B/c-rel retinoblastoma-like protein 2 c-Myc N-Myc retinoblastoma-associated protein 1 c-Src p53 A-Raf
inhibition of cell proliferation inflammatory/immune/stress responses regulation of cell proliferation transcription factor/apoptosis amplified in neuroblastoma/apoptosis regulation of cell proliferation tyrosine protein kinase cell cycle arrest/apoptosis/transcription ras-effector/mitogenic signal
Apoptosis-associated proteins 3.72 3.52 2.70 2.63 2.47
microsomal glutathione S-transferase Fas antigen neuronal death protein 5 (DP5) GADD153 glutathione S-transferase theta 1
oxidative stress/free radical scavenger T and B cell death cell death activator oxidative stress/genotoxic response oxidative stress/free radical scavenger
Growth factors, cytokines & chemokines 4.01 3.07 2.16
insulin-like growth factor II precursor fibroblast growth factor 4 precursor transforming growth factor beta 1
studied, 219 showed increases greater than 1.9-fold. Of these, only 11.4% were assigned to the class of transcription factor/DNA binding proteins and only 3.7% were oncogenes/tumor suppressors, whereas the number for apoptosis-associated proteins increased to 14.2% from 5.2% at 4 h (Table I). Table IV shows a partial list of these upregulated genes. Transcriptional increases occurred for several genes known to be involved in the apoptotic process. These include bid and bak1, which are pro-apoptotic genes of the bcl-2 family of cell death-related genes (Adams and Cory, 1998). In addition, both caspases 2 and 7, reported to participate in apoptosis (Bratton et al., 2000), are also upregulated. Moreover, METH activated fas antigen ligand as well as fas-associated factor, both of which are involved in causing apoptosis (Owen-Schaub et al., 2000). The upregulation of these various families of genes suggests that METH might activate multiple proapoptotic pathways in the brain (Datta et al., 1997). Several genes assigned to proinflammatory responses were also upregulated at 16 h postdrug treatment. These include interleukins and their receptors (Tables I, IV). These have been known to be involved in neurotoxic injury (Dommergues et al., 2000). Signal transducers and activator of transcription (STAT 3 and 6) that are transcription factors which mediate the responses to cytokines and trophic factors (Bromberg and Darnell, 2000) are also upregulated by METH (Table IV). This suggests that these pathways are impor-
protection against cytokine-induced apoptosis early cell development growth and proliferation
tant players in the molecular network responsible for the effects of METH. Other upregulated genes that could participate in the neurodegenerative effects of METH include cathepsins B1, D, and H (Chapman et al., 1998). Cathepsin D has secretase activity and is thought to contribute to the neuropathology of Alzheimer’s disease (Bhojak et al., 2000). In addition to these apoptotic-related genes, there were increases in transcriptional activity for several genes involved in DNA repair (Table IV). These accounted for 9% of genes with increased transcriptional levels at 16 h. These include DNA ligase I and III, DNA (apurinic/apyrimidinic) lyase (AP endonuclease 1, and ataxia telangectasia murine homolog; these are involved DNA repair) (McCullough et al., 1999). Of related interest are the observed increases in many trophic or growth factors that are known to exert protective effects against toxic injuries or cell death (Clark and Coker, 1998; Glazner and Mattson, 2000; Kiefer et al., 1995; Flanders et al., 1998; Torres-Aleman, 1996; Romaskova and Makarov, 1999). For example, platelet-derived growth factor (Romashkova and Makarov, 1999) and transforming growth factor beta (Krieglstein et al., 1995) have been shown to be cytoprotective in some models. The prolonged activation of insulin-like growth factor II precursor suggests that this factor might be involved intimately in the protective responses against METH neurotoxicity. This is consistent with previous demonstrations with adult rats that
45
GENE EXPRESSION IN METH NEUROTOXICITY TABLE IV. Methamphetamine-induced increases in gene expression at 16 h Fold
Encoded protein
Function
Transcription factor & DNA-binding proteins 8.02 5.82 4.19 3.39 3.31
c-jun KROX-24 (EGR-1) TTF1 Mph-1 c-fos
immediate early/stress response early growth response transcription termination nuclear transcriptional repressor for hox genes immediate early response
Oncogenes & tumor suppressors 4.29 2.95
c-Src A-Raf
proto-oncogene/tyrosine kinase mitogenic signal
Modulators, effectors & intracellular transducers 4.34 3.01 2.67
Janus kinase 3 (Jak3) Stat3 JNK3
IL-4 and IL-7 signaling IL-6, EGF, FGF, and SRC signaling stress response signal transducer
Apoptosis-associated proteins 4.56 4.31 3.59 3.48 3.43 3.12 2.88 2.55 2.12
BAX membrane isoform alpha glutathione S-transferase Pi 1 caspase-7 FLIP-L rac alpha (C-akt) GADD45 BID Caspase 2 GADD153
pro-cell death signal oxidative stress/free radical scavenger cell death effector endogenous modulators of apoptosis promotes cell survival oxidative stress/genotoxic response cell death agonist cell death initiator oxidative stress/genotoxic response
DNA synthesis, repair & recombination proteins 7.14 4.67 3.53
Atm; ataxia telangiectasia murine homolog DNA ligase I DNA ligase III
double strand break repair excision repair protein single strand break repair
Interleukins & interleukin receptors 7.81 5.27 4.58 2.42
interleukin 4 interleukin-6 receptor alpha subunit precursor interleukin-5 receptor alpha subunit precursor interleukin-9 receptor
immune response cell growth and survival granulocyte macrophage-stimulating factor immune response
Growth factors, cytokines & chemokines 4.20 3.47 3.24
transforming growth factor beta 1 insulin-like growth factor II precursor platelet-derived growth factor (A chain)
growth and proliferation protection against cytokine-induced apoptosis modulation of connective tissue synthesis
cathepsin D cathepsin H granzyme B precursor
aspartyl protease/secretase/Alzheimer’s disease lysosomal thiol protease cytotoxic serine protease
Protein turnover 5.08 4.16 2.27
have suffered ischemic brain injury (Beilharz et al., 1998).
part, the changes are quite similar using the two techniques.
Delayed suppression of transcription factors by METH administration
DISCUSSION
A few genes were also downregulated (Table V) with the greatest number of downregulated genes occurring at 16 h postdrug treatment. This occurred among the classes of transcription factors and tumor suppressors which amounted to 54.8% of the downregulated genes at that time. The most substantially downregulated transcription factors were Sap 1A, U2 small nuclear ribonucleoprotein (U2AF1-RS-1), and transcription factor UBF. RT-PCR We used RT-PCR to confirm some of the changes observed in the array. Figure 2 shows that, for the most
The present data are the first to provide an extensive temporal profile of the effects of METH on gene expression in the mouse brain. Our observations suggest that METH administration can have profound effects on the molecular machinery of the brain. Specifically, we were able to detect increases in the transcriptional activity of several genes involved in cell death. These include genes that code for apoptosis-associated proteins, lysosomal proteases, as well as for markers of genotoxic/ oxidative damage and of inflammatory responses. Some of these processes have been implicated in neurodegenerative disorders (Mattson et al., 2000; Pratt and McPherson, 1997). Thus, this suggests that METH might trigger molecular and cellular mechanisms sim-
46
J.L. CADET ET AL. TABLE V. Summary of METH-induced downregulation in gene expression Percent of the total genes below 2-fold
No. of genes below 2-fold Class/function Transcription factor & DNA-binding proteins Oncogenes & tumor suppressors Cell cycle regulators Apoptosis-associated proteins DNA synthesis, repair & recombination proteins Growth factor, cytokine, chemokine & receptors Modulators, effectors & intracellular transducers Cytoskeleton, adhesion & motility proteins Protein turnover Stress response proteins Ion channels & transport proteins Cell surface antigens & adhesion proteins Interleukin, interferon & receptors Neurotransmitter receptors Hormone receptors Total
2h
4h
16 h
2h
4h
16 h
1 3 0 9 1 2 8 1 1 0 0 1 2 1 0
0 2 0 3 6 3 6 0 5 1 0 1 1 0 0
13 21 4 3 5 4 8 0 1 0 0 1 1 0 1
3.333 10.000 0.000 30.000 3.333 6.667 26.667 3.333 3.333 0.000 0.000 3.333 6.667 3.333 0.000
0.000 7.143 0.000 10.714 21.429 10.714 21.429 0.000 17.857 3.571 0.000 3.571 3.571 0.000 0.000
20.968 33.871 6.452 4.839 8.065 6.452 12.903 0.000 1.613 0.000 0.000 1.613 1.613 0.000 1.613
30
28
62
100.000
100.000
100.000
Fig. 2. RT-PCR confirmation of METH-induced changes in some genes of interest. For the most parts, changes were similar. Data for the cDNA array were obtained from duplicate observations while those from the PCR were from triplicate determinations.
ilar to those involved in the aging process (Lee et al., 2000). Our data are also consistent with recent observations of the complex nature of the response to genotoxic injury (Amundson et al., 1999). It is to be noted that these protoxic cascades appear to be counterbalanced by trophic factors and antioxidant enzymes that are also activated after METH administration. This includes the activation of insulin growth factor (IGF) and IGF binding proteins, epidermal growth, NF kappa B, and AKT, all of which have been shown to exert significant antideath activities (Chen et al., 2000). It is thus not farfetched to suggest that these factors may play an essential role in
the regenerative processes that occur after the administration of toxic doses of METH (Harvey et al., 2000), as well as the protective effects of GDNF against METH-induced toxicity (Melega et al., 2000). These observations are of clinical relevance because of the recent demonstration of neuropathological changes in the brains of patients who abuse METH (Ernst et al., 2000; McCann et al., 1998; Wilson et al., 1996). In conclusion, the present data provide further documentation for the complex nature of the molecular effects of METH on the brain. Our observations of increases in the expression levels of cell death and DNA repair genes indicate that METH may exert significant genotoxic damage. This idea is consistent with previous demonstrations that METH can cause apoptosis both in vitro (Cadet et al., 1997; Stumm et al., 1999) and in vivo (Deng et al., 1999; Deng and Cadet, 2000). Our observations provide further evidence that oxidative stress (Cadet and Brannock, 1998) may be an important culprit in the manifestations of the deleterious effects of METH since several free radical-regulated genes were activated by the drug. Future studies will need to dissect the role played by cross-talks among various molecular pathways in the subacute and long-term effects of this illicit agent. Our observations also indicate that multiple signaling pathways are induced concomitantly in response to METH administration, thus confirming the existence of complex regulation of the addictive and neurotoxic potentials of this drug. REFERENCES Adams JM, Cory S. 1998. The Bcl-2 protein family: arbiters of cell survival. Science 281:1322–1326. Amundson SA, Bittner M, Chen Y, Trent J, Meltzer P, Fornace AJ Jr. 1999. Fluorescent cDNA microarray hybridization reveals complexity and heterogeneity of cellular genotoxic stress responses. Oncogene 18:3666 –3672. Beilharz EJ, Russo VC, Butler G, Baker NL, Connor B, Sirimanne ES, Dragunow M, Werther GA, Gluckman PD, Williams CE, Scheepens
GENE EXPRESSION IN METH NEUROTOXICITY A. 1998. Co-ordinated and cellular specific induction of the components of the IGF/IGFBP axis in the rat brain following hypoxicischemic injury. Brain Res Mol Brain Res 59:119 –134. Bhojak TJ, DeKosky ST, Ganguli M, Kamboh MI. 2000. Genetic polymorphisms in the cathepsin D and interluekin-6 genes and the risk of Alzheimer’s disease. Neurosci Lett 288:21–24. Bratton SB, MacFarlane M, Cain K, Cohen GM. 2000. Protein complexes activate distinct caspase cascades in death receptor and stress-induced apoptosis. Exp Cell Res 256:27–33. Bromberg J, Darnell JE Jr. 2000. The role of STATs in transcriptional control and their impact on cellular function. Oncogene 19:2468 – 2473. Cadet JL, Brannock C. 1998. Free radicals and the pathobiology of brain dopamine systems. Neurochem Int 32:117–131. Cadet JL, Sheng P, Ali S, Rothman R, Carlson E, Epstein C. 1994. Attenuation of methamphetamine-induced neurotoxicity in copper/ zinc superoxide dismutase transgenic mice. J Neurochem 62:380 – 383. Cadet JL, Ordonez SV, Ordonez JV. 1997. Methamphetamine induces apoptosis in immortalized neural cells: protection by the protooncogene, bcl-2. Synapse 25:176 –184. Chapman HA, Munger JS, Shi GP. 1998. The role of thiol proteases in tissue injury and remodeling. Am J Respir Crit Care Med 150: S155–159. Chen C, Edelstein LC, Gelinas C. 2000. The rel/NF-kappaB family directly activates expression of the apoptosis inhibitor Bcl-x(L). Mol Cell Biol 20:2687–2695. Clark DA, Coker R. 1998. Transforming growth factor-beta (TGFbeta). Int J Biochem Cell Biol 30:293–298. Cubells JF, Rayport S, Rajndron G, Sulzer D. 1994. Methamphetamine neurotoxicity involves vacuolation of endocytic organelles and dopamine-dependent intracellular oxidative stress. J Neurosci 14:2260 –2271. Dagnino J, Zhu L, Skorecki KL, Moses HL. 1995. E2F-independent transcriptional repression by p107, a member of the retinoblastoma family of proteins. Cell Growth Differ 6:191–198. Datta SR, Dudek H, Tao X, Masters S, Fu H, Gotoh Y, Greenberg ME. 1997. Akt phosphorylation of BAD couples survival signals to the cell-intrinsic death machinery. Cell 91:231–241. Deng X, Cadet JL. 1999. Methamphetamine administration causes overexpression of nNOS in the mouse striatum. Brain Res 851:254 – 257. Deng X, Cadet JL. 2000. Methamphetamine-induced apoptosis is attenuated in the striata of copper-zinc superoxide dismutase transgenic mice. Mol Brain Res 83:121–124. Deng X, Ladenheim B, Tsao LI, Cadet JL. 1999. Null mutation of c-fos causes exacerbation of methamphetamine-induced neurotoxicity. J Neurosci 19:10107–10115. DeRisi JL, Iyer VR. 1999. Genomics and array technology. Curr Opin Oncol 11:76 –79. DeRisi JL, Penland L, Brown PO, Bittner ML, Meltzer PS, Ray M, Chen Y, Su YA, Trent JM. 1996. Use of a cDNA microarray to analyse gene expression patterns in human cancer. Nat Genet 14:457– 460. Dommergues MA, Patkai J, Renauld JC, Evrard P, Gressens P. 2000. Proinflammatory cytokines and interleukin-9 exacerbate excitotic lesions of the newborn murine neopallium. Ann Neurol 47:54 – 63. Eisch AJ, Schmued LC, Marshall JF. 1998. Characterizing cortical neuron injury with Fluoro-Jade labeling after a neurotoxic regimen of methamphetamine. Synapse 30:329 –333. Ernst T, Chang L, Leonido-Yee M, Speck O. 2000. Evidence for longterm neurotoxicity associated with methamphetamine abuse: a 1H MRS study. Neurology 54:1344 –1349. Fawcett TW, Martindale JL, Guyton KZ, Hat T, Holbrook NJ. 1999. Complexes containing activating transcription factor (ATF)/cAMPresponsive-element-binding protein (CREB) interact with the CCAAT/enhancer-binding protein (C/EBP)-ATF composite site to regulate Gadd153 expression during the stress response. Biochem J 339:134 –141. Ferrer I, Blanco R. 2000. N-myc and c-myc expression in Alzheimer disease, Huntington disease and Parkinson disease. Brain Res Mol Brain Res 77:270 –276. Flanders KC, Ren RF, Lippa CF. 1998. Transforming growth factorbetas in neurodegenerative diseases. Prog Neurobiol 54:71– 85. Fukumura M, Cappon GD, Pu C, Broening HW, Vorhees CV. 1998. A single dose model of methamphetamine-induced neurotoxicity in rats: effects on neostriatal monoamines and glial fibrillary acidic protein. Brain Res 806:1–7. Fumagalli F, Gainetdinov RR, Wang YM, Valenzano KJ, Miller GW, Caron MG. 1999. Increased methamphetamine neurotoxicity in
47
heterozygous vesicular monoamine transporter 2 knock-out mice. J Neurosci 19:2424 –2431. Glazner GW, Mattson MP. 2000. Differential effects of BDNF, ADNF9, and TNFalpha on levels of NMDA receptor subunits, calcium homeostasis, and neuronal vulnerability to excitotoxicity. Exp Neurol 16:442– 452. Hagemann C, Rapp UR. 1999. Isotype-specific functions of Raf kinases. Exp Cell Res 253:34 – 46. Harvey DC, Lacan G, Tanious SP, Melega WP. 2000. Recovery from methamphetamine induced long-term nigrostriatal dopaminergic deficits without substantia nigra cell loss. Brain Res 871:259 – 270. Hirata H, Cadet JL. 1997. p53-knockout mice are protected against the long-term effects of methamphetamine on dopaminergic terminals and cell bodies. J Neurochem 69:780 –790. Hirata H, Asanuma M, Cadet JL. 1998. Superoxide radicals are mediators of the effects of methamphetamine on Zif268 (Egr-1A) in the brain: evidence from using CuZn superoxide dismutase transgenic mice. Brain Res Mol Brain Res 58:209 –216. Itzhak Y, Gandia C, Huang PL, Ali SF. 1998. Resistance of neuronal nitric oxide synthase-deficient mice to methamphetamineinduced dopaminergic neurotoxicity. J Pharmacol Exp Ther 284: 1040 –1047. Kamata H, Hirata H. 1999. Redox regulation of cellular signalling. Cell Signal 11:1–14. Kerkhoff E, Rapp UR. 1998. Cell cycle targets of Ras/Raf signaling. Oncogene 17:1457–1462. Kiefer R, Streit WJ, Toyka KV, Kreutzberg GW, Hartung HP. 1995. Transforming growth factor-beta 1: a lesion-associated cytokine of the nervous system. Int J Dev Neurosci 13:331–339. Krieglstein K, Suter-Crazzolara C, Unsicker K. 1995. Development of mesencephalic dopaminergic neurons and the transforming growth factor-beta superfamily. J Neural Trans (Suppl) 46:209 –216. LaVoie MJ, Hastings TG. 1999. Dopamine quinone formation and protein modification associated with the striatal neurotoxicity of methamphetamine: evidence against a role for extracellular dopamine. J Neurosci 19:1484 –1491. Lee CK, Weindruch R, Prolla TA. 2000. Gene-expression profile of the aging brain in mice. Nat Genet 25:294 –297. Mattson MP, Culmsee C, Yu ZF. 2000. Apoptotic and antiapoptotic mechanisms in stroke. Cell Tissue Res 301:173–187. McCann UD, Wong DF, Yokoi F, Villemagne V, Dannals RF, Ricaurte GA. 1998. Reduced striatal dopamine transporter density in abstinent methamphetamine and methcathinone users: evidence from positron emission tomography studies with [11C]WIN-35,428. J Neurosci 18:8417– 8422. McCullough AK, Dodson ML, Lloyd RS. 1999. Initiation of base excision repair: glycosylase mechanisms and structures. Annu Rev Biochem 68:255–285. Melega WP, Lacan G, Desalles AA, Phelps ME. 2000. Long-term methamphetamine-induced decreases of [(11)C]WIN 35, 428 binding in striatum are reduced by GDNF: PET studies in the vervet monkey. Synapse 35:243–249. O’Callaghan JP, Miller D. 1994. Neurotoxicity profiles of substituted amphetamines in the C57BL/6J mouse. J Pharmacol Exp Ther 270:741–751. Owen-Schaub L, Chan H, Cusak JC, Roth J, Hill LL. 2000. Fas and Fas ligand interactions in malignant disease. Int J Oncol 17:5– 12. Pratt BM, McPherson JM. 1997. TGF-beta in the central nervous system: potential roles in ischemic injury and neurodegenerative diseases. Cytokine Growth Factor Rev 8:267–292. Romashkova JA, Makarov SS. 1999. NF-kappaB is a target of AKT in anti-apoptotic PDGF signaling. Nature 401:86 –90. Schmued LC, Bowyer JF. 1997. Methamphetamine exposure can produce neuronal degeneration in mouse hippocampal remnants. Brain Res 759:135–140. Sheng P, Cerruti C, Ali S, Cadet JL. 1996. Nitric oxide is a mediator of methamphetamine (METH)-induced neurotoxicity. In vitro evidence from primary cultures of mesencephalic cells. Ann NY Acad Sci 801:174 –186. Sonsalla PK, Nicklas WJ, Heikkila RE. 1989. Role for excitatory amino acids in methamphetamine-induced dopaminergic toxicity. Science 243:398 – 400. Stumm G, Schlegel J, Schafer T, Wurz C, Mennel HD, Krieg JC, Vedder H. 1999. Amphetamines induce apoptosis and regulation of bcl-x splice variants in neocortical neurons. FASEB J 13:1065– 1072. Talukder AH, Vadlamudi R, Mandal M, Kumar R. 2000. Heregulin induces expression DNA binding activity, and transactivating func-
48
J.L. CADET ET AL.
tions of basic leucine zipper activating transcription factor 4. Cancer Res 60:276 –281. Torres-Aleman I. 1999. Insulin-like growth factors as mediators of functional plasticity in the adult brain. Horm Metab Res 31:114 – 119. Wagner GC, Seiden LS, Schuster CR. 1979. Methamphetamine-induced changes in brain catecholamines in rats and guinea pigs. Drug Alcohol Depend 4:435– 438. Wagner AJ, Kokontis JM, Hay N. 1994. Myc-mediated apoptosis requires wild-type p53 in a manner independent of cell cycle arrest
and the ability of p53 to induce p21 waf1/cip1. Genes Dev 8:2817– 2830. Walton M, Connor B, Lawlor P, Young D, Sirimanne E, Gluckman P, Cole G, Dragunow M. 1999. Neuronal death and survival in two models of hypoxic-ischemic brain damage. Brain Res Brain Res Rev 29:137–168. Wilson JM, Kalasinsky KS, Levey AI, Bergeron C, Reiber G, Anthony RM, Schmunk GA, Shannak K, Haycock JW, Kish SJ. 1996. Striatal dopamine nerve terminal markers in human, chronic methamphetamine users. Nat Med 2:699 –703.