TermitAnt: An Ant Clustering Algorithm Improved by Ideas from Termite Colonies Vahid Sherafat1, Leandro Nunes de Castro2, and Eduardo R. Hruschka2 1 State
University of Campinas (Unicamp)
[email protected] 2 Catholic University of Santos (UniSantos) {lnunes,erh}@unisantos.br Abstract. This paper proposes a heuristic to improve the convergence speed of the standard ant clustering algorithm. The heuristic is based on the behavior of termites that, when building their nests, add some pheromone to the objects they carry. In this context, pheromone allows artificial ants to get more information, at the local level, about the work in progress at the global level. A sensitivity analysis of the algorithm is performed in relation to the proposed modification on a benchmark problem, leading to interesting results.
1 Introduction Several species of animals and insects benefit from sociality in various ways, usually resulting in greater survival advantages. Social behaviors have also inspired the development of several computational tools for problem-solving, which compose the field known as swarm intelligence [1,5], such as ant colony optimization algorithms [4], collective robotics [6], ant clustering algorithms [7], and others. This paper explores an approach from the swarm intelligence field, inspired by the clustering of dead bodies and nest cleaning in ant colonies. In particular, we improve the standard ant clustering algorithm introduced by Lumer and Faieta [7]. Motivated by the observation that termites add pheromone to soil pellets when building a nest [2] (this serves as a sort of reinforcement signal to other termites placing more pellets on the same portion of the space), we added a pheromone heuristic function to the standard ant clustering algorithm [7], here for brevity called SACA, in order to improve the convergence speed of the algorithm. A sensitivity analysis is performed to study the influence of the pheromone heuristics in the standard algorithm.
2 Termite Nest Building: A Useful Behavior During the construction of a nest, each termite places somewhere a soil pellet with a little of oral secretion containing attractive pheromone. This pheromone helps to coordinate the building process during its initial stages. Random fluctuations and heterogeneities may arise and become amplified by positive feedback, giving rise to the final structure (mound). Each time one soil pellet is placed in a certain part of the space, more likely another soil pellet will be placed there, because all the previous pellets contribute with some pheromone and, thus, attract other termites. There are, however, some negative feedback processes to control this snowballing effect, for instance, the depletion of soil pellets or a limited number of termites available on the N.R. Pal et al. (Eds.): ICONIP 2004, LNCS 3316, pp. 1088–1093, 2004. © Springer-Verlag Berlin Heidelberg 2004
TermitAnt: An Ant Clustering Algorithm Improved by Ideas from Termite Colonies
1089
vicinity. It is also important to note that the pheromone seems to loose its biological activity or evaporate within a few minutes of deposition [2]. This behavior is interesting from a clustering perspective, because it allows the environment to provide some reinforcement signals to the clustering agents based on the density of objects on that region of the space. This means that regions of the space with greater density of data promote a greater attraction to the deposition of more data. Combined with an appropriate tuning of the standard ant clustering algorithm, this proposal can result in faster convergence than SACA.
3 TermitAnt: A Modified Ant Clustering Algorithm 3.1 The Standard Ant Clustering Algorithm (SACA) Lumer and Faieta [7] introduced a method for organizing datasets into clusters based on the model of Deneubourg et al. [3], in which ant-like agents move at random on a 2D grid where objects are scattered at random. Each ant-like agent can either pick up an object from the grid or drop it on the grid. The probability of picking up an object decreases with both the density of other objects and the similarity with other objects within a given neighborhood. By contrast, the probability of dropping an object increases with the similarity and the density of objects within a local region. This led to the algorithm here referred to as SACA (Standard Ant Clustering Algorithm). Independently of the dimension of the input data, each datum is randomly projected onto one of the cells on the grid. Thus, a cell or patch is responsible for hosting the index of one input pattern, and this indicates the relative position of the datum in the grid. The general idea is to have items, which are similar in their original Ndimensional space, in neighboring regions of the grid. Therefore, the indexes of neighbor data on the grid must indicate similar patterns in their original space. In SACA, each site or cell on the grid can be occupied by at most one object. At each step of the algorithm, an ant is selected at random and can either pick up or drop an object at its current location, according to probabilistic rules. Assume that d(i,j) is the Euclidean distance between objects i and j in their N-dimensional space. The density dependent function for object i, is defined by the following expression: 1 ∑ (1 − d (i, j ) / α) if f (i ) > 0 , f (i ) = s 2 j 0 otherwise.
(1)
where s2 is the number of sites in the surrounding area of i, and α is a constant that scales the dissimilarities between objects. The maximum value for f(i) is obtained if, and only if, all sites in the neighborhood are occupied by equal objects. For the density function given by Eq.(1), the probability of picking up and dropping an object i is given by Eqs. (2) and (3) respectively. The parameters kp and kd are threshold constants equal to 0.1 and 0.15 respectively, and f(i) ∈ [0,1]. kp Ppick (i ) = k + f (i ) p
2
2 f (i ) if f (i ) < k d ; Pdrop (i ) = 1 otherwise.
(2) (3)
1090
Vahid Sherafat, Leandro Nunes de Castro, and Eduardo R. Hruschka
3.2 TermitAnt: Adding Pheromone to SACA One important drawback of SACA relates to the lack of mechanisms by which artificial ants could get more information, at the local level, about the work in progress at the global level. A simple way to achieve such information is to create a local variable φ(i) associated with each bi-dimensional position i on the grid such that the quantity of pheromone in that exact position can be determined. Inspired by the way termites use pheromone to build their nests, the artificial agents in the modified ant clustering algorithm will add some pheromone to the objects they carry. In a more abstract sense, one can consider that the pheromone is indirectly deposited in the position in which each object is laid. During each cycle, the artificial pheromone φ(i) evaporates at a fixed rate and it is thus diffused on the environment. More specifically, in order to accommodate the addition of pheromone to the objects, we propose some variations on the picking and dropping probability functions of SACA, which are now given by: 2
kp . Ppick (i ) = (1 − Phe(min, max, P, φ (i ))) × k p + f (i ) f (i ) Pdrop (i ) = (1 + Phe(min, max, P, φ (i ))) × k d + f (i )
Phe(min, max, P, φ (i )) =
where,
2
.
2.P 2.P. max φ (i) − + P, max− min max− min
(4) (5) (6)
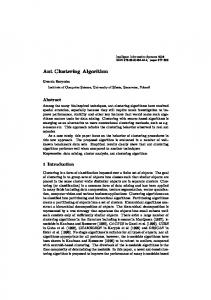
• max: current largest amount of pheromone perceived by agent i; • min: current smallest amount of pheromone perceived by agent i; • P: the maximum influence of the pheromone in changing the probability of picking and dropping data elements; • φ(i): the quantity of pheromone in the current position i. In Eq.(6), the function Phe(⋅), which is depicted in Fig. 1, gives a value in the range [–P, P], and represents the local relative amount of pheromone perceived by each artificial ant. The more pheromone in a certain position (a value closer to P), the greater the value of function Phe(⋅), which results in a decrement of the probability of picking up elements or in an increment of the probability of dropping an element. The probabilities Ppick and Pdrop are always bounded to the interval [0,1]. The rate by which the pheromone evaporates is a preset parameter as in Eq. (7). Therefore, a region with a high quantity of pheromone is probably both a large cluster and a cluster under construction. Each artificial ant has a memory of the maximum and minimum values of pheromone, φ(i), perceived on the grid, but it also forgets this value with a fixed rate as described by Equations (8) and (9): (7) φ (i) ← φ (i) × 0.99 . (8) max ← max × 0.99 min ← min × 1.01 (9) Ramos et al. [9] also proposed a pheromone-based approach aimed to reduce random explorations of the grid. In short, their approach is based on the fact that ants also communicate by means of pheromone, i.e., when they leave their nests to search for food, they lay a trail of pheromone on their path. Thus, the number of ants that has
TermitAnt: An Ant Clustering Algorithm Improved by Ideas from Termite Colonies
1091
traveled on the path determines the strength of the pheromone trail, and the ants that travel the shortest path reinforce this path with more amount of pheromone, helping others to follow them. In essence, our TermitAnt algorithm allows ants to focus more on the clusters being formed (ants perceive the grid positions in which objects were manipulated by other ants) instead of on the paths by which they travel on the grid. Phe P
min max
φ
−P
Fig. 1. Function Phe(max,min,P,φi).
4 The Influence of Pheromone on SACA To assess the sensitivity of the algorithm to the proposed variation, we performed an experiment with a modified version of the well-known four classes data set proposed by Lumer and Faieta [7] to study SACA, which corresponds to four distributions of 25 data points each, defined by Gaussian probability density functions with various means µ and fixed standard deviation σ = 1.5, G(µ,σ), as follows: A = [x ∝ G(0,1.5), y ∝ G(0,1.5)]; B = [x ∝ G(0,1.5), y ∝ G(8,1.5)]; C = [x ∝ G(8,1.5), y ∝ G(0,1.5)]; D = [x ∝ G(8,1.5), y ∝ G(8,1.5)]. In the experiments to be described here, the adopted performance measure was the convergence rate of the algorithm (how many cycles it takes to converge) and the classification error. In the present context, the algorithm is said to have converged after it was capable of correctly identifying the four clusters available in the data set. This is possible because the input data was intentionally generated so as to present four well separated clusters. A cycle here corresponds to 10,000 steps of an ant. The algorithm was implemented using StarLogo® [8]. The grid has a dimension of 25×25 and 10 ants are allowed to explore it. To evaluate the sensitivity of the algorithm in relation to the proposed pheromone function, the parameters kp and kd were kept fixed at 0.20 and 0.05, respectively, based on previous experimentation. Fig. 2 presents the average percentage classification error, E(%), and the number of cycles for convergence, C, as a function of P. The parameter P was varied from 0 to 1.3 in 0.1 steps. Thus, the algorithm was analyzed from a case where there is no pheromone at all to a case in which a very high amount of pheromone is added. Note that for P > 1.0 the influence of pheromone is greater than the influence of the similarity among data, and thus becomes detrimental, because the algorithm tends to result in incorrect groupings.
1092
Vahid Sherafat, Leandro Nunes de Castro, and Eduardo R. Hruschka
Fig. 3 presents the average pheromone of the patches that contain no item (dotted line), the average pheromone of the patches that contain an item (solid line), and the average pheromone on the grid (dashed line). The plot uses a log scale on the y-axis. Note that the average pheromone on the empty cells stabilizes with a value around 1, a value around 2.5 on the whole grid, and a value around 13 on the occupied cells. The scale on the x-axis corresponds to the simulation time in seconds. The algorithm is stopped after it finds all clusters. Influence of Pheromone on E(%)
8
Influence of Pheromone on C
16
7
14
6
12
5
E(%) 4
C10
3 8
2
6 4
1 0 0
0.5
P
1.0
1.5
0
0.5
(a)
1.0
P
1.5
(b)
Fig. 2. The influence of the parameter P on the convergence and error rates of SACA. The parameter P was varied from 0 to 1.3 in 0.1 steps (P = 0:0.1:1.3). The values presented are the average over 12 runs ± the standard deviation. (a) Sensitivity of the algorithm in terms of number of cycles for convergence. (b) Sensitivity of the algorithm in terms of percentage error rate. Pherom one Evolution
10 1
φ
10 0
0
10
20
30 T (sec.)
40
50
60
Fig. 3. Evolution of pheromone (φ) on the grid along the adaptation. Bottom curve (dotted line): average pheromone on the patches without any item; Middle curve (dashed line): average pheromone on the grid; Top curve (solid line): average pheromone on the patches with an item.
5 Conclusions In relation to the sensitivity analysis of the algorithm, it could be observed that the addition of pheromone provides the ants with some form of global information about the current configuration of the grid, and this may lead to faster convergence rates and a more appropriate separation of the clusters contained in the input dataset. It was also
TermitAnt: An Ant Clustering Algorithm Improved by Ideas from Termite Colonies
1093
interesting to observe that, to some extent, the use of pheromone works like a progressive vision, because as it diffuses to the environment, ants reasonably far from a cluster can be attracted to (‘see’) it in a stigmergic fashion. As in natural ants, smelling is a very important sense that provides general information about the environment. Although the sensitivity analysis presented here and the proposed modification of the standard algorithm are relevant for aiding in the practical application of the algorithm, much research still has to be performed to validate the potential of this technique, including the proposed modification. Thus, we are starting to investigate the application of the modified algorithm to benchmark and real-world problems.
Acknowledgments The authors acknowledge both CNPq and FAPESP for their financial support.
References 1. Bonabeau, E., Dorigo, M. and Théraulaz, G., Swarm Intelligence from Natural to Artificial Systems, Oxford University Press (1999). 2. Camazine, S., Deneubourg, J.-L., Franks, N. R., Sneyd, J., Theraulaz, G. and Bonabeau, E., Self-Organization in Biological Systems, Princeton University Press (2001). 3. Deneubourg, J. -L., Goss, S., Franks, N., Sendova-Franks, A., Detrain, C. and Chrétien, L., “The Dynamics of Collective Sorting: Robot-Like Ant and Ant-Like Robot”, In J. A. Meyer and S. W. Wilson (eds.) Simulation of Adaptive Behavior: From Animals to Animats, pp. 356-365, Cambridge, MA, MIT Press/Bradford Books (1991). 4. Dorigo, M., Optimization, Learning and Natural Algorithms, (in Italian), Ph.D. Thesis, Dipartimento di Elettronica, Politecnico di Milano, IT (1992). 5. Kennedy, J., Eberhart, R. and Shi. Y., Swarm Intelligence, Morgan Kaufmann Publishers (2001). 6. Kube, C. R., Parker, C. A. C., Wang, T., Zhang, H., “Biologically Inspired Collective Robotics”, In L. N. de Castro & F. J. Von Zuben, Recent Developments in Biologically Inspired Computing, Idea Group Inc., Chapter 15 (2004). 7. Lumer, E. D. and Faieta, B., “Diversity and Adaptation in Populations of Clustering Ants”, In D. Cliff, P. Husbands, J. A. Meyer, S.W. Wilson (eds.), Proc. of the 3rd Int. Conf. on the Simulation of Adaptive Behavior: From Animals to Animats, 3, MIT Press, pp. 499-508 (1994). 8. Resnick, M., Turtles, Termites, and Traffic Jams: Explorations in Massively Parallel Microworlds, Cambridge, MA: MIT Press (1994). 9. Ramos, V., Muge, F., Pina, P. Self-Organized Data and Image Retrieval as a Consequence of Inter-Dynamic Synergistic Relationships in Artificial Ant Colonies. In J. Ruiz-del-Solar, A. Abrahan and M. Köppen Eds., Soft-Computing Systems - Design, Management and Applications, Frontiers in Artificial Intelligence and Applications: IOS Press, v. 87, 500-509, Amsterdam (2002).