Journal of Object Technology Published by ETH Zurich, Chair of Software Engineering, © JOT 2010 Online at http://www.jot.fm.
Test Case Generation Based on State and Activity Models Santosh Kumar Swaina
Durga Prasad Mohapatrab
Rajib Mallc
a. School of Computer Engineering, KIIT University, Bhubaneswar, Orissa, India.
[email protected]. b. Department of Computer Science & Engg., National Institute of Technology, Rourkela, Orissa, India.
[email protected]. c. Department of Computer Science & Engg., Indian Institute of Technology, Kharagpur, West Bengal, India.
[email protected].
Abstract We propose a novel testing technique for object-oriented programs. Based on the state and activity models of a system, we construct an intermediate representation, which we have named state-activity diagram (SAD). We generate test cases to achieve state-activity coverage of SADs. We have empirically evaluated the effectiveness of our approach. The results show that the proposed technique could detect seeded integration testing faults which could not be detected by the related approaches. Keywords UML based testing, Automatic test case generation, Activity diagram, State chart diagram, Mutation testing
1 INTRODUCTION Effective software testing is a very challenging task. The reliability and quality of a software product depends largely on how thoroughly it is tested [19]. As the complexity and size of software products grow with every passing year, the time and effort required for adequate testing is growing at a very rapid rate. Test case design constitutes a large part of testing cost. It is generally agreed that manual testing is becoming a bottleneck and is a frequent cause of project delays especially for large programs [18]. Therefore, automatic test case design has become important to ensure the quality of present day large software products and to contain the rapidly growing testing costs [21, 13, 19, 9]. Automatic test case generation from code is inefficient, especially for large programs [23]. Some aspects of program behavior e.g. state behavior are very difficult to test based on code alone [20, 24]. An alternative approach is to generate test cases from UML models constructed during the design process. Use of UML models to generate test cases holds out several advantages. Test case generation from design
Santosh Kumar Swain, Durga Prasad Mohapatra, Rajib Mall. Test Case Generation Based on State and Activity Models. In Journal of Object Technology, vol. 9, no. 5, 2010, pages 1–27. Available at http://www.jot.fm/contents/issue_2010_09/article1.html
2 · S. K. Swain et al.
models has several advantages. Model-based (also called gray box) testing can detect certain categories of faults that are not easily detected by code-based testing. Also it allows test cases to be available early in the software development cycle, thereby making test planning more effective and saving time and resources. UML has emerged as an industrial standard for modeling software systems [6]. UML is a visual modeling language that can be used to specify, visualize, construct, and document the artifacts of a software system [6]. UML can be used to describe different aspects of a system including static, dynamic and use case views of a system. Of late, test case generation from UML statechart diagrams [8, 10, 14, 9, 22, 7, 28] and activity diagrams [3, 16, 5, 25] has received considerable attention from researchers. Existing methods [22, 7] of generating test cases from statechart diagrams only deal with testing a single object and can be used to easily achieve transition and state coverage for any single class. Though such an approach can be successfully used to test the behavior of a single class, in case of complex use cases where the behavior of the system is spread across interactions among different objects, existing approaches are inadequate [21]. The object-oriented paradigm offers several benefits, such as encapsulation, abstraction and reusability to improve the quality of software. However, at the same time, object oriented features also introduce new challenges for testers. Typically, the complexity of an object oriented system lies in its object interactions. As a result, complex behaviors are observed when related classes are integrated and several kinds of faults can arise during integration: interface faults, conflicting functions, missing functions etc. [20]. Complete system level functionality (i.e. use cases) is usually implemented through the interaction of objects. A large number of possible interactions between collaborating classes may need to be tested to ensure the correct functionality of the system. The important steps carried out during the execution of a single use case are often represented using an UML activity diagram. Test case generation from UML activity diagrams described in [16, 25, 26] do not represent any state information of the system. Therefore, during the execution of a use case, the state of the entire system, which is a collection of objects, remains unknown. On the other hand, a system can behave very differently to the same input depending on the state it is in. The necessary state information of the objects and the object interactions can help in effective test case generation for large software products. A statechart diagram shows the lifecycle of an object: the transitions that it undergoes upon receipt of an event. Statechart test sets have better capability of revealing unit level faults [2]. A useful application of statechart diagrams is the description of the legal sequence of external system events that are recognized and handled by a system in the context of a use case. Statechart and activity diagrams together can provide control flow and event-oriented state change informations. The transitions on statecharts are annotated using method names. The details of the method implementation are usually designed using the activity diagram. Hence, using statechart and activity diagrams, it is possible to generate unit/class level and integration/cluster level test cases even before any code is written. In this paper, we present a technique that enhances the integration testing of classes by accounting for all possible states of interacting objects. We propose a novel intermediate representation named state-activity-diagram (SAD). In SAD, the control flow information during the execution of a use case is shown through a combination of state transitions and activities. It is derived by synthesizing UML statechart diagrams
Journal of Object Technology, vol. 9, no. 5, 2010
Test Case Generation Based on State and Activity Models
·
3
of different objects involved in a particular use case with an activity diagram. The states are extracted from the statechart diagrams and control flow is extracted from the activity diagram. To handle concurrent execution, some new types of nodes have been introduced. Several faults such as incorrect actions to an event, correct event passed to a wrong object or incorrect events passed to the right object in its correct state, incorrect method invocation in an activity, sneak transitions, incorrect or missing output, etc. may occur in an operation. The response to an event depends upon the corresponding object’s state. A test set is therefore necessary to detect faults if any when an object invokes a method of another object and whether the right sequence of states and activities is followed to accomplish an operation. The rest of the paper is structured as follows: Section 2 reviews the related work. Section 3 provides an overview of UML activity and state chart diagrams and introduces some basic concepts. Section 4 describes State-Activity Diagram (SAD) and its semantics. Section 5 presents our approach to the generation of SAD from statechart and activity diagrams and presents the algorithm of generating test conditions from SAD diagrams. Section 6 shows one illustrative example. Section 7 explains the experimental studies and presents result analysis. In Section 8, we provide a comparison with related work. Section 9 concludes the paper.
2 RELATED WORK Automatic test case generation from UML diagrams has received considerable attention from researchers [22, 7, 28]. There have been attempts to generate test cases from UML activity diagrams [16, 25]. Others have worked on UML state chart diagrams [4]. UML activity diagram-based test case generation has been investigated in [25] by Lizhang et al. They have generated test cases using a gray box method. In their approach, test scenarios are directly derived from the activity diagrams modeling an operation. This method deals with the logical coverage criteria of white box method and finds all the possible paths from the design model which describes the expected behavior of an operation. Subsequently, all the information for test case generation (i.e. input/output sequence parameters, the constraint conditions and expected object method sequences) is extracted from each test scenarios. Finally, they generate the possible values of all the input/output parameters by applying category-partition method [17]. It generates test cases which can achieve the path coverage. But this method ignores information about the state of the objects within the system at any time of execution. The approach presented by Andrews et al. [3] identified thin threads from top-level UML activity diagrams. A thin thread is a minimum usage scenario in a software system. It describes a complete scenario from the end user’s point of view. That is, the system takes input data, performs some computations, and outputs the result. They proposed a novel algorithm to generate thin threads from activity diagrams, which included preprocessing of the system level activity diagrams, converting them into activity hyper graphs and then deriving all execution paths from the graph. Their method does not contain any state information for the objects of the system. Chen Mingsong et al. [16] presented an idea to obtain the reduced test suite for an implementation using activity diagrams. They considered the random generation of test cases for Java programs. Running the programs with applying the test cases, they obtained the program execution traces. Finally, a reduced test suite is obtained
Journal of Object Technology, vol. 9, no. 5, 2010
4 · S. K. Swain et al.
by comparing the simple paths with program execution traces. Simple path coverage criterion helps to avoid the path explosion due to the presence of loops and concurrency. Offutt and Abdurazik [10, 9] developed a technique for generating test cases from UML state diagrams. They generate test cases automatically from change events for Boolean class attributes. They were successful in developing several useful coverage criteria that are based on UML statecharts. Their approach targets class-level testing. Their approach achieves transition coverage, full predicate coverage and transition-pair coverage. They also provide useful insights on including test prefixes that contain inputs necessary to put the software into the appropriate state for the test values. Kansomkeat and Rivepiboon [22] have proposed a method for generating test sequences using UML state chart diagrams. They transform the state chart diagram into a flattened hierarchical structure of states called testing flow graph (TFG). The TFG is then traversed from the root node to the leaf nodes to generate test cases. From the TFG, they list possible event sequences which they consider as test sequences. The testing criterion they used to guide the generation of test sequences is the coverage of the states and transitions of a TFG. This method deals with a particular object’s state chart diagram. But in an execution of a use case, more than one object often participates. Such behavior would be difficult to test using this approach. Kim et al. [28] proposed a method to generate test cases for class level testing using UML state chart diagrams. They transformed state charts to extended finite state machines (EFSMs) to derive test cases. The hierarchical and concurrent structure of states is flattened and broadcast communications are eliminated in the resulting EFSMs. Then, data flow is identified by transforming EFSMs into flow graphs to which conventional data flow analysis techniques are applied. Hartmann et al. [8] augment the UML description with specific notations to create a design-based testing environment. The developers first define the dynamic behavior of each system component using a state diagram. The interactions between components are then specified by annotating the state diagrams, and the resulting global FSM that corresponds to the integrated system behavior is used to generate the tests. Gnesi et al. [7] provided a mathematical approach to conformance testing and automatic test case generation for UML state charts. They proposed a formal conformance testing relation for input-enabled transition systems with transitions labeled by input/output-pairs (IOLTSs). Testing software in order to establish the fulfillment of the specified requirements is known as conformance testing. A conformance relation defines the correctness criterion of the implementation with respect to the formal specification. IOLTSs provide a suitable semantic model for a behavior represented by a subset of statecharts. They also provide an algorithm which generates a test suite for a given state chart model. Ali et al. [4] have proposed an approach for state-based integration testing. Their work builds an intermediate test model called SCOTEM (State COllaboration TEst Model) from UML collaboration diagrams and the corresponding statecharts. SCOTEM models all possible paths for object state transitions that a message sequence may trigger. SCOTEM then generates test paths based on various coverage criteria. Their generated test cases aim to uncover state-dependent interaction faults. Their work considers the coverage of all possible states of collaborating classes in an interaction. Briand et al. [14] have considered interactions among objects in their work, though their focus is again on class-level testing. Their work produces a test case specification consisting of a feasible sequence of transitions. In their work, to capture the interactions among state dependent objects, an invocation sequence tree
Journal of Object Technology, vol. 9, no. 5, 2010
Test Case Generation Based on State and Activity Models
·
5
is built which is then used to derive test constraints for the transition sequences to be tested. Kosmatov et al. [12] developed a novel methodology to generate test cases automatically from a given set of test conditions and the input domain. Their approach mainly performs a boundary value analysis on discrete neighborhood of input values and then uses a cost minimization function in the domain to generate test cases automatically.
3 BASIC CONCEPTS In this section, we present a few basic concepts and terminologies that are used in the rest of the paper. Both activity and statechart diagrams are used to specify dynamic behavior of a system. While an activity diagram describes the execution of a use case, a state chart diagram captures the state of an object in different phase of execution over different use cases.
3.1 Activity Diagrams UML activity diagrams describe the ordering of atomic pieces of behavior, called activities. The notation is inspired by flowcharts, state transition graph and petri nets. An activity diagram can be used to model complex processes that have parallelism, loops and event driven behavior. They can also be used to model the behavior of some use cases or to specify the workflow or business process. The nodes represent processes or process control, including action states, activity states, decisions, swimlanes, forks, joins, objects, signal senders and receivers. The edges represent sequences of activities including the control flows, message flows and signal flows. Activity state and action state are denoted with round corner boxes. Transitions are shown as arrows. Branches are shown as diamonds with one incoming arrow and multiple exit arrows. Each arrow may be labeled with a Boolean expression to be satisfied to choose the branch. Forks and joins are represented by multiple arrows entering or leaving a synchronization bar. A merge has multiple input transitions and a single output. Using swimlanes, the activities are arranged in vertical zones separated by lines. Each zone represents the responsibilities of a particular class. For each object that executes one or more actions, a column is assigned with its name and placed at the top of the column. Then each action associated with an object is placed in that swimlane. In a wait state, the system waits for the occurrence of an event, e.g. some deadline occurs or a customer sends some additional information. A wait state is also used for synchronization of a thread with other parallel threads. In the wait state, the system waits for the completion of the other parallel threads. In a compound activity state, a different activity diagram can be executed. This different activity diagram is started when the compound state is entered. When the activity diagram finishes, the compound activity state is exited. An edge starts from the source node and terminates at the target. An edge is labeled with an expression of the form e[c]/a, where e is an event expression, c is a guard condition expression, and a is an action expression. Events are also called signals in UML. Each of these three components is optional. An edge with label e[c]/a has the following meaning: If the system is in the source state, the event e occurs, and the guard condition c evaluates to true, then the system transits out of the source state, the action a is performed, and the target state is entered. A guard expression is a conditional/Boolean expression that can refer to local variables in UML diagram. The local variables of diagram are Boolean, integers and strings.
Journal of Object Technology, vol. 9, no. 5, 2010
6 · S. K. Swain et al.
Figure 1 – Activity Diagram of ATM-Bank login system
Figure 1 shows the activity diagram for an ATM. It describes the flow of activities in different objects. The ATM starts with getCardinfo() activity and then collects the PIN (Personal Identification Number) using the getPIN() method. Next, control goes to Bank as ATM asks Bank to verify PIN and card. Now Bank starts verifying using the verifyCard() method to check card. On “incorrect card”, it invokes the returnCard() method of ATM to end the session. On the other hand, on successful card-validation, it goes to check the validity of PIN and in case the PIN is valid, it asks the ATM to go to the next session. But in case of an invalid PIN, bank increments its invalid PIN counter and calls the signal reenterPIN() to ask the ATM to prompt for a PIN. But if the invalid PIN counter goes beyond some maximum value, Bank signals the abort method to ATM and asks to return the card.
3.2 Statechart Diagrams Statechart diagrams represent the state-based behavior of entities by specifying its response to the receipt of event instances. Typically, it is used for describing the behavior of classes. It shows how an object will react to an event. Each reaction may be in the form of a sequence of actions, possibly accompanied by a transition from one named state to another. An event represents the receipt of a signal, or the effect of a method call. An action represents the sending of a signal, or the call of an operation. States in the statechart are rendered by appropriate state symbols, while transitions are generally rendered by directed arcs that connect them. Each transition is represented by the name of an event, followed by an action expression. An optional
Journal of Object Technology, vol. 9, no. 5, 2010
Test Case Generation Based on State and Activity Models
·
7
Figure 2 – Statechart Diagram of ATM
guard—a Boolean-valued expression—denotes whether a particular occurrence of the event should trigger the specified actions—if it is false, then the fact that the event has occurred is simply ignored. A state is a condition or situation of an object during its life or an interaction during which the object satisfies some conditions, performs some actions, or waits for some events. A composite state is decomposed into two or more concurrent substates (called regions) or into mutually exclusive disjoint substates. Conceptually, an object remains in a state for an interval of time. A state is shown as a rectangle with rounded corners. The transition begins or fires with the occurrence of the trigger event. It may be labeled by a transition string that has the following general format: Event [guard-condition] / ^ action-expression An event is a message that is sent to an object. The action-expression is executed if and when the transitions fire. Figure 2 shows the statechart diagram of an ATM. It shows the state transition of the ATM. It starts with start state and on inserting a card, it goes to the CardEntry state. On getting the card information, it goes to the PINEntry state and collects the PIN (Personal Identification Number). From that state it invokes the verifyPIN() method of Bank and waits in verification state. Depending on the verification status it either asks for re-entering the PIN and goes to the next session or aborts by returning the card to the user. Figure 3 shows the statechart diagram of a Bank. It starts in the idle state. On request of verifying a card from an ATM, it goes to verifying the state which is a composite state. It first verifies the card and if on “invalid card” it returns back to the idle state, invoking the abort() method of the ATM. On “valid card”, it checks the PIN and goes to the verifyingPIN sub-state. On “valid PIN”, it confirms the ATM and goes back to the idle state. On “invalid PIN”, it also increments the invalid PIN count and compares it with its maximum value. On comparison, it either asks the ATM to abort or to reenter the PIN and goes to the idle state itself.
Journal of Object Technology, vol. 9, no. 5, 2010
8 · S. K. Swain et al.
Figure 3 – Statechart Diagram of a Bank.
Each statechart diagram can be modeled as a Deterministic Finite Automata {Q, Σ, δ, q0 } Q = set of states Σ = set of transitions where each transition has three parts event[guard] /action. 1. event(t): transition method. Actual method of the object. 2. guard(t): guard condition which evaluates to true for successful transition. 3. action(t): may be updating action or some signal. In case of a signal, it calls some other object’s method. δ : Q × Σ → Q is a transition rule. q0 start state We define some terms like tin (q), tout (q), P (t) & S(t) as follows: tin (q) = {t | ∃q 0 ∈ Q, δ(q 0 , t) = q} tout (q) = {t | ∃q 0 ∈ Q, δ(q, t) = q 0 } tin (q0 ) = {Φ} P (t) = {q | t ⊆ tout (q)} S(t) = {q | t ⊆ tin (q)}
Journal of Object Technology, vol. 9, no. 5, 2010
Test Case Generation Based on State and Activity Models
·
9
3.3 Overview of a Few Basic Testing Concepts In this subsection, we discuss basic concepts related to program testing that have been made use of throughout this paper. Different levels of testing: In object-oriented systems in general, testing is done at four different levels of abstraction: at algorithmic level, class level, cluster/integration level and system level [20, 19]. The algorithmic level, similar to conventional program testing, considers the code for each operation in a class. Class level testing tests the code for each operation as well as method interactions within the class. At cluster level testing, the interactions among cooperating classes are tested. This is similar to integration testing. System level testing is done on the complete system where all clusters are combined. A path represents the flow of execution from the start of a method to its exit. Path Testing: A path of software is a sequence of instructions, statements or a high-level design that starts at an entry, junction, or decision and ends at another, or possibly the same, junction, decision, or exit. A path may go through several junctions, processes, or decisions, one or more times. Designing test cases to execute all paths is called path testing [19]. Basis Path Testing: A basis test path is defined as an execution path from the start state to a final state which executes any loop at most once. A basis path can be differentiated from all other basis path by at least one edge or one state-activity node. Testing all basis paths is called basis path testing. It fulfills the requirements of branch testing and also tests all of the independent paths that could be used to construct any arbitrary path. Basis Path testing is a hybrid between path and branch testings [18].
4 SAD: STATE ACTIVITY DIAGRAMS In this section, we introduce our proposed intermediate diagram which we have named state-activity diagram (SAD) which captures the information present in both statechart and activity diagrams. SAD shows control flow information during the execution of a use case. Our proposed state-activity diagram is made up of the following components: State-Activity Node: This node denotes the state of an object during execution (Figure 4(a)). Each node contains an activity. The activity is performed on entering the node during execution time. As the activity gets terminated, an event, called termination event, is generated and the outgoing edge from the node is activated. Activities are assumed to be atomic. A state having no activity is assumed to be in wait state and it waits for an external-event to trigger a state transition. AND-OR node: These are new kinds of nodes which we introduce here. For an AND node (Figure 4(b) & Figure 4(c)) all the outgoing edges are activated simultaneously on activation of all
Journal of Object Technology, vol. 9, no. 5, 2010
10 · S. K. Swain et al.
Figure 4 – (a) state-activity node (b)-(c) AND-node (d) decision node (e)-(f) OR-node
(a) (b)
Figure 5 – (a) Start node (b) Final node
the incoming edges. Similarly for an OR node (Figure 4(e) & Figure 4(f)), only one of the outgoing edges is activated depending upon the guard condition if at least one of the incident edge is activated. If there is only one incoming edge to an OR node and more than one outgoing edges, then it is called an OR-join node. In a decision node (Figure 4(d)), there is only one incoming edge and depending on the Boolean decision on the node one of the outgoing edges is activated. On a merge node, there is more than one incoming edges and only one outgoing edge. A merge node in activity diagram is actually a specific kind of OR node in SAD. Edges: Edges connect different kinds of nodes. An outgoing edge from a state-activity node is activated on an event. An edge has a Boolean guard condition associated with it. There is only one unique start state in a state activity diagram (Figure 5(a)). The system starts the execution in the start state. One state activity diagram may have more than one final state, which specifies termination of an executing thread or activity (Figure 5(b)).
Journal of Object Technology, vol. 9, no. 5, 2010
Test Case Generation Based on State and Activity Models
·
11
4.1 Formal Definitions of SAD In the following, We give a formal definition of SAD. A State-Activity Diagram is a seven tuple as defined below: SAD = (S, E, N, G, δ, S0 , F ) Where S = {s1 , s2 , · · ·, sn } is a finite set of state-activity nodes representing system states. N = {n1 , n2 , · · ·, nm } is a finite set of AND-OR-Decision nodes. E = {e1 , e2 , · · ·, en } is a finite set of edges representing labeled transitions. G = {g1 , g2 , · · ·, gn } is a set of guard conditions where gi corresponds to the edge ei . δ : (S ∪ N ) × E × G → (S ∪ N ) is the transition function. S0 ∈ S is the start state. F ⊆ S is a set of final states. Now we define current state of SAD, which is actually the union of object states. The state of the system during execution of an use-case is spread over the objects. To achieve the system state, we define two more terminologies, current state and enabled edges. If SAD = (S, E, N, G, δ, S0 , F ) is a state-activity-diagram then the system at any state (SS) is described by an ordered pair: SS = {CS, EE}, Where CS ⊆ S ∪ N , which denotes the current-state of the system. The system starts at s0 where CS = {s0 } and the system is in final state when F ⊆ CS. EE ⊆ E, which describes the enabled edges of the current state. Enabled edges are generally a subset of the outgoing transitions from the states of current states. Out of the enabled state, transitions can take place through one or more edges. We define the predecessor and successor of an edge, which are basically sets of nodes. These definitions are necessary to capture the state transition behavior of the system in the presence of an AND-node. ∀ei ∈ E, P (ei ) predecessor of an edge and S(ei ) Successor of an edge are defined as follows: • P (ei ) = {s ∈ S | ∃gi ∈ G and s × ei × gi ∈ δ} • S(ei ) = {s ∈ S | δ(P (ei ), ei , gi ) = s} Now we try to analyze the predecessor and successor of an edge in presence of AND-OR nodes. Case 1: AND node (Figure 4(b)) with two incident edges (ei , ej ) and one outgoing edge (ek ): P (ek ) = P (ei ) ∪ P (ej ) S(ei ) = S(ej ) = S(ek )
Journal of Object Technology, vol. 9, no. 5, 2010
12 · S. K. Swain et al.
Case 2: AND node (Figure 4(c)) with one incident edge (ei ) and two outgoing edges (ej , ek ): P (ei ) = P (ej ) = P (ek ) S(ei ) = S(ej ) ∪ S(ek ) Case 3: OR node Figure 4(e) with two incident edges (ei , ej ) and one outgoing edge (ek ): P (ek ) ⊆ P (ei ) ∪ P (ej ) S(ei ) = S(ej ) = S(ek ) Case 4: OR node (Figure 4(f)) with one incident edge (ei ) and two or more outgoing edges (ej , ek ): P (ei ) = P (ej ) = P (ek ) S(ei ) ⊆ S(ej ) ∪ S(ek ) Now we define EE = {ei ∈ E | P (ei ) ⊆ CS & gi = true} i.e. EE or the set of enabled edges are those whose predecessor states are currently in state CS and the guard condition corresponding to the edge is true. Again at any CS, ∀ei ∈ EE we can fire ei . On firing ei , CS changes to CS’ as follows: CS 0 = (CS − P (ei )) ∪ S(ei ) So in the previous cases it will be: Case 1: CS 0 = (CS − (P (ei ) ∪ P (ej ))) ∪ S(ek ) Case 2: CS 0 = (CS − P (ei )) ∪ (S(ek )) Case 3: if ei fires then CS 0 = (CS − P (ei )) ∪ S(ek ) else if ej fires CS 0 = (CS − P (ej )) ∪ S(ek ) Case 4: if gj is true then CS 0 = (CS − P (ei )) ∪ S(ej ) else if gk is true CS 0 = (CS − P (ej )) ∪ S(ek )
Journal of Object Technology, vol. 9, no. 5, 2010
Test Case Generation Based on State and Activity Models
·
13
4.2 Test Coverage Test coverage indicates the extent to which a testing criterion such as path testing, branch testing or basis path testing is achieved. A popular test coverage criterion involves covering all the basis paths in the SAD. Since basis path coverage is a stronger test coverage than transition or state coverage, it ensures that all the states and edges visited at least once. So this will give us both state and activity path coverages. These are finite as the numbers of basis paths are also finite. 4.2.1
State-activity Coverage:
Given a test set T and state-activity diagram SAD, T must cause each possible state-activity node in SAD to be taken at least once. For any basis path p1 , there must be at least one test case t ∈ T such that, when the software is executed using t, the basis path p1 of SAD is executed. 4.2.2
Transition Coverage:
Given a test set T and state-activity diagram SAD, T must cause each possible transition path in SAD to be taken at least once [4]. 4.2.3
Activity Path Coverage:
is a sequence of non-concurrent activities (that is, activities which are not executed in parallel) from the start activity to an end activity in a SAD, where each activity in the sequence has at most one occurrence except those activities that exist within a loop. Each activity in a loop may have at most two occurrences in the sequence [5].
5 OUR PROPOSED APPROACH (SATEC) We propose a test case generation technique that is based on the interactions among the objects. This test data can be applied during the integration test phase, right after the completion of class testing. We have named our proposed approach SATEC (State Activity TEst Case generation). Figure 6 shows the steps of the test case generation. They are four: 1. SAD generation 2. Basis path generation (using coverage criteria) 3. Test scenario generation 4. Test case generation
Synthesis of SAD We now present our approach to generate SADs from the activity and statechart diagrams of a given system. To generate an SAD, we proceed with an initial set of activity states S. We iteratively add other states to it and connect them with appropriate edges. The steps involved in this are the following: Step-1 Create a start node.
Journal of Object Technology, vol. 9, no. 5, 2010
14 · S. K. Swain et al.
Coverage Criteria Activity Diagram SAD Generator
Basis Path SAD
Generator (UTCG)
Statechart Diagram Test Case Generation
Test Scenario
Basic Test Path
Test Scenario Generator
Figure 6 – The Steps of our approach to test case generation (SATEC)
Step-2 Create an AND node. Add an edge (transition) to the AND node from the start node with guard condition true. Add the start states of all the objects and add one edge (transition) from the AND node to the node representing start state of each object. Step-3 Based on the activity diagram, add nodes by the following rules: (a) If the node is a fork/join, replace it by AND node. (b) If it is a decision node, then add it as it is in the activity. (c) If the node is an activity node: i. Find transition t from the statechart diagram of the object (object name can be found from the corresponding swim lane), such that event (t)= activity. ii. If | P (t) |> 1, then find out the condition for transition to all of the P(t)s from previous nodes. Add those transitions. iii. Add state s of S(t) with the activity to make a state-activity node. Add an OR node and make a transition from OR node to the state node. Now replace the activity node by this state-OR node combination. iv. If action(t) = signal, then add one AND node before the OR node and add one outgoing transition from the AND node to the signal destination. Now add an OR-AND combination node in the outgoing edge of the signal’s destination node’s parent (P(event(signal(t))) and merge this edge with the AND node. Add signal’s (event (signal (t))) activity state in that swimlane following the same rule described above. Step-4 Remove activity from S. Do this until S is empty. Step-5 Remove all redundant OR nodes. (An OR node with just one incoming transition and one outgoing transition is redundant).
Journal of Object Technology, vol. 9, no. 5, 2010
Test Case Generation Based on State and Activity Models
·
15
Algorithm for UML Test path and Condition Generation (UTCG) To generate test conditions from SAD, we use depth-first search. We start from the start state and explore states by traversing all enabled edges. We store the system state, transition edge and guard condition on a stack. On encountering a loop, as mentioned in the basis path definition, we traverse the loop once. Hence, on encountering a loop, we find out if the newly visited state exists in any already derived basis paths. If it belongs to some path, we generate a basis path by concatenating the partial path from the basis path from the state with the current path. In case no basis path exists, we backtrack from the stack and update the stack such that next time we explore the unexplored edge which is at maximum depth. The pseudo code of the algorithm is given below. PSEUDOCODE (UTCG) Input : SAD Output : Test Conditions, Test Scenarios, Method sequences for each basis path CS : vector containing the current state of the SAD EE : currently enabled edges TS : current test path ALLTS : all basis path Visited Edges : a hash-map containing visited edges corresponding to a state /* Generates all basis paths */ TSGSAD (SAD) Begin Add start-state s0 to CS and t to EE such that P(t) = s0 Add CS, EE to TS Do begin If (CS contains F) /* Final state found */ Begin Add TS to ALLTS Print basispath from TS RemoveExploredState () end If (sizeof EE >0) /* all the edges are explored */ begin MakeTransition () UpdateEE () LastTransition = true end Else begin If (last transition = = true) /* if loop found */ If (ALLTS contains CS) MakeBasisPath ()
Journal of Object Technology, vol. 9, no. 5, 2010
16 · S. K. Swain et al.
Else FindStateWithUVtransition () Else/* returning back from DFS */ RemoveExploredState () end end While TS is not empty /* All paths found */ Print All path from ALLTS end /* Make a transition from EE and updates CS */ begin select edge e from EE add e to Visited Edges for CS remove the predecessor from CS add its successor states in CS add CS and e in TS end /* Update EE after a change in CS */ UpdateEE() begin remove all edges from EE. If (Visited Edges contains all outgoing edges of CS) Return For each state in CS begin If (state has outgoing edge not to AND node) Add edge to EE else begin If (incoming edges’ of AND node predecessor is in CS) Add edge to EE end end end /* remove explored states from CS */ RemoveExploredState ( ) begin remove top state from TS add top state of TS to CS updateEE ( ) end /* makes a basis path from previous paths */ MakeBasisPath ( ) begin find path from CS to finial state from ALLTS add the path to TS
Journal of Object Technology, vol. 9, no. 5, 2010
Test Case Generation Based on State and Activity Models
·
17
add TS to ALLTS print basispath from TS end /* in case of Loop, find state with unvisited transition */ FindStateWithUVtransition ( ) begin temp = last state in TS having unvisited edge find last-but-one occurrence of CS in TS add path from CS to temp in TS CS = temp UpdateEE ( ) end
Test Case Generation We define a basis path as follows: Let SAD = (S, E, N, G, δ, s0 , F ) be a state-activitydiagram. Let t1 ∈ T S be the test-suite containing all the test cases. Let t1 ∈ T S be a test case for which the system transits through the following states: SS0 (g0 )e0 → SS1 (g1 )e1 → · · · (gn )en → SSn is a sequence of system states (SS) and edges where SSi = {CSi , EEi }, CS0 = {s0 }, F ⊆ CSn and ∀i ≥ 0, ei ∈ EEi , gi ∈ G and CSi+1 = (CSi − P (ei )) ∪ S(ei ). In this definition, if all guard conditions g1 , g2 , ..., gn are set, then we get an execution-path (EP) of the SUT (System Under Test). To generate the test cases, we use these guard conditions of the transition edges. Test coverage criteria will be covering all the basis paths in the SAD. It ensures that all the state-activities and transition edges are visited at least once.
Complexity Analysis In the following, we analyze the complexity of our test condition generation algorithm (UTCG). The UTCG is based upon depth-first-search with loop detection and management. Let a use case corresponding to a SAD involve n number of interacting classes. The state model of each class has a statechart diagram. Let’s assume that in a statechart diagram, there are • si number of states • ei number of edges Let us also assume that while making SAD we add eij interaction edges for objects P of the classes P i and j.PHence the total number of nodes N = si and total number of edges E = ei + eij . Now the number of basis paths in a graph depends on the number of linearly independent paths from the start node to the final node. It is given by the cyclomatic complexity of the graph [19]. The cyclomatic complexity of a planar graph can be defined using McCabe’s cyclomatic complexity. But unfortunately SAD is not necessarily a planar graph. Now we randomly generate some paths in the graph and form a path-edge incident matrix with each path forming a row vector and each edge a column-vector. Now a value at [i,j]=0 means that edge j is not there in the ith path.
Journal of Object Technology, vol. 9, no. 5, 2010
18 · S. K. Swain et al.
ATM
atm
bank
Bank
1
Boolean cardValid = true Boolean PINcorrect = true Int numIncorrect = 0 Int maxNumIncorrect = 2 Verify PIN Verify Card done
1
getCardInfo getPIN Verify sessionNext returnCard reeneterPIN
about
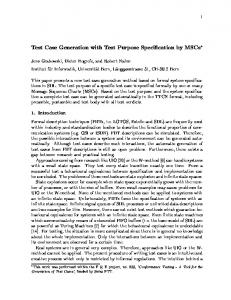
Figure 7 – ATM-Bank class diagram
If we determine the rank of the matrix using the Gauss-elimination method, we can get the number of linearly independent paths in the SAD. Let the number of basis paths be k. Now the test case generation exploration is being done on edges of the SAD. • Max number of exploration of an edge=2*k. because each edge can be explored twice if there is a loop in the path • Hence the algorithm takes O(2 ∗ k ∗ E) time or O(E) time, where E is total number of edges present in SAD.
6 ILLUSTRATIVE EXAMPLE In this section, we discuss one example of a login system of an ATM-Bank as an example. Figure 1 shows an example of an ATM activity diagram. Figure 2 and Figure 3 show the corresponding statechart diagrams of ATM and BANK. In an ATMBank transaction, we will only be considering the part in which the ATM validates a card with a given PIN (Personal Identification Number) and allows the user to move on to the next session. Figure 7 shows the ATM-Bank Class diagram with the corresponding methods. Figure 8 shows the generated SAD from the given ATM-Bank statechart diagrams and the activity diagram. We also simulated our UTCG algorithm to generate system state scenarios and object-method sequences. Table 1 shows the result of simulation of execution path using UTCG algorithm. The exact object-method sequence and the test scenarios are described in Table 2 for the test conditions < cardValid=True, PINvalid =True>. Clearly, to generate test cases from these test conditions, we partition the card and PIN numbers into valid and invalid numbers. We choose both PIN and card from the valid class and get a test case1< validCard, validPINnumber >. Corresponding to the other basis paths, the system state scenarios and method sequence of another test case are listed in Table 3. Test case 2 Similarly other test cases are:
Journal of Object Technology, vol. 9, no. 5, 2010
Test Case Generation Based on State and Activity Models
·
19
Figure 8 – SAD of ATM-Bank login system
Test Case 3: Test Case 4: Test Case 5: Test Case 6: Test Case 7:
7 EXPERIMENTAL STUDIES In this section, we present a fault model. We have implemented a prototype tool in Java. The SAD is exported into XML format using the Magic Draw [1] tool and then the XML file is parsed to generate the SAD machine. Then, our algorithm (UTCG) is
Journal of Object Technology, vol. 9, no. 5, 2010
20 · S. K. Swain et al.
CSi s0 n1 s1,n9 s1,s6 s2,s6 n10,s6 s3,s6 n3,s6 s4,n6 s4,s7 s4,n14
EEi e0 e1,e2 e3,e13 e3 e4 e5 e6 e14,e7,e34 e15,e8 e8,e16 e8,e17,e18
ei e0 e1,e2 e13 e3 e4 e5 e6 e14,e7,e34 e15 e16 e17
s4,s8 s4,n8
e8,e19 e8,e20,e21
n11,n8
e9,e31,e29, e20,e21 e9,e31,e29, e13,e22,e23 e9,e31,e29, e13,e22,e23 e10 e11 e12 e33
n11,n9,n15 n11,s6,n15 n4,s6 s5,s6 n12,s6 s9,s6
CSi+1 n1 s1,n9 s1,s6 s2,s6 n10,s6 s3,s6 n3,s6 s4,n6 s4,s7 s4,n14 s4,s8
EEi+1 e1,e2 e3,e13 e3 e4 e5 e6 e14,e7,e34 e15,e8 e8,e16 e8,e17,e18 e8,e19
e19 e8
gi true true,true true true true true true true true true card valid = true true true
s4,s8 n11,n8
e20,e21
true
n11,s6,n15
e13
true
n11,s6,n15
e9,e22
PINvalid = true true true true true
n4,s6
e8,e20,e21 e9,e31,e29, e20,e21 e9,e31,e29, e13,e22,e23 e9,e31,e29, e22,e23 e10
s5,s6 n12,s6 s10,s6 s10,s6
e11 e12 e10 e10
e10 e11 e12 e33
Table 1 – Execution path Simulation of SAD
applied to generate test conditions. We have conducted several experiments using the tool. We present and analyze the results.
7.1 Fault Model The effectiveness of test cases can be evaluated using a fault injection technique called MUTATION ANALYSIS [15, 11]. Mutation analysis is a process by which faults are injected into the system to verify the efficiency of the test cases. In this testing, a set of mutation rules is used to change a program, known as mutants. Mutation-based analysis is a fault-based testing [27]. The faults are seeded and tested to detect faults or to kill the mutants. Every test strategy targets to detect certain categories of faults called its fault model [10]. In order to seed faults into the code, we used eleven major types of mutation operators. The following is the complete list of the mutation operators that we used: 1. Change parameter: This operator [2] changes the parameter passed in an operation call. The valid value of parameter is replaced with an invalid value. 2. Wrong initial State: This operator [4] changes the initial state of an object before it receives a message. The initial state is replaced by an invalid state, in which
Journal of Object Technology, vol. 9, no. 5, 2010
Test Case Generation Based on State and Activity Models
System State
·
21
Object-Method Sequence
ATM. Idle, Bank. Idle ATM, CardEntry, Bank.Idle ATM, PIN entry, Bank.Idle ATM.Verification, Bank.Idle ATM.Verification, Bank.Verifying Card ATM.Verification, Bank. VerifyingPIN ATM.Verification,Bank.Idle ATM.sessionNext, Bank.Idle ATM.returningCard, Bank.Idle
ATM.getCardinfo() ATM.getPIN() Bank.verifyCard() Bank.verifyPIN() ATM.nextsession() ATM.returnCard()
Table 2 – System state Scenario and Object Method Sequence of Test Case 1
SystemState
Object-Method Sequence
ATM Idle, Bank Idle ATM CardEntry, Bank Idle ATM PIN entry, Bank Idle ATM Verification, Bank Idle ATM Verification, Bank Verifying Card ATM Verification, Bank Idle ATMreturningcard, Bank Idle
ATMgetCardInfo() ATMgetPIN() BankverifyCard() ATMreturncard()
Table 3 – System state Scenario and Object Method Sequence of Test Case 2
the object should not receive a particular message. 3. Remove function call: This operator [15] removes each function call in a method. 4. Missing condition: This operator removes the condition of a conditional message in the code. 5. Alter condition operator: This operator changes the condition in the code corresponding to a path condition in a collaboration. 6. Violated guard condition: This operator negates the guard condition of a transition. 7. Missing called function: This operator removes the functions that are called by an object. 8. Conflicting state: This operator sets the states of two objects of different classes in states that are conflicting with each other. 9. Missing interaction: A scenario is comprised of a strict sequence of interactions. A fault may occur if an interaction in the design is missing in the implemented version. 10. Loop fault: This forces the loop control variable to be executed in incorrect number of times. This operator executes the loop exactly n+1 times, n-1 times, 0 times and 1 time.
Journal of Object Technology, vol. 9, no. 5, 2010
22 · S. K. Swain et al.
11. Synchronization fault: This fault occurs when some activity begins execution before completion of execution of group of all preceded activities.
Results In order to validate the effectiveness of our proposed approach, three software program modules were developed by students of KIIT University as their class room assignments using the Java language. Then we generated mutant programs by seeding faults using the above mutation operators. This strategy is well established for assessing and comparing test techniques and has shown to yield useful results [11]. The number of faults seeded was based on the application design. In our experiments we have considered four different types of applications namely ATM-Banking System (ABS), Library Information System (LIS) and Cell Phone System (CPS). All these systems are designed in UML diagrams. The designs were also implemented in Java. We have seeded three programs with faults generated using mutation operators. The number of faults seeded is presented in Table 4. In Table 4, we also present the number of faults detected using our SATEC approach, the transition coverage and activity path coverage. As can be observed from the table, our approach (SATEC) outperforms both transition coverage and activity path coverage for all of the case studies. This is because many of the faults that are associated with system state changes due to method interaction across multiple classes are subtle and not specifically detected by transition coverage and activity path coverage. Faults like missing called activity/function, wrong calling state, conflicting state, interaction fault etc. are detected using our technique. Figure 9 shows the graphical analysis of detected faults against coverage criteria. Table 5 represents the comparative analysis of our test cases generation with black box [20], white-box [18] and gray-box [25] techniques for ATM login system. Here N represents “not shown or described”. Faults Detected / Mutants Killed Software Faults Transition Activity Path State-Activity Module Seeded Coverage Coverage Coverage ABS 49 41 45 49 LIS 70 64 65 69 CPS 72 65 67 71 Table 4 – Faults detected in different coverage criteria
Technique Black Box White Box Gray Box SATEC
Works on Input Output Code Activity Design SAD
Coverage Usage
Test Scenario N
Method Sequence N
Transition
N
N
Activity
9
9
Stateactivity
7
7
Table 5 – Comparative analysis
Journal of Object Technology, vol. 9, no. 5, 2010
Test Case Generation Based on State and Activity Models
·
23
Figure 9 – Graphical analysis of detected faults against coverage criteria
8 COMPARISON WITH RELATED WORK No work investigated that makes use of both statechart and activity diagrams to capture the state transition behavior as well as control flow of objects has so far been reported to the best of our knowledge. As mentioned earlier, most of the work on testing based on statechart diagrams is limited to unit testing and is not applicable to integration and system testing. Existing methods [4, 22, 7, 28] of generating test cases from statechart diagrams deal with only a single object and achieve transition and state coverage for a single class. On the other hand, test case generation from activity diagrams [16, 25, 26] fails to capture the state information of the objects within the system. In contrast with the above discussed approaches [16, 25, 26], we generate test conditions and scenarios automatically from combined statechart and activity diagrams i.e. SAD. State-based faults are difficult to be detected from the software code. Statechart diagram and state changes are difficult to implement in code. Activity diagram presents concepts at a higher abstraction level of the system. Activity diagrams are also used for gray-box testing and checking consistency between code and design nearer to the code. The presence of loop and concurrent activities in the activity diagram results in path explosion Among all UML models, statechart diagrams have perhaps received the most attention from researchers for generation of test cases [8, 10, 14, 9, 22, 28]. Most of the reported work [22, 28] addresses class-level testing. That work considers statecharts as modeling individual objects, without considering the effect that they might have on the state of other objects due to method invocation occurring during object interactions. In contrast to their work [22, 28], our approach is meant for cluster/integration level testing where object interactions through activities as well as object state behaviors are tested. In comparison to work reported in [10, 9], we use a depth-first search traversal starting from the start state of the SAD diagram which can help to achieve state-activity paths coverage. SAD is not only able to generate the object-method scenario for a particular test case but also successfully generates the expected system behavior by generating the object-method sequences of object states during the execution of a use case. In contrast with the work in [16, 8, 14], the faults such as state initialization faults,
Journal of Object Technology, vol. 9, no. 5, 2010
24 · S. K. Swain et al.
object’s state-activity dependency faults and operational faults in one use case can be covered by SAD. But in [16, 8, 14], they have not discussed or given attention towards these faults. if an object’s state initialization fault occurs, then it is imperative to assume faults in its operations and therefore there is no need to apply test cases corresponding to the operation. A fault may occur if an interaction in the design is missing in the implemented version. In comparison to [8, 14], our approach is to achieve synchronization of activities over multiple interacting objects within software. Some new kinds of nodes (AND-OR) and wait activities are introduced apart from the state-activity nodes to support the concept. It achieves state-activity path coverage and object-method sequence coverage.
9 CONCLUSION We have presented a technique to generate test cases automatically from activity diagram of a particular use case and statechart diagram of participating object in a use case. Our approach is meant for cluster level testing where object interactions are tested by considering state-transitions of objects and the corresponding activities taking place in a use case. Our algorithm generates test conditions, scenarios and object-method sequences from SAD using state-activity coverage. Our approach is used to exercise activity synchronization in the context of multiple state combinations in order to detect synchronization of state as well as activity faults within a use case of the system. It also achieves object-method sequence coverage and gives stronger level of testing than simple transition or state or activity path coverage. We have implemented a prototype tool based on our approach and have used it satisfactorily on three example problems. In the present work, we have assumed that the test data for each test case would be selected manually by the tester. Selecting test data for a large number of test cases would be tedious and time consuming. So we want to take up automatic generation of test data from test specifications as a future work. We are also now investigating how other UML models can be used to achieve higher test coverage. Also, we are planning to employ an evolutionary algorithm for optimizing the generated set of test cases without sacrificing the test effectiveness.
References [1] Magic Draw UML. Available from: http://www.magicdraw.com/. [2] A. Abdurazik, J. Offutt, and A. Baldini. A controlled experimental evaluation of test cases generated from UML diagrams. Technical report, George Mason University, Department of Information and Software Engineering, 2004. [3] A. Andrews, R. France, S. Ghosh, and G. Craig. Test adequacy criteria for UML design model. Software Test Verification and Reliability, 13:97–127, 2003. [4] Shaukat Ali, Lionel C. Briand, Muhammad Jaffar-ur Rehman, Hajra Asghar, Muhammad Zohaib Z. Iqbal, and Aamer Nadeem. A state-based approach to integration testing based on UML models. Inf. Softw. Technol., 49(11-12):1087– 1106, 2007. [5] Debasish Kundu and Debasis Samanta. A novel approach to generate test cases from UML activity diagrams. Journal of Object Technology, 8(3):65–83, 2009.
Journal of Object Technology, vol. 9, no. 5, 2010
Test Case Generation Based on State and Activity Models
·
25
[6] G. Booch, J. Rumbaugh, and I. Jacobson. The Unified Modeling Language Reference Manual. Addison-Wesley, Reading, Massachusetts, 1999. [7] Stefania Gnesi, Diego Latella, and Mieke Massink. Formal test-case generation for UML statecharts. In ICECCS ’04: Proceedings of the Ninth IEEE International Conference on Engineering Complex Computer Systems Navigating Complexity in the e-Engineering Age, pages 75–84, Washington, DC, USA, 2004. IEEE Computer Society. [8] J. Hartmann, C. Imoberdorf, and M. Meisinger. UML-based integration testing. In ISSTA ’00: Proceedings of the 2000 ACM SIGSOFT international symposium on Software testing and analysis, pages 60–70, New York, NY, USA, 2000. ACM. [9] J. Offutt and A. Abdurazik. Generating tests from UML specifications. In Proceedings of the 2nd International Conference on UML, Lecture Notes in Computer Science, volume 1723, pages 416– 429, Fort Collins, TX, January 2001. Springer-Verlag GmbH. [10] J. Offutt, S. Liu, A. Abdurazik, and P. Ammann. et al. Generating test data from state-based specifications. Software Test Verification and Reliability, 13:25– 53, 2003. [11] J.H. Andrews, L.C. Briand , and Y. Labiche. Is mutation an appropriate tool for testing experiments? In Proceedings of the IEEE 27th International Coference on Software Engineering (ICSE), pages 15–21, 2005. [12] Nikolai Kosmatov, Bruno Legeard, Fabien Peureux, and Mark Utting. Boundary coverage criteria for test generation from formal models. In ISSRE ’04: Proceedings of the 15th International Symposium on Software Reliability Engineering, pages 139–150, Washington, DC, USA, 2004. IEEE Computer Society. [13] L. Briand and Y. Labiche. A UML-based approach to system testing. Journal of software and system modelling, 1(1):194–208, 2002. [14] L.C. Briand, Y. Labiche, and J. Cui. Automated support for deriving test requirements from UML statecharts. Journal of Software and System Modelling, 4(4):399–423, 2005. [15] M.E. Delamaro, J. C. Maldonado, and A. P. Mathur. Interface mutation: An approach for integration testing. IEEE Transactions on Software Engineering, 27(3):228–247, 2002. [16] Chen Mingsong, Qiu Xiaokang, and Li Xuandong. Automatic test case generation for UML activity diagrams. In AST ’06: Proceedings of the 2006 international workshop on Automation of software test, pages 2–8, New York, NY, USA, 2006. ACM. [17] T. J. Ostrand and M. J. Balcer. The category-partition method for specifying and generating fuctional tests. Commun. ACM, 31(6):676–686, 1988. [18] P.C Jorgensen. Software Testing: a Craftsman’s approach. CRC PRESS, 2nd edition, 2002. [19] R. Mall. Fundamentals of Software Engineering. Prentice Hall, Springer-Verlag GmbH, 2nd edition, 2004. [20] Robert V. Binder. Testing Object-oriented Systems: Models, Patterns, And Tools. Addison-Wesley Object Technology Series, 1999.
Journal of Object Technology, vol. 9, no. 5, 2010
26 · S. K. Swain et al.
[21] R.V. Binder . Testing object-oriented software: a survey. Software Testing Verification and Reliability, 6(3/4):125–252, 2006. [22] S. Kansomkeat and W. Rivepiboon. Automated-generating test case using UML statechart diagrams. In In Proceedings of SAICSIT, ACM, pages 296–300, 2003. [23] M. Sarma, D. Kundu, and R. Mall. Automatic test case generation from sequence diagram. In Proceedings of the 15th International conference on Advanced Computing and Communication, pages 60–67, 2007. [24] Monalisa Sarma and Rajib Mall. Automatic generation of test specifications for coverage of system state transitions. Information & Software Technology, 51(2):418–432, 2009. [25] W. Linzhang, Y. Jiesong, Y. Xiaofeng, H. Jun, L. Xuandong, and Z. Guoliang. Generating test cases from UML activity diagrams based on gray-box method. In Proceedings of the 11th Asia-Pacific Software Engineering Conference (APSEC04), pages 284 – 291, 2004. [26] Xiaoqing BAI, C. Peng Lam, and Huaizhong LI. An approach to generate the thin-threads from the UML diagrams. In Proceedings of the 28th Annual International Computer Software and Applications Conference (COMPSAC’04), 2004. [27] Y. Ma, A. J. Offutt, and Y. R. Kwon. Mujava: An automated class mutation system. Journal of Software, Verification and Reliability, 15(2):97 – 133, 2005. [28] Y.G. Kim, H.S. Hong, D.H. Bae, and S.D. Cha. Test cases generation from UML state diagrams. Software Testing Verification and Reliability, 146(4):187– 192, 1999.
Journal of Object Technology, vol. 9, no. 5, 2010
Test Case Generation Based on State and Activity Models
·
27
About the authors Santosh Kumar Swain is presently working as teaching faculty in School of Computer Engineering, KIIT University, Bhubaneswar, Orissa, India. He has acquired his M.Tech degree from Utkal University, Bhubaneswar. He has contributed more than six papers to Journals and Proceedings. He has 17 years of teaching experience. He has written one book on “Fundamentals of Computer and Programming in C”. His special fields of interest includes Software Engineering, Object Oriented Systems, Sensor Network and Compiler Design etc. Contact him at
[email protected]. Durga Prasad Mohapatra acquired his M.Tech at National Institute of Technology, Rourkela, India. He has received his Ph. D from Indian Institute of Technology, Kharagpur, India. He is currently working as an associate professor at National Institute of Technology, Rourkela. His special fields of interest include Software Engineering, Discrete Mathematical Structure, Program Slicing and Distributed Computing. He is a member of IEEE. He can be reached at
[email protected]. Rajib Mall Ph.D. is presently working as Professor, Computer Science & Engineering and Head, Administrative Computer Service Support Centre in IIT, Kharagpur, West Bengal, India. His research areas are Distributed and Parallel Processing and Software Engineering. He is a Senior Member of IEEE. Having an academic experience of a decade and half in IIT, Kharagpur, he has guided several doctoral dissertations and published over a hundred research articles. He has also written one book on “Software Engineering” and one book on “Real Time Systems”. He can be reached at
[email protected].
Journal of Object Technology, vol. 9, no. 5, 2010