Clim. Past, 10, 1473–1487, 2014 www.clim-past.net/10/1473/2014/ doi:10.5194/cp-10-1473-2014 © Author(s) 2014. CC Attribution 3.0 License.
Testing long-term summer temperature reconstruction based on maximum density chronologies obtained by reanalysis of tree-ring data sets from northernmost Sweden and Finland V. V. Matskovsky1 and S. Helama2 1 Institute 2 Finnish
of Geography, Russian Academy of Sciences, Moscow, Russia Forest Research Institute, Northern Unit, Rovaniemi, Finland
Correspondence to: V. V. Matskovsky (
[email protected]) Received: 13 August 2013 – Published in Clim. Past Discuss.: 16 October 2013 Revised: 1 June 2014 – Accepted: 11 June 2014 – Published: 5 August 2014
Abstract. Here we analyse the maximum latewood density (MXD) chronologies of two published tree-ring data sets: one from Torneträsk region in northernmost Sweden (TORN; Melvin et al., 2013) and one from northern Fennoscandia (FENN; Esper et al., 2012). We paid particular attention to the MXD low-frequency variations to reconstruct summer (June–August, JJA) long-term temperature history. We used published methods of tree-ring standardization: regional curve standardization (RCS) combined with signalfree implementation. Comparisons with RCS chronologies produced using single and multiple (non-climatic) ageing curves (to be removed from the initial MXD series) were also carried out. We develop a novel method of standardization, the correction implementation of signal-free standardization, tailored for detection of pure low-frequency signal in tree-ring chronologies. In this method, the error in RCS chronology with signal-free implementation is analytically assessed and extracted to produce an advanced chronology. The importance of correction becomes obvious at lower frequencies as smoothed chronologies become progressively more correlative with correction implementation. Subsampling the FENN data to mimic the lower chronology sample size of TORN data shows that the chronologies bifurcate during the 7th, 9th, 17th and 20th centuries. We used the two MXD data sets to reconstruct summer temperature variations over the period 8 BC through AD 2010. Our new reconstruction shows multi-decadal to multi-centennial variability with changes in the amplitude of the summer temperature of 2.2 ◦ C on average during the Common Era. Although the MXD data provide palaeoclimate research with a highly reliable summer temperature proxy, the bifurcating dendro-
climatic signals identified in the two data sets imply that future research should aim at a more advanced understanding of MXD data on distinct issues: (1) influence of past population density variations on MXD production, (2) potential biases when calibrating differently produced MXD data to produce one proxy record, (3) influence of the biological age of MXD data when introducing young trees into the chronology over the most recent past and (4) possible role of waterlogging in MXD production when analysing tree-ring data of riparian trees.
1
Introduction
Dendrochronology is one of the most common methods for obtaining the late Holocene reconstructions of past climate variability because tree-ring chronologies are high-resolution indicators of exactly dated paleoclimate information (Fritts, 1976). Moreover, tree-ring chronologies around the extratropical Northern Hemisphere contain clear climatic signals of summer temperatures (Briffa et al., 2002). This dendroclimatic association is notably high for different tree species growing near their polar and alpine range of distribution. Yet the strength of this dendroclimatic response depends on the measured tree-ring parameter. While the use of treering width chronologies as indicators of past climate variability has a long tradition in dendroclimatology, the development of X-ray-based estimates of wood density fluctuations (Schweingruber et al., 1978) has increased the value of dendrochronology as an integral part of paleoclimatology.
Published by Copernicus Publications on behalf of the European Geosciences Union.
1474
V. V. Matskovsky and S. Helama: Testing summer temperature reconstruction
Several studies have shown that the measurements of maximum latewood densities (MXD) yield chronologies with an improved climatic signal (Briffa et al., 2002). Consequently, the MXD chronologies from several regions around Eurasia and North America have been used for summer temperature reconstructions (Hughes et al., 1984; Davi et al., 2003; Luckman and Wilson, 2005; Büntgen et al., 2008). Similar studies have been conducted in northern Fennoscandia where a few reconstructions of summer temperatures (JJA) over the Common Era have been based on MXD records of living and subfossil pines (Briffa et al., 1988, 1990, 1992, 1996; Briffa and Schweingruber, 1992; Grudd, 2008; Büntgen et al., 2011; Esper et al., 2012; McCarroll et al., 2013; Melvin et al., 2013). While the early studies concentrated on materials from northernmost Sweden, particularly the Torneträsk region (Schweingruber et al., 1988; Briffa et al., 1990, 1992, 1996; Grudd, 2008), the tree-ring materials from northern Finland (Eronen et al., 2002) have recently been exploited for MXD analyses. These materials have notably increased the available MXD sample size and temporally extended the chronology for the region to 138 BC (Büntgen et al., 2011; Esper et al., 2012). In a recent dendroclimatic analysis Melvin et al. (2013) used updated and adjusted subfossil (Schweingruber et al., 1988) and living-tree (Grudd, 2008) MXD data from Torneträsk. A brief literature review exemplifies several inconsistencies in the published palaeoclimate records. While the first of these reconstructions (Briffa et al., 1992) strove to define the degree of the 20th-century warmth in the context of the last 1500 yr, the subsequent study (Grudd, 2008) demonstrated a positive temperature anomaly of about 0.7–1.5◦ C (30 yr mean) for the Medieval Warm Period (MWP) relative to the 20th-century conditions (1951–1970 mean). It also showed a cooling phase (up to 1.1 ◦ C negative anomaly for 30 yr mean) for the Little Ice Age (LIA). However, Büntgen et al. (2011) did not find evidence for a cool period during the LIA interval. Esper et al. (2012) stated that the previously estimated warmth of the MWP may be notably underestimated. Another detailed dendroclimatic analysis (Melvin et al., 2013) presented MWP temperatures at a level similar to the modern ones in the region suggesting an overestimation of the medieval warmth published by Grudd (2008). Melvin et al. (2013) showed that the Grudd (2008) study contained systematic bias and should not be considered suitable for use as a climate reconstruction. The results of McCarroll et al. (2013) suggested that the 20th and 17th centuries were warmest and coldest in the region, while similarly warm spells were experienced during the 11th century. While the post-1700 inconsistencies in a part of the MXD data (Briffa et al., 1992; Grudd, 2008) have been clarified (Melvin et al., 2013), the two data sets (Melvin et al., 2013; Esper et al., 2012) have not been analysed collectively to reconstruct an MXD-based long-term temperature variability over the whole of northern Fennoscandia. This situation is even more unsatisfactory, if not worrisome, considering the Clim. Past, 10, 1473–1487, 2014
important role of the particular MXD data in several hemispheric and frequently cited paleoclimate reconstructions of the Common Era (e.g. Jones et al., 1998; Esper et al., 2002; Osborn and Briffa, 2006; Mann et al., 2009; Ljungqvist et al., 2012). We assume that the climate variability within the region is likely too uniform to have caused the reported deviations in the published temperature reconstructions from adjacent regions of northernmost Sweden (Torneträsk) and Finland. Instead, the reasons for these deviations may more realistically stem from the tree-ring standardization and microdensitometric methods, as well as non-climatic noise inherent to the variations in available samples and their site characteristics. A problem associated with the dendroclimatic improvement, consisting of the development from the tradition of simply registering the widths of the rings to the more sophisticated MXD, is the complexity of methods required to produce the high-resolution wood density profiles. As a pitfall, even marginal changes in the microdensitometry methods may produce significantly altered MXD data (Helama et al., 2010d, 2012). Tree-ring standardization is a necessary process where the initial measurement series are transformed into dimensionless indices to remove the biological (i.e. nonclimatic) growth variations prior to dendroclimatic interpretations (Fritts, 1976). Different standardization methods produce chronologies with deviating characteristics, and particularly the long-term (i.e. low-frequency) estimation of dendroclimatic signals is sensitive to the applied method (Briffa et al., 1992; Esper et al., 2002; Helama et al., 2004). Indeed, the recent reanalysis of the Torneträsk MXD data detailed a set of estimation biases originating from changes in the microdensitometry practices and tree-ring standardization (Melvin et al., 2013). It is essential to note that all the discussed studies used the same type of standardization method, the regional curve standardization (RCS; Briffa et al., 1992), to produce the MXD chronologies as a proxy for temperature reconstructions, but selected different options which might explain differences between the resulting chronologies. While this particular method is capable of producing chronologies with preserved low-frequency variations (Briffa et al., 1992; Esper et al., 2002; Helama et al., 2004), it is also more sensitive to data heterogeneity and therefore requires higher sample replication than other commonly applied standardization methods (Briffa and Melvin, 2011). Moreover, recent years have seen a diversification of the original RCS method, with development of its signal-free implementation (Melvin and Briffa, 2008) and its subsequent correction (Matskovsky, 2011), as well as multiple curve approaches of RCS (Helama et al., 2005b; Nicault et al., 2010; Melvin et al., 2013). The recent versions of the Torneträsk and Fennoscandian chronologies have used the RCS along with its variations (Esper et al., 2012; McCarroll et al., 2013; Melvin et al., 2013) but so far no systematic study exists to present the construction of the resulting MXD chronologies using consistent tree-ring standardization. www.clim-past.net/10/1473/2014/
V. V. Matskovsky and S. Helama: Testing summer temperature reconstruction
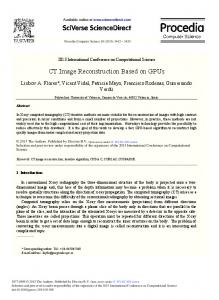
Figure 1. Subfossil and living-pine sites location for FENN and TORN data sets.
Here we reanalyse and compare two MXD data sets from Torneträsk (Melvin et al., 2013) and from a larger region of Fennoscandia (Esper et al., 2012) using different standardization methods. MXD variations in the data were identified in detail and the same types of RCS method were applied to both data sets. We calibrate standardized MXD data to instrumental JJA temperatures of the Tornedalen climate record located in northern Sweden and covering the last 200 yr (Klingbjer and Moberg, 2003). Then we continue to reconstruct regional summer temperature in the Common Era.
2 2.1
Materials and methods Geographical setting
This study is based on X-ray-based microdensitometric data of modern and subfossil Scots pine (Pinus sylvestris L.) tree rings. We use published and online archived MXD data from northernmost Sweden (i.e. Torneträsk region) and northern Fennoscandia. These data sets are referred to as TORN (Schweingruber et al., 1988; Grudd, 2008; Melvin et al., 2013) and FENN (originally named N-Scan; Esper et al., 2012). Originally, the collection of the TORN material was carried out in five individual sites around Lake Tornesträsk (68.17–68.33◦ N, 19.75–20.75◦ E; 400–470 m a.s.l.; Fig. 1). Three of these localities provided subfossil tree rings for extending the chronology back in time to AD 436 (Bartholin and Karlén, 1983; Bartholin, 1987). The MXD chronology for TORN was produced by Schweingruber et al. (1988) and updated with more recent material of living trees by www.clim-past.net/10/1473/2014/
1475
Grudd (2008) and Melvin et al. (2013). The TORN data now cover the period AD 441–2010 and can be downloaded via http://www.cru.uea.ac.uk/cru/papers/melvin2012holocene/. The subfossil FENN material of Eronen et al. (2002) originates from the region of northern Finland. A portion of this material, covering roughly the past two millennia (since 138 BC) was later used to build a new MXD chronology for the region (66.80–69.50◦ N, 23.00–29.00◦ E; 190– 340 m a.s.l.; Fig. 1). The subfossil material was updated with living-tree material from north-west Finnish Lapland and northernmost Sweden (Esper et al., 2012). In actual fact, one of the living-tree sites included in the FENN data set is from the Torneträsk region. As a result, the modern part of the FENN data set is weighted towards the west, while the eastern half of region is represented only by subfossil sites. Moreover, two of the three living-tree sites (67.90◦ N, 20.10◦ E; 68.20◦ N, 19.80◦ E) are far outside the network of subfossil sites. The FENN data can be downloaded via http://www.blogs.uni-mainz.de/fb09climatology/ files/2012/03/Data.pdf. For subsequent analyses FENN data were transformed into “mean tree” series, i.e. multiple measurements for each tree were averaged into one series. This was done to avoid artificial reduction of error margins and to bring the two data sets into correspondence. 2.2
Sampling sites
The tree-ring material originates from four different types of sampling sites: modern samples of living pines representing dry (inland) environments and lake riparian habitats, subfossil samples preserved in subaerial conditions and subfossils preserved in lacustrine sediments. It is notable that the subfossil material of the TORN data set originates merely from subaerial conditions (Bartholin and Karlén, 1983; Schweingruber et al., 1988). In other words, there is no subfossil material from lacustrine sediments included in the Swedish MXD data (Grudd, 2008). On the other hand, the FENN assemblage consists of subfossil samples collected at lakes only (Eronen et al., 2002). The modern part of FENN MXD data (from living trees) was produced by using tree-ring samples from only lake riparian sites (Esper et al., 2012).Thus, the principal difference between the TORN and FENN data sets stems from the studied habitat: the TORN data include dry sites whereas the FENN data are represented by lake shore environments. 2.3
Microdensitometry
X-ray-based microdensitometry produces radial wood density profiles for each tree-ring sample. Each ring exhibits an annual density cycle where the wood of low density is formed during the early growing season (i.e. earlywood), with increasingly high densities towards the late summer and autumn (i.e. latewood). The intra-annual point where the density reaches its highest value is taken as the maximum density Clim. Past, 10, 1473–1487, 2014
1476
V. V. Matskovsky and S. Helama: Testing summer temperature reconstruction
(MXD) of that ring. The consecutive MXD values of each sample represent the individual MXD series. These series are of special interest in dendroclimatology because of their strong correlations with growing season temperatures as observed broadly across the circumpolar boreal forests today (Briffa et al., 2002). Commonly, living trees are cored at breast height, and the increment cores exposed for microdensitometric analyses. Subfossil pinewood material can either be found lying on dry ground or preserved in the sediment of small lakes. In the field, the unearthed logs are sawn into disks. Subsequently, in the workshop, radial laths are sawn perpendicular to the ring boundaries to be analysed using microdensitometry. It is important to note that even slight differences in the laboratory protocol during the X-ray process may profoundly alter the resulting MXD data (Grudd, 2008; Helama et al., 2010d, 2012). MXD data may become altered depending on the methods that are used to remove the wood extractives (organic, non-cell-wall components) prior to analyses (Helama et al., 2010d), the wood moisture content during the measurement (Helama et al., 2012) and the radial step size of the density scanning (Grudd, 2008; Helama et al., 2012). The two MXD data sets analysed here (TORN and FENN) were produced using different X-ray methods and data analysis. The TORN data set consists of data produced in different decades and laboratories (Grudd, 2008; Melvin et al., 2013). It has been shown for TORN data that the old MXD values (Schweingruber et al., 1988) exhibit lower standard deviation of density variability than the MXD values produced using the evolved technical property of the X-ray scanner (Grudd, 2008). In order to deal with this bias, Grudd (2008) reduced the variance in new MXD data to match with the old variance. More recently, Melvin et al. (2013) added more data to the TORN data set. These data were produced in a different laboratory. Comparisons with the differently produced MXD data showed a need for additional adjustments for mean and standard deviation of the data because of the different laboratory protocols (Melvin et al., 2013). In this study, we are using these adjusted TORN data (S88G1112A.mxd data from http://www.cru.uea.ac.uk/cru/papers/melvin2012holocene/). 2.4 2.4.1
Standardization methods Regional curve standardization
Our analyses are based on regional curve standardization (RCS) (Briffa et al., 1992, 1996; Briffa and Melvin, 2011) with the signal-free implementation (Melvin and Briffa, 2008; Briffa and Melvin, 2011) and RCS with a proposed correction (Matskovsky, 2011). In the original RCS technique presented by Briffa et al. (1992), the same standardization curve is used to detrend each series of tree-ring measurements. The standardization curve is assumed to display regionally representative cambial (that is, biological and thus non-climatic) trends in the total tree-ring variability (Briffa Clim. Past, 10, 1473–1487, 2014
et al., 1992, 1996). Therefore, this trend can be derived as a single mean curve of the data aligned according to their cambial ages. The process of averaging the series reveals treering variations related to ageing and the expected age-related component can be detected as the mean curve. As is typical for the conventional RCS method, this curve is assumed to be not affected by climate. Subsequent to averaging, the mean curve is commonly smoothed to reduce the effect of random fluctuations. Time-varying response smoothing (TVRS; Melvin et al., 2007) with the routine of Melvin et al. (2007; see their Appendix A) was used where SSY (spline stiffness for each year) equalled the cambial age in years plus 15 yr. We used a cubic spline with 50 % variance cut-off (Cook and Peters, 1981) on the frequency period of SSY years. Using this method, the RCS is carried out with a single regional curve (referred hereafter as RC1) to standardize all tree-ring series and the tree-ring indices are derived as ratios between the observed tree-ring value and the value expected by the RC1. This process is expected to remove a large portion of age-related variations presented in the initial series of measurements. Parts of each tree-ring series contributing to the regional curve over the weakly replicated old cambial ages (with replication less than 10) were removed before using the RCS method. 2.4.2
Signal-free approach
The conventional RCS method can be combined with the signal-free (SF) approach (thus, RC1SF) as suggested by Briffa and Melvin (2011) and as already applied in several studies (Helama et al. 2010b; Björklund et al., 2013; Melvin et al., 2013; Cooper et al., 2013; Wilson et al., 2013). In contrast with conventional RCS, this method assumes that the estimate of the standardization curve as just an average of all available series is biased by climate because the initial treering series themselves contain a significant climatic component. Thereby the mean curve may retain a large proportion of climatic influence, which becomes effectively removed from tree-ring indices because the growth component represented by the curve is removed from the initial series. As an alternative, a more non-climatic mean curve could be produced from signal-free measurements whose climatic signal is removed prior to estimation of the standardization curve. Following Melvin and Briffa (2008), the removal of the climatic variations is done through a process where the initial tree-ring measurements, aligned by their calendar years, are first divided by the index values of the conventional RCS chronology. The resulting SF measurements are averaged, aligned by their cambial years, following the typical RC1 procedure (see above). The new mean curve is then removed from the initial tree-ring measurements to produce SF indices and a new (RC1SF) chronology. The process is repeated until no improvement in chronology estimation is achieved (see Melvin and Briffa, 2008, 2013 for details).
www.clim-past.net/10/1473/2014/
V. V. Matskovsky and S. Helama: Testing summer temperature reconstruction 2.4.3
Correction procedure
An improvement of the chronology estimation, subsequent to RCS and SF methods, was previously attained by applying a correction (C) method (thus, RC1SFC; Matskovsky, 2011). This method, RC1SFC, is a novel application of the RCS and SF methods, tailored for detection of a pure low-frequency signal in tree-ring chronologies. The error in RC1SF chronology is assessed and subsequently extracted from the data in order to produce an RC1SFC chronology. For our purposes tree growth can be thought of as a product of climatic and non-climatic components. When averaging non-climatic components from different samples (trees) we get non-climatic components in the chronology. These types of chronology variations originate from the nonuniform distribution of individual series in time and uncommon individual tree growth peculiarities and depend on the data set properties; thus the error associated with these variations is denoted as “data set error”. In practice it is difficult to obtain an ideal data set without such inhomogeneities. SF and “correction” are used to remove this non-climatic component from the chronology, focusing on different frequencies. SF deals only with high frequencies. “Correction” is designed to deal with lower frequencies. The correction procedure consists of three steps: (1) building a chronology from smoothed SF measurements (or SF curves – initial series of measurements without climatic signal and high-frequency variations): this chronology represents the data set error; and (2) subtracting this error from the initial chronology, thus correcting it. See the detailed algorithm of the correction procedure in the Supplement. 2.4.4
Multiple-RCS method
Our fourth type of standardization method utilizes multiple RCS curves (instead of a single curve used in the RC1, RC1SF and RC1SFC methods) to remove the non-climatic variations (Briffa and Melvin, 2011; Melvin et al., 2013). Following the previous suggestions (Melvin et al., 2013), we used two regional curves that were built using the SF routine (thus, RC2SF) and RC2SF with Matskovsky’s (2011) correction (thus, RC2SFC). The process of defining the multiple RCS curves began with calculating the mean of SF measurements for the cambial ages 1–100 yr for each tree. These values were divided by the mean of the first 100 yr of a single RC1SF curve (created using all trees) to yield relative growth rate (sensu Briffa and Melvin, 2011) for MXD production of each tree. All trees were arranged by this relative growth rate and the full set of trees was accordingly divided into two equally large groups (in practice, one group was larger by one tree if the total number of series in that chronology was odd). The regional curve was produced for each group for detrending each MXD series in the corresponding group. Here again we truncated all the series of tree-ring measurements to achieve replication of at least 10 samples for every regional www.clim-past.net/10/1473/2014/
1477
curve value and TVRS spline was used for smoothing of regional curve. Comparisons between the chronologies were carried out only for the parts of chronologies with replication of at least six series. Therefore, the common period was limited by replication of TORN data set and was set to AD 542–2006. 2.5
Design of experiments
Five types of standardization methods were used for comparison under the assumptions that TORN and FENN data sets are proxies for mean summer temperature (JJA) and that temperature is spatially homogenous for the whole region. Correlation between the JJA temperatures (AD 1959–2007) as observed at Abisko and Sodankylä meteorological stations is 0.83. Under these assumptions, improved correlation between any pair of differently standardized TORN and FENN chronologies demonstrates a higher common (i.e. temperature) signal. We compared five types of chronologies (RCS, RC1SF, RC1SFC, RC2SF and RC2SFC) for TORN and FENN data sets and also used low-pass filtered chronologies with N-year smoothing splines (Cook and Peters, 1981) to focus on lowfrequency signals (N = 50, 100, 200 and 300 yr). Detailed comparison of low-frequency signals between the TORN and FENN data sets was carried out using their RC2SFC chronologies. We also used subsampled FENN data because of their higher replication. Subsampling was supposed to highlight any difference arising in the FENN data set when artificially reduced to the sample depth of the TORN data set. For details of the subsampling algorithm see the Supplement. 2.6
Temperature reconstruction methods
While the FENN data set benefits from its greater sample size and replication over the common period (since ca. AD 700), the benefits of TORN data lie in their homogeneity and their stronger correlation to temperature. Both materials have their benefits and following their high overall correlativity, it was justifiable to combine the data into an enhanced MXDbased paleoclimate reconstruction. The use of a combined data set could be seen to benefit from several other circumstances (see McCarroll et al., 2013). Including a higher number of sites produces a mean series that is stronger and yields an uncertainty estimate that incorporates the information of changes in both data sets over time. This approach also reduces the effects of ecological or cultural (i.e. non-climatic) disturbance events in the chronology. Combining the data from sites over a larger area also produces a reconstruction that is representative of the climate of the extended area (McCarroll et al., 2013). The temperature reconstruction was produced from a combination of TORN and FENN data sets (called FULL data set). The FULL data set includes 430 series and covers the period 216 BC–AD 2010 (8 BC–AD 2010 with replication of more than five series). The combined Clim. Past, 10, 1473–1487, 2014
1478
V. V. Matskovsky and S. Helama: Testing summer temperature reconstruction
data set has expressed population signal (EPS; Wigley et al., 1984) values consistently larger than 0.85 after AD 535, more than for the TORN and FENN data sets individually. We used AD 1802–2010 as the common period for comparisons between the MXD proxy and instrumental data (Klingbjer and Moberg, 2003). It is notable that the instrumental record used here was corrected for inhomogeneities (Klingbjer and Moberg, 2003, as cited in the text). Moreover, a recent study (Helama et al., 2013) did not show increasing inhomogeneities in the 19th-century part of this record, in comparison to the 20th-century part. The data for the year AD 1815 (with missing instrumental data) were excluded from all the dendroclimatic comparisons. The common period of instrumental and MXD data was divided into two periods (AD 1802–1905 and AD 1906–2010) to be used as calibration and verification periods and vice versa for producing a JJA temperature reconstruction from the FULL-RC2SFC MXD chronology. We used the following commonly used statistics to assess the quality of the reconstruction: Pearson correlation coefficient (r), coefficient of determination (R 2 ), reduction of error (RE), coefficient of efficiency (CE) and root mean square error (RMSE) (Cook et al., 1994). The statistics of R 2 , r and RMSE were calculated for calibration, verification and common (1802–2010) period with instrumental data (note that CE is actually R 2 for verification period). MXD-based JJA temperatures were reconstructed using non-smoothed and smoothed variance adjustment and linear regression methods (Lee et al., 2007, details in the Supplement). 2.7
Uncertainty estimates for the reconstruction
The uncertainties of the reconstruction arising from three independent sources were estimated as follows: 1. The uncertainty of replication by the regional curve (RC): this type of uncertainty arises from the RC replication uncertainty that generally increases towards higher cambial ages. This uncertainty will affect the uncertainty of every MXD index, depending on its cambial age. Since we used two RCs, this type of uncertainty is also dependant on the RCs we used and hence on the mean MXD for the first 100 yr. 2. The uncertainty of replication by the mean chronology: this uncertainty provides the confidence interval of the average of all MXD indices for each calendar year (taking into account the uncertainty 1) 3. The uncertainty from calibration: the uncertainty accounts for the uncertainty of mean and variance (as we use mean and variance adjustment reconstruction technique) in the calibration period (taking into account uncertainties 1 and 2). As the three types of uncertainties are assumed to be independent, the uncertainty that arises from each source can be deClim. Past, 10, 1473–1487, 2014
Figure 2. Sample replication for FENN and TORN full data sets, denser and less dense cohorts (trees with higher and lower average MXD values for the first 100 yr) (a) and ratios between replications of denser and less dense cohorts for TORN and FENN data sets (b).
rived by subtracting previous uncertainties on the same confidence level. For this reason, the results in Fig. 7 show relative values of all the three uncertainties. For details of uncertainty estimation, see the Supplement. 3 3.1
Results Sample size replication
The FENN data set contains 1.5–3 times more samples than the TORN data set through most of the common period (Fig. 2a). The replication of TORN chronology remains below 20 samples over the subfossil period. The sample size variation over the past 200 yr is explained by the high number of core samples from living trees during this period. Over the 20th century, the absolute increase of young pines is higher for FENN data in comparison to TORN data (Fig. 2a). TORN and FENN full sample sets were split into trees with dense (“trees with good growth”) and less dense (“trees with poor growth”) MXD values. There seem to be almost equal amounts of trees growing well and poorly growing trees throughout the study period (Fig. 2). The visual inspection shows that the ratios between the number of denser and less dense tree samples do not correlate in the FENN and TORN data sets (r = 0.08; Fig. 2b). Since the data sets originate from nearby regions, the described asynchrony indicates that the examined growth component (relative growth rate) is not related to low-frequency climate variability. Therefore we assume that this finding supports the use of multiple RCS that will remove this growth component from the resulting chronology.
www.clim-past.net/10/1473/2014/
V. V. Matskovsky and S. Helama: Testing summer temperature reconstruction
Figure 3. Regional curves (a) and chronologies (b) for TORN, FENN and FULL data sets and different types of standardization. All the chronologies are smoothed with 100 yr splines. Variance and mean standardized to the period AD 1802–2006, 15 yr smoothed data are used for variance adjustment. S88G1112A (Melvin et al., 2013) and N-SCAN (Esper et al., 2012) are original chronologies for the TORN and FENN data sets, respectively.
3.2
MXD chronologies
Subsequently, the initial MXD values were transformed into RC1, RC1SF, RC1SFC, RS2SF and RS2SFC indices using the corresponding regional curves (Fig. 3a) and averaged into a corresponding set of mean MXD chronologies (Fig. 3b). The correlations between the differently standardized chronologies decline towards lower frequencies of growth variability (Supplement Table S1). On average, the non-smoothed chronologies agree with a mean correlation coefficient of r = 0.66, whereas the 50 yr, 100 yr, 200 yr and 300 yr smoothing results in mean correlation coefficients of r = 0.54, r = 0.49, r = 0.46 and r = 0.49, respectively. The observed tendency of lower correlativity at lower frequencies indicates the increasing uncertainties in estimating particularly the long-term temperature variations by MXD proxy data. Invariably, the highest correlations between the chronologies of the same standardization method were those obtained by RC1SFC procedure (Supplement Table S1), that is, using a single regional curve both with signal-free and Matskovsky’s (2011) correction implementations. This result becomes even more obvious for correlations calcuwww.clim-past.net/10/1473/2014/
1479
lated at lowest frequencies (Supplement Table S1). It becomes evident that the applied Matskovsky’s (2011) correction (C) subsequent to SF implementation improves the actual SF estimation, and in particular the estimation of the low-frequency tree-ring variations, as already suggested in the original methodological study (Matskovsky, 2011). Applying multiple-RCS technique (RC2SF and RC2SFC) produces an improvement in FENN chronologies, but not in TORN chronologies. This may be, at least in part, owing to a smaller sample size of the TORN data set that may not be sufficient for robust estimation of multiple RCs. This may be the reason for highest correlations obtained between TORNRC1SFC and FENN-RC2SFC on varying timescales (Supplement Table S1). Differently produced FENN and TORN chronologies show consistent but also bifurcating dendroclimatic signals (Fig. 3b). Apart from many common features with synchronously ameliorated and deteriorated growth periods, it is found that the FENN chronologies exhibit notably higher growth prior to AD 900 and during the 17th century. Regardless of the standardization method, the TORN chronologies indicate higher growth during the recent decades and a trend increasing towards the present day (Fig. 3b). Since the TORN data set is characterized by lower sample replication through the common period (Fig. 2a), an experiment was performed to test whether the observed growth bifurcations (Fig. 3b) could be explained by this property. The FENN data set was randomly subsampled to mimic the TORN replication (Fig. 4a). We found that the difference in sample replication between the two data sets was not likely a reason for the deviating MXD fluctuations in FENN and TORN for the above-mentioned periods (Fig. 4b). The low-frequency fluctuations could be detailed in the context of oscillatory modes dominating the multi-decadal to centennial MXD variations of FENN and TORN data (Fig. 5). Both chronologies showed nearly identical 54–56 yr and 67–70 yr periodicities, as well as precisely identical 113 and 133 periodicities. However, the TORN chronology was also characterized by the 33 yr, 244 yr and 488 yr periodicities, whereas the FENN chronology exhibited an additional sub-centennial oscillation of 86 yr periodicity (Fig. 5). 3.3
Climate-proxy comparisons
Comparisons between the chronologies and instrumental climate records demonstrate that both chronologies correlate with summer temperatures with a range of coefficients r = 0.76−0.79 (Table S2). At low frequencies, however, the correlations are higher when using TORN chronologies than with FENN chronologies (r = 0.95 and r = 0.84, respectively). This is not an issue of standardization method since the dendroclimatic correlations are invariably higher in the case of TORN, regardless of the method used (Table S2). Rather, the FENN chronologies show warming during the period 1802–1815 when the TORN and instrumental data Clim. Past, 10, 1473–1487, 2014
1480
V. V. Matskovsky and S. Helama: Testing summer temperature reconstruction
Figure 4. Replication of TORN, FENN and subsampled FENN data sets (a) and comparison of RC2SFC chronologies for different data sets (b). Red shading shows the area between 2.5th and 97.5th percentiles for FENN subsampled data sets. Vertical red line shows threshold for well-replicated data sets (more than five series). All series smoothed with 100 yr splines. Variance and mean standardized to the period AD 1802–2006; 15 yr smoothed data are used for variance adjustment.
indicate cooling (Fig. 6). Moreover, the FENN chronologies underestimate temperature around 1900 and since the 1950s. In addition, normalized FENN chronologies show inflated values relative to TORN and instrumental record z-scores during the early-20th-century warming that occurred in the region in the course of the 1920s and 1930s (Fig. 6). The FULL chronologies’ correlations with instrumental temperatures reach 0.8 after multiple RCs and signal-free implementation (Table S2). Here, the FULL-RC2SFC chronology was used for reconstructing the JJA temperature because successive implementation of multiple RCS and signal-free and Matskovsky’s (2011) correction routines leads to removal of high- and low-frequency non-climatic signals from tree-ring chronology (Sect. 2.4) and because it was indicated (Sect. 3.2, Supplement Table S1) that correction procedure improves proxy quality on longer timescales. 3.4
Summer temperature reconstruction
Our new temperature reconstruction is shown with three separate types of uncertainties since 216 BC (Fig. 7). EPS is usually used as a theoretical limit for extension of reconstruction Clim. Past, 10, 1473–1487, 2014
Figure 5. TORN-RC1SFC (a) and FENN-RC2SFC (b) spectrum. Red line shows power spectrum of red noise with lag 1 autocorrelation estimated from the series. Period: AD 542–2006.
into the past. For the FULL data set EPS is consistently larger than 0.85 only after AD 535. We don’t restrict our reconstruction to this year because the uncertainty estimates provided could be used for the same purpose more reasonably. Clearly, the uncertainties arising from MXD data are considerably narrower than the climate-proxy calibration uncertainty (uncertainty 3), especially over the past thirteen centuries. Over the earlier times, the uncertainties of the MXD data increase, consistently with the decrease in the sample replication (Fig. 2a). At low frequencies, the Common Era of the reconstruction is governed by the warm climatic phases culminating in the 10th and 20th centuries. The peak temperatures during these periods are comparable with each other, whereas the warmth of the 1st century BC shows slightly higher temperatures. Nevertheless, the temporal length of the medieval warmth from the 8th to 11th centuries overshadows the other warm periods. The coolest climatic phases prevailed during the 6th and 7th, as well as the 13th through 19th centuries, the latter overlapping with the timing of the Little Ice Age. The warmest and coolest 30 yr periods occurred AD 27–56 and AD 536–565, respectively, when JJA temperatures averaged 15 and 12.8 ◦ C, translating into maximal multi-decadal temperature amplitude of 2.2 ◦ C. The reconstruction exhibits periodic oscillations on distinctly multi-decadal (55 to 66 yr), centennial (86 to 128 yr), multi-centennial (171 to 513 yr) and millennial (1027 yr) timescales (Fig. 8).
www.clim-past.net/10/1473/2014/
V. V. Matskovsky and S. Helama: Testing summer temperature reconstruction
1481
MXD fluctuations between the chronologies are not driven by spatial anomalies in regional climate. Indeed, one conflicting result was identified for the late 20th century when both data sets contain tree-ring materials from living trees of the same (Torneträsk) region and thus for the period of supposedly enhanced homogeneity of provenance. Instead of climate, there are six likely sources of heterogeneity: (i) data quantity, (ii) biogeographical differences in source materials, (iii) varying microdensitometric and (iv) tree-ring standardization methods, (v) cambial age structure of the chronology and (vi) habitat of riparian and inland pines. 4.1.1
Figure 6. TORN, FENN and FULL chronologies with Tornedalen JJA temperatures (a) and residuals of the chronologies from Tornedalen JJA temperatures (b). Variance and mean adjusted to AD 1802–2006 using 15 yr smoothed data. All the data smoothed with 50 yr splines. S88G1112A (Melvin et al., 2013) and N-SCAN (Esper et al., 2012) are original chronologies for the TORN and FENN data sets, respectively.
4 4.1
Discussion Comparison of data sets
Focusing on low-frequency fluctuations, the TORN (Schweingruber et al., 1988; Grudd, 2008; Melvin et al., 2013) and FENN (Esper et al., 2012) data sets show several common anomalies of synchronously high and low MXD values, as well as several common periodicities. Despite high correlation with summer temperatures and overlapping provenance of the original tree-ring material, the MXD data do not show fully consistent growth variations throughout the study period. The most obvious periods with the bifurcating dendroclimatic fluctuations occurred in the 7th, 9th, 17th and 20th centuries (Fig. 3b). Yet, the results from spectral analysis indicate disparate dendroclimatic signals in the form of significant oscillatory modes (Fig. 5). It is reasonable to argue that these dissociations likely represent MXD variations not closely related to the regional climatic signal. Therefore, before interpreting the obtained paleoclimate information on the summer temperatures, it may be useful to discuss a. Samples for the two chronologies originate from adjacent and partially overlapping geographical settings in northern Fennoscandia and we suggest that results showing diverging www.clim-past.net/10/1473/2014/
Data quantity
Data quantity is a factor that distinctly divides the original tree-ring materials according to chronologies with high (FENN) and low (TORN) replications (Fig. 2a). The sample replication and the law of large numbers should not be overlooked in the course of any dendrochronological procedure (Fritts and Swetnam, 1989). Moreover, it may be generally comfortable to rely on massive sample replication in dendrochronology (Büntgen et al., 2012). Even so, an increasing sample replication may not necessarily remove the systematic effects if present in the data. Subsampling of the more deeply replicated data set (FENN) revealed, however, that the diverging MXD fluctuations could not be reproduced by randomly reducing the quantity of that data set (Fig. 4b). Thus, we argue that the data quantity may not be a primary factor producing the differences as observed between the TORN and FENN chronologies. 4.1.2
Biogeographical aspects
The primary difference between the TORN and FENN data sets stems from their spatial characteristics (Fig. 1). While the TORN was collected from a restricted locality of Torneträsk in northernmost Sweden (Bartholin and Karlén, 1983; Schweingruber et al., 1988; Grudd, 2008), the subfossil sampling sites of FENN are spread over northern Finnish Lapland (Eronen et al., 2002). Two of the three modern FENN sites are located in northern Sweden, including Torneträsk (Esper et al., 2012). Despite this proximity of the modern sampling sites in the two collections, the two chronologies in fact diverged intriguingly after AD 1950 with notably higher growth observed for the TORN chronologies (Fig. 6). Since the tree-ring material of FENN and TORN for this period comes from neighbouring sites, it cannot be the biogeographical aspects which play a crucial role in the observed divergence. It is interesting, however, that the preceding periods of divergence (during the 7th, 9th and 17th centuries) showed an opposed mismatch (in respect of the 20th century) where the FENN chronologies come with higher growth. In a biogeographical context, the MXD may not be insensitive to stand density variations, as shown by thinning experiments. These studies indicate that Clim. Past, 10, 1473–1487, 2014
1482
V. V. Matskovsky and S. Helama: Testing summer temperature reconstruction
Figure 7. Reconstruction of JJA temperatures with 95 % uncertainty intervals. See text for details. Values are smoothed with 100 yr splines.
the P. sylvestris latewood density (pertaining to MXD) increases substantially following stand thinning (Peltola et al., 2007). Likewise, it is known that the studied sites have experienced major changes in their natural stand densities over the past millennia with highest overall stand density during the MWP (Helama et al., 2005a, 2010a). Thus, past fluctuations in stand density may at least hypothetically explain the diverging MXD chronologies. 4.1.3
Microdensitometry
Varying microdensitometric methods have previously been shown to produce significantly altered MXD data (Helama et al., 2010d, 2012). Indeed, the initial materials of the two data sets were produced in different laboratories and over the course of a quarter of a century. Grudd (2008) described this development in the context of the X-ray microdensitometry sensor width. In particular, the sophistication of the device results in data with higher MXD standard deviations (Grudd, 2008). The variance of the new data was adjusted to expected variance by the old data (Grudd, 2008) and here we have used similarly rescaled (Melvin et al., 2013) MXD data only. Although such adjustment of the initial data is a logical approach to solving the problem of differently produced MXD data, the issue may be too complex to be surmounted by linear scaling of the initial data. A change in laboratory measurement protocol may change the amplitude (as measured by standard deviation) and the autocorrelation of the MXD series (Helama et al., 2010d, 2012). Rescaling of tree-ring series with dissimilar autocorrelation structures may distort their low-frequency band of variations in particular (Helama et al., 2009a). The calibration of the differently produced MXD data may introduce, at least hypothetically, additional levels of uncertainty for the MXD values. 4.1.4
Tree-ring standardization
Tree-ring standardization is sometimes, mistakenly, taken as an obstacle for deriving low-frequency climate information Clim. Past, 10, 1473–1487, 2014
Figure 8. Fourier analysis for the JJA temperature reconstruction. Red line shows power spectrum of red noise with lag 1 autocorrelation estimated from the series. Period: 8 BC–AD 2010.
from tree-ring proxies. In reality, however, the standardization is fully necessary for the isolation of low-frequency climate information in this proxy. Many standardization methods are indeed incapable of retaining the long-term and period growth variations (Cook et al., 1995). As a consequence, tree rings have even become notoriously poor indicators of low-frequency climate variability for a wider readership (e.g. Broecker, 2001), particularly for those not familiar with background and techniques. In fact, tree-ring chronologies are one of the few proxies for which sensible estimates of their skill at indicating “long timescale” variance can be calculated. In recent decades the standardization has however undergone a methodological development. Several methods (Helama et al., 2005b; Nicault et al., 2010; Briffa and Melvin, 2011; Matskovsky, 2011; Melvin et al., 2013) have evolved from the simple RCS method (Briffa et al., 1992) for improved low-frequency preservation. Interestingly, the RCS method was applied in the study region for P. sylvestris treering data as early as the 1930s (Erlandsson, 1936) whereas the subsequent studies have used data of the same species and region for systematic comparisons between RCS and other methods of standardization (Briffa et al., 1992, 1996; Cook and Briffa, 1990; Helama et al., 2004). In the same context, Esper et al. (2012) showed that if such growth properties underlie the initial data, the RCS may preserve even multimillennial long-term trends in the resulting MXD chronologies. Similarly, our results indicate that the preservation of the low-frequency variations is not an issue that could have caused the observed differences between TORN and FENN chronologies. This statement is in accordance with the results showing evidence for similar divergences between the chronologies regardless of the varying (RCS) standardization method (Fig. 3b). That is, the 7th-, 9th-, 17th- and 20thcentury bifurcations remain as the most notable differences between the TORN and FENN chronologies. In the context of standardization, our results provided several other new implications. Regarding the correction procedure, it was found that the dendroclimatic correlations www.clim-past.net/10/1473/2014/
V. V. Matskovsky and S. Helama: Testing summer temperature reconstruction of FENN-RC1SFC were notably higher in comparison to FENN-RC1SF. That is, the correction procedure improved the value of that MXD data set as a summer temperature proxy. This improvement likely arises from the very nonuniform age structure of the same data set over the last two centuries, with an increase of young trees (younger than 100 yr). It is likely that the correction procedure may have significantly reduced the “data set error” due to an uneven age distribution over the period of AD 1950–1990 (see Fig. 6). Nevertheless, the correction procedure may not always improve the proxy on short timescales, as could be implied for the instrumental period (Table S2). In fact, the correction procedure was designed for amplification of the low-frequency climate signal in tree-ring proxies, and its performance may not be evident in the short term. Indeed, the correction showed its advantages in improving the quality of chronologies on long timescales (Supplement Table S1). Nevertheless, its further investigation with regard to extended data sets from different forest types is recommended. The benefits of using multiple RCs may be limited by the size of data set, as outlined above (Sect. 3.2). This deduction is supported as the use of multiple RCS provides improved correlations with the more densely replicated FENN data set but not with smaller TORN data set (Supplement Table S1). Interestingly, when TORN replication is enhanced by living trees, the multiple-RCS (TORN-RC2SF) chronology does show higher correlations with the instrumental record (Table S2). Consistently, the dendroclimatic correlations improve with multiple RCS in the case of FENN and FULL data sets. Moreover, the correction procedure failed to improve the TORN-RC2SF (see Supplement Table S1 for 100, 200 and 300 yr smoothing). We assume this to be a consequence of reducing the quality of TORN-RC2SF chronology via the use of multiple RCs in the case of the less well replicated TORN data set. 4.1.5
Cambial age structure
As previously alluded to, the TORN and FENN chronologies deviate notably over the last half of the 20th century when the age structure diverges with a more pronounced addition of MXD series of young pines to the FENN data set. Obviously, the cambial age structure of the chronology could serve as a specific factor explaining the observed MXD bifurcation. However, an outline of the coherence of long-term MXD variant between different age classes was provided by Esper et al. (2012). Yet, the analysis of Melvin et al. (2013) showed that their young pines (TORN) come with higher MXD values, particularly in the late 20th century. These lines of evidence allow us to assume that the increase of young pines in the FENN data set over this period could not result in lowered MXD values, in comparison to TORN data. A more detailed investigation of age-dependent growth variations is recommended to clarify the influence of young pine MXD series for estimating the mean chronology. www.clim-past.net/10/1473/2014/
4.1.6
1483
Riparian and inland habitats
It is essential to note that the initial tree-ring materials originate from predominantly dry inland (TORN) and lake riparian (FENN) habitats. Moreover, the subfossil period of the chronologies is covered with snags from subaerial conditions (TORN) and sub-aquatic stems recovered from lake sedimentary archives (FENN) (Bartholin and Karlén, 1983; Schweingruber et al., 1988; Eronen et al., 2002; Grudd, 2008; Esper et al., 2012). In the study region, the riparian P. sylvestris are expected to experience less drought stress and, in fact, do exhibit a stronger dendroclimatic response in their tree-ring widths to summer temperatures (Hundhausen, 2004). These findings are contrasted by our MXD results showing that, actually, the TORN chronologies of inland habitats demonstrate appreciably higher correlations with summer temperature than the FENN chronologies of riparian habitats (Table S2). Secondly, a previous comparison using tree-ring material from living pines of riparian and inland habitats showed notably higher MXD indices from riparian trees, in comparison to pines growing in inland conditions (Esper et al., 2012). However, the inland TORN chronologies showed higher MXD values in the 20th century, in better accordance with instrumental temperature data than the riparian FENN chronologies (Fig. 6). Parallel observation was previously derived for P. sylvestris tree-ring widths in the central Scandinavian Mountains where their wet-site chronology explained considerably less (24 %) instrumental climate variance than the dry-site (43 %) chronology (Linderholm, 2001). Waterlogging, which has been seen as probably the primary restriction on the radial growth of P. sylvestris at wet sites (Moir et al., 2011), may also be a factor leading to noisier MXD variations in the FENN data (Fig. 6). Also the spectra of the TORN and FENN chronologies differed (Fig. 5). While the 56, 67, 113 and 133 yr periodicities in TORN agreed reasonably with the 54, 70, 113 and 133 yr periodicities in FENN data, only the TORN chronology exhibited a 33 yr periodicity whereas the FENN chronology showed a solitary periodicity of 86 yr. Similarly, a disparity of periodicities in P. sylvestris tree-ring widths was detected in the central Scandinavian Mountains where the drysite and wet-site chronologies displayed periodicities of 66 yr and 19 yr, respectively (Linderholm, 2001). Because of this, the spectral analysis would in fact imply differentiated lowfrequency variations in the studied inland and riparian MXD data. A list of at least four conceivable factors having caused the described MXD divergences could include (1) the past changes in stand density that could have altered the MXD growth disproportionately near the timberline (i.e. TORN habitats) and in more southern sites (i.e. FENN), (2) the inclusion of young pines and their MXD values for chronology estimation, (3) the calibration of differently produced MXD data into a combined record, and (4) the potential role of waterlogging which may have occasionally restricted the MXD Clim. Past, 10, 1473–1487, 2014
1484
V. V. Matskovsky and S. Helama: Testing summer temperature reconstruction
production on wet sites. Detailed investigations on these issues are too far beyond the scope of this study. Instead, we urge future research to delve into the roles of the four aforementioned factors in producing the MXD variations in relevant biogeographical settings. 4.2
Low-frequency temperature variations
For the Common Era, the reconstruction (Fig. 7) exhibits consistency with the climatic phases through the MWP and LIA (Lamb, 1977). Thus, the reconstruction is similar to previous investigations using P. sylvestris tree-ring widths and MXD as proxies of Fennoscandian past temperature variability (Briffa et al., 1992, 1996; Grudd, 2008; Helama et al., 2009a, 2009c; Esper et al., 2012; McCarroll et al., 2013; Melvin et al., 2013). Moreover, the reconstruction agrees with the previous studies showing evidence of comparatively similar warmth during the MWP and the most recent decades (Briffa et al., 1992; Grudd et al., 2002; Helama et al., 2009a, 2009c; McCarroll et al., 2013; Melvin et al., 2013). Even warmer times were experienced during the earliest centuries of the reconstruction (Esper et al., 2012). These are also the times when the uncertainty envelope of the reconstruction becomes wider. The widening (see Fig. 7) stems especially from the decreased sample replication over the earlier period (Fig. 2a). Nevertheless, the long duration of the MWP makes it incomparable to the 20th-century warmth. As an interesting feature of the reconstruction, the start of the MWP appears as early as the 8th century, lasting until the end of the 11th century, whereas the widespread positive temperature anomalies in the Northern Hemisphere are observed from the 9th to 11th centuries (Ljungqvist et al., 2012). Apart from these millennial temperature variations, the reconstruction displays periodicities on multi-decadal, centennial and multi-centennial timescales (Fig. 8). In Fennoscandia, the tree-ring variations of similar multi-decadal (53 to 66 yr) scales have previously been linked (Linderholm, 2001; Helama et al., 2009c) to variations in sea surface temperatures of the North Atlantic Ocean (Schlesinger and Ramankutty, 1994). Likewise, the century-scale variations (80 to 120 yr) in the regional tree-ring-based temperature reconstructions have been attributed to the Gleissberg (de Jager, 2005) cycle of solar activity (Briffa and Schweingruber, 1992; Ogurtsov et al., 2001). Spectral densities between 250 yr and 350 yr are common to temperature histories from the Greenland ice cores, the North Atlantic and the Torneträsk tree-ring widths (Sejrup et al., 2011) but their possible origins may remain uncertain. Longer-scale variations (500 to 1000 yr) may be indicative of North Atlantic circulation patterns (Chapman and Shackleton, 2000). Actually, the North Atlantic influence could be expected to drive a notable part of the natural climate variability in the study sites. The region is directly downwind of the Atlantic Ocean where the air pressure patterns, especially the North Atlantic Oscillation (NAO), impact the regional temperature Clim. Past, 10, 1473–1487, 2014
as well as precipitation variations on synoptic scales (Hurrell, 1995). Apart from the instrumentally observed variations, the NAO has been shown to exhibit centennial fluctuations with pervasively positive and negative phases during the MWP and LIA (Trouet et al., 2009; Mann et al., 2009). In fact, the NAO sensitivity of the climate has been described near the study region using several multi-proxy data sets for the MWP and LIA, showing seasonal variations in winter (warmer and moister) and summer (cooler and less rainy) climate, in accordance with the expected NAO influence (Helama et al., 2009b; Luoto and Helama, 2010; Helama and Holopainen, 2012; Luoto et al., 2013; Nevalainen et al., 2013). Moreover, the temperature variations through the MWP and LIA could be linked to the periods of more and less intensive phases in the formation of North Atlantic deep water (Helama et al., 2009c).
5
Conclusions
We have taken advantage of two well-known tree-ring data sets, the Torneträsk MXD chronology in northern Sweden and the newly constructed Fennoscandian MXD chronology, to develop a new MXD-based temperature reconstruction that preserves the low-frequency variability. We applied RCS-based novel standardization techniques and also, for the first time for these data sets, represented uncertainties emerging from different sources and discussed the potential sources of noise in these data sets. The reconstruction provides a valuable proxy for exploring the past climate variability in the high latitudes of Europe. Existence of some noise does become obvious as the two chronologies deviate in the instrumental period as well as in their late Holocene common period. Although the MXD records have been used regularly for palaeoclimate reconstruction both in the study region and elsewhere and despite the past efforts to understand MXD behaviour over time and space, our results suggest that the lowfrequency band of MXD variations in particular may contain a proportion of tree growth variations unrelated to actual temperature history. Based on these findings, we have identified several additional issues that dendroclimatic research could focus on in more detail to obtain a more advanced understanding of potential pitfalls when using high-latitude MXD data for palaeoclimate temperature reconstructions: (1) influence of past population density variations on MXD data, (2) potential biases when calibrating differently produced MXD data to produce one proxy record, (3) influence of young pine MXD data on the most recent past and (4) possible role of waterlogging on MXD production when analysing tree-ring data of riparian trees. Our experiments have shown that application of novel standardization techniques can reduce unwanted biases connected to these pitfalls. Thus, our new reconstruction can be used as the source of information about year-to-year as well as centennial and longer variations of summer temperature in northern Fennoscandia for www.clim-past.net/10/1473/2014/
V. V. Matskovsky and S. Helama: Testing summer temperature reconstruction the Common Era. Described differences between the subregional data sets added an uncertainty to the MXD-derived temperature history. It is likely that associated discrepancies can be explored by use of other proxies that can reproduce low-frequency past temperature variations, in combination with tree-ring data. Such complementary data can be derived from other tree growth (McCarroll et al., 2013) or pollen proxies (Helama et al., 2010c). The Supplement related to this article is available online at doi:10.5194/cp-10-1473-2014-supplement.
Acknowledgements. We acknowledge the corresponding authors (Esper et al., 2012; Melvin et al., 2013) for making the data available. We are thankful to A.-L. Daniau and A. Reyes who helped to improve the quality of the manuscript. Comments by two referees, T. M. Melvin and J. Björklund, on the earlier version of the manuscript are acknowledged. This study was supported by the Russian Foundation for Basic Research (grant no. 12-05-31126) and the Academy of Finland (grant no. 251441). V. V. Matskovsky thanks PAGES and the Asia-Pacific Network for Global Change Research for their financial support to attend the PAGES 2nd Young Scientists Meeting and 4th Open Science Meeting. Edited by: A.-L.Daniau
References Bartholin, T.: Dendrochronology in Sweden, Ann. Acad. Sci. Fennicae., 145, 79–88, 1987. Bartholin, T. S. and Karlén, W.: Dendrokronologi i Lapland, Dendrokronologiska Sällskapet, 5, 3–16, 1983. Björklund, J. A., Gunnarson, B. E., Krusic, P. J., Grudd, H., Josefsson, T., Östlund, L., and Linderholm, H. W.: Advances towards improved low-frequency tree-ring reconstructions, using an updated Pinus sylvestris L. MXD network from the Scandinavian Mountains, Theor. Appl. Climatol., 113, 697–710, doi:10.1007/s00704-012-0787-7, 2013. Briffa, K. R. and Schweingruber, F. H.: Recent dendroclimatic evidence of northern and central European summer temperatures, in: Climate since A. D. 1500, edited by: Bradley, R. S. and Jones, P. D., Routledge, London, 366–392, 1992. Briffa, K. R., Bartholin, T. S., Eckstein, D., Jones, P. D., Karlén, W., Schweingruber, F. H., and Zetterberg, P.: A 1400-year tree-ring record of summer temperatures in Fennoscandia, Nature, 346, 434–439, 1990. Briffa, K. R., Jones, P. D., Bartholin, T. S., Eckstein, D., Schweingruber, F. H., Karlén, W., Zetterberg, P. and Eronen, M: Fennoscandian summers from AD 500: Temperature changes on short and long timescales, Clim. Dyn., 7, 111–119, 1992. Briffa, K. R., Jones, P. D., Pilcher, J. R., and Hughes, M. K.: Reconstructing summer temperatures n northern Fennoscandinavia back to AD 1700 using tree-ring data from Scots pine, Arctic Alpine Res., 20, 385–394, 1988.
www.clim-past.net/10/1473/2014/
1485
Briffa, K. R., Jones, P. D., Schweingruber, F. H., Karlén, W., and Shiyatov, S. G.: Tree-ring variables as proxy-climate indicators: Problems with low-frequency signals, in: Climate variations and forcings mechanisms of the last 2000 years, edited by: Jones, P. D., Bradley, R. S., and Jouzelm J., Springer, Berlin, 9–41, 1996. Briffa, K. R., Osborn, T. J., Schweingruber, F. H., Jones, P. D., Shiyatov, S. G., and Vaganov, E. A.: Tree-ring width and density data around the Northern Hemisphere, Part 1, local and regional climate signals, Holocene, 12, 737–751, 2002. Briffa K. R. and Melvin T. M.: A closer look at Regional Curve Standardization of tree-ring records: justification of the need, a warning of some pitfalls, and suggested improvements of its application, in: Dendroclimatology: Progress and prospects, edited by: Hughes, M. K., Diaz, H. F., and Swetnam, T. W., Springer Verlag, 113–145, 2011. Broecker, W. S.: Was the medieval warm period global?, Science, 291, 1497–1499, 2001. Büntgen, U., Frank, D., Grudd, H., and Esper, J.: Long-term summer temperature variations in the Pyrenees, Clim. Dynam., 31, 615–631, 2008. Büntgen, U., Raible, C. C., Frank, D., Helama, S., Cunningham, L., Hofer, D., Nievergelt, D., Verstege, A., Timonen, M., Stenseth, N. C., and Esper J.: Causes and Consequences of Past and Projected Scandinavian Summer Temperatures, 500–2100 AD, PLoS ONE, 6, e25133, doi:10.1371/journal.pone.0025133, 2011. Büntgen, U., Tegel, W., Heussner, K. -U., Hofmann, J., Kontic, R., Kyncl, T., and Cook, E. R.: Effects of sample size in dendroclimatology, Clim. Res., 53, 263–269, 2012. Chapman, M. R. and Shackleton, N. J.: Evidence of 550-year and 1000-year cyclicities in North Atlantic circulation patterns during the Holocene, Holocene, 10, 287–291, 2000. Cook, E. R. and Briffa, K. R.: A Comparison of Some Tree-Ring StandardizationMethods, in: Methods of dendrochronology: applications in the environmental science, edited by: Cook, E. R. and Kairiukstis, L. A., Academic Publishers, Kluwer, Dordrecht, 153–162, 1990. Cook, E. R. and Peters, K.: The smoothing spline: a new approach to standardizing forest interior tree-ring width series for dendroclimatic studies, Tree-Ring Bull., 41, 45–53, 1981. Cook, E. R., Briffa, K. R., and Jones, P. D.: Spatial regression methods in dendroclimatology – a review and comparison of two techniques, Int. J. Climatol., 14, 379–402, 1994. Cook, E. R., Briffa, K. R., Meko, D. M., Graybill, D. A., and Funkhouser, G.: The “segment length curse” in long tree-ring chronology development for palaeoclimatic studies, Holocene, 5, 229–237, 1995. Cooper, R. J., Melvin, T. M., Tyers, J., Wilson, R. J. S., and Briffa, K. R.: A tree-ring reconstruction of East Anglian (UK) hydroclimate variability over the last millennium, Clim. Dynam., 40, 1019–1039, doi:10.1007/s00382-012-1328-x, 2013. Davi, N. K., Jacoby, G. C., and Wiles, G. C.: Boreal temperature variability inferred from maximum latewood density and treering width data, Wrangell Mountain region, Alaska, Quaternary Res., 60, 252–262, 2003. de Jager, C.: Solar forcing of climate. 1: Solar variability, Space Sci. Rev., 120, 197–241, 2005. Erlandsson, S.: Dendro-chronological studies, Fr. Stockholms Högskolas Geokronol. Inst., Uppsala, 23, 1–119, 1936.
Clim. Past, 10, 1473–1487, 2014
1486
V. V. Matskovsky and S. Helama: Testing summer temperature reconstruction
Eronen, M., Zetterberg, P., Briffa, K. R., Lindholm, M., Meriläiinen, J., and Timonen, M.: The supra-long Scots pine tree-ring record for Finnish Lapland: Part 1, chronology construction and initial inferences, Holocene, 12, 673–680, 2002. Esper, J., Cook, E. R., and Schweingruber, F. H.: Low-frequency signals in long tree-ring chronologies for reconstructing past temperature variability, Science, 295, 2250–2253, 2002. Esper, J., Frank, D. C., Timonen, M., Zorita, E., Wilson, R. J. S., Luterbacher, J., Holzkämper, S., Fischer, N., Wagner, S., Nievergelt, D., Verstege, A., and Büntgen, U.: Orbital forcing of treering data, Nature Clim. Change, 2, 862–866, 2012. Fritts, H. C.: Tree rings and climate, Academic Press, London, 1976. Fritts, H. C. and Swetnam, T. W.: Dendroecology: A tool for evaluating variations in past and present forest environments, Adv. Ecol. Res. 19, 111–188, 1989. Grudd, H.: Torneträsk tree-ring width and density AD 500–2004: a test of climatic sensitivity and a new 1500-year reconstruction of north Fennoscandian summers, Clim. Dynam., 31, 843–857, 2008. Helama, S. and Holopainen, J.: Spring temperature variability relative to the North Atlantic Oscillation and sunspots – A correlation analysis with a Monte Carlo implementation, Palaeogeogr. Palaeoclim. Palaeoecol., 326, 128–134, 2012. Helama, S., Lindholm, M., Timonen, M., and Eronen, M.: Detection of climate signal in dendrochronological data analysis: a comparison of tree-ring standardization methods, Theor. Appl. Climatol., 79, 239–254, 2004. Helama, S., Lindholm, M., Timonen, M., and Eronen, M.: Midand late Holocene tree population density changes in northern Fennoscandia derived by a new method using megafossil pines and their tree-ring series, J. Quatern. Sci., 20, 567–575, 2005a. Helama, S., Timonen, M., Lindholm, M., Meriläinen, J., and Eronen, M.: Extracting long-period climate fluctuations from treering chronologies over timescales of centuries to millennia, Int. J. Climatol. 25, 1767–1779, 2005b. Helama, S., Makarenko, N. G., Karimova, L. M., Kruglun, O. A., Timonen, M., Holopainen, J., Meriläinen, J., and Eronen, M.: Dendroclimatic transfer functions revisited: Little Ice Age and Medieval Warm Period summer temperatures reconstructed using artificial neural networks and linear algorithms, Ann. Geophys., 27, 1097–1111, doi:10.5194/angeo-27-1097-2009, 2009a. Helama, S., Meriläinen, J., and Tuomenvirta H.: Multicentennial megadrought in northern Europe coincided with a global El Niño–Southern Oscillation drought pattern during the Medieval Climate Anomaly, Geology, 37, 175–178, 2009b. Helama, S., Timonen, M., Holopainen, J., Ogurtsov, M. G., Mielikäinen, K., Eronen, M., Lindholm, M., and Meriläinen, J.: Summer temperature variations in Lapland during the Medieval Warm Period and the Little Ice Age relative to natural instability of thermohaline circulation on multi-decadal and multicentennial scales, J. Quatern. Sci., 24, 450–456, 2009c. Helama, S., Eronen, M., and Timonen M.: Dendroécologie des bois fossiles dans le nord de la Laponie, in: La Dendroécologie: Principes, méthodes et applications, edited by: Payette, S., and Filion, L., Presses de l’Université Laval, Québec, 709–730, 2010a. Helama, S., Läänelaid, A., Tietäväinen, H., Macias Fauria, M., Kukkonen, I. T., Holopainen, J., Nielsen, J. K., and Valovirta I.:
Clim. Past, 10, 1473–1487, 2014
Late Holocene climatic variability reconstructed from incremental data from pines and pearl mussels – a multi-proxy comparison of air and subsurface temperatures, Boreas, 39, 734–748, 2010b. Helama, S., Seppä, H., Birks, H. J. B., and Bjune A. E.: Reconciling pollen-stratigraphical and tree-ring evidence for high- and lowfrequency temperature variability in the past millennium, Quaternary Sci. Rev. 29, 3905–3918, 2010c. Helama, S., Vartiainen, M., Kolström, T., and Meriläinen, J.: Dendrochronological investigation of wood extractives, Wood Sci. Technol., 44, 335–351, 2010d. Helama, S., Bégin, Y., Vartiainen, M., Peltola, H., Kolström, T., and Meriläinen, J.: Quantifications of dendrochronological information from contrasting microdensitometric measuring circumstances of experimental wood samples, Appl. Radiat. Isotopes, 70, 1014–1023, 2012. Helama, S., Jiang, J., Korhonen, J., Holopainen, J., and Timonen, M.: Quantifying temporal changes in Tornionjoki river ice breakup dates and spring temperatures in Lapland since 1802, J. Geogr. Sci., 23, 1069–1079, 2013. Hughes, M. K., Schweingruber, F. H., Cartwright, D., and Kelly, P. M.: July–August temperature at Edinburgh between 1721 and 1975 from tree-ring density and width data, Nature, 308, 341– 344, 1984. Hundhausen, U.: The climate signal of tree-rings in Scots pine (Pinus sylvestris L.) living along lakeshores in northern Norway. A contribution to the dendroclimatological interpretation of subfossil pines, Diplomarbeit, Zur Erlangung des akademischen Grades, Diplom-Holzwirt, im Fachbereich Biologie der Universität Hamburg, 2004. Hurrell, J. W.: Decadal trends in the North Atlantic Oscillation: regional temperatures and precipitation, Science, 269, 676–679, 1995. Jones, P. D., Briffa, K. R., Barnett, T. P., and Tett, S. F. B.: Highresolution paleoclimatic records for the last millennium: Interpretation, integration and comparison with general circulation model control-run temperatures, Holocene, 8, 455–471, 1998. Klingbjer, P. and Moberg, A.: A composite monthly temperature record from Tornedalen in northern Sweden, 1802–2002, Int. J. Climatol., 23, 1465–1494, 2003. Lamb, H. H.: Climate: present, past and future, Climate history and the future, London: Methuen, 2, 1977. Lee, T. C. K., Zwiers, F. C., and Tsao, M.: Evaluation of proxybased millennial reconstruction methods, Clim. Dynam., 31, 263–281, doi:10.1007/s00382-007-0351-9, 2007. Linderholm, H. W.: Climatic influence on Scots pine growth on dry and wet soils in the central Scandinavian mountains, interpreted from tree-ring widths, Silva Fenn., 35, 415–424, 2001. Ljungqvist, F. C., Krusic, P. J., Brattström, G., and Sundqvist, H. S.: Northern Hemisphere temperature patterns in the last 12 centuries, Clim. Past, 8, 227–249, doi:10.5194/cp-8-227-2012, 2012. Luckman, B. H., Wilson, R. J. S.: Summer temperatures in the Canadian Rockies during the last millennium: a revised record, Clim. Dynam., 24, 131–144, 2005. Luoto, T. P. and Helama, S.: Palaeoclimatological and palaeolimnological records from fossil midges and tree-rings: the role of the North Atlantic Oscillation in eastern Finland through the Medieval Climate Anomaly and Little Ice Age, Quatern. Sci. Rev., 29, 2411–2423, 2010.
www.clim-past.net/10/1473/2014/
V. V. Matskovsky and S. Helama: Testing summer temperature reconstruction Luoto, T. P., Helama, S., and Nevalainen, L.: Stream flow intensity of the Saavanjoki River, eastern Finland, during the past 1500 years reflected by mayfly and caddisfly mandibles in adjacent lake sediments, J. Hydrol., 476, 147–153, 2013. Mann, M. E., Zhang, Z., Rutherford, S., Bradley, R. S., Hughes, M. K., Shindell, D., Ammann, C., Faluvegi, G., and Ni, F.: Global signatures and dynamical origins of the Little Ice Age and Medieval Climate Anomaly, Science, 326, 1256–1260, 2009. Matskovsky, V. V.: Estimation of Biases in RCS Chronologies of Tree Rings, J. of Siberian Federal University, Biology, 4, 389– 404, 2011, in russian. McCarroll, D., Loader, N., Jalkanen, R., Gagen, M., Grudd, H., Gunnarson, B., Kirchhefer, A., Friedrich, M., Linderholm, H., Lindholm, M., Boettger, T., Los, S., Remmele, S., Kononov, Y., Yamazaki, H., Young, G., and Zorita, E.: A 1200-year multiproxy record of tree growth and summer temperature at the northern pine forest limit of Europe, Holocene, 23, 471–484, 2013. Melvin, T. M. and Briffa, K. R.: A “Signal-Free” approach to Dendroclimatic Standardisation, Dendrochronologia, 26, 71–86, 2008. Melvin, T. M., Briffa, K. R., Nicolussi, K., and Grabner, M.: Time-varying response smoothing, Dendrochronologia, 25, 65– 69, 2007. Melvin, T. M. and Briffa, K. R.: CRUST: Software for the implementation of Regional Chronology Standardisation: Part 1. Signal-Free RCS, Dendrochronologia, doi:10.1016/j.dendro.2013.06.002, 2013. Melvin, T. M., Grudd, H., and Briffa, K. R.: Potential bias in “updating” tree-ring chronologies using regional curve standardisation: Re-processing 1500 years of Torneträsk density and ring-width data, Holocene, 23, 364–373, 2013. Moir, A. K., Leroy, S. A. G., and Helama, S.: Role of substrate on the dendroclimatic response of Scots pine from varying elevations in northern Scotland, Can. J. For. Res., 41, 822–838, 2011. Nevalainen, L., Helama, S., and Luoto, T.: Hydroclimatic variations over the last millennium in eastern Finland disentangled by fossil Cladocera, Palaeogeogr. Palaeoclimatol. Palaeoecol., 378, 13– 21, 2013.
www.clim-past.net/10/1473/2014/
1487
Nicault, A., Guiot, J., Edouard, J. L., and Brewer, S.: Preserving long-term fluctuations in standardisation of tree-ring series by the adaptative regional growth curve (ARGC), Dendrochronologia, 28, 1–12, 2010. Ogurtsov, M. G., Kocharov, G. E., Lindholm, M., Eronen, M., and Nagovitsyn, Y. A.: 2001 Solar activity and regional climate, Radiocarbon, 43, 439–447, 2001. Osborn, T. J. and Briffa, K. R.: The spatial extent of 20th-century warmth in the context of the past 1200 years, Science, 313, 841– 844, 2006. Peltola, H., Kilpeläinen, A., Sauvala, K., Räisänen, T., and Ikonen, V.-P.: Effects of early thinning regime and tree status on the radial growth and wood density of Scots pine, Silva Fenn., 41, 489–505, 2007. Schlesinger, M. E. and Ramankutty, N.: An oscillation in the global climate system of period 65–70 years, Nature, 367, 723–726, 1994. Schweingruber, F. H., Fritts, H. C., Braker, O. U., Drew, L. G., and Schäar, E.: The x-ray technique as applied to dendroclimatology, Tree-Ring Bull., 38, 61–91, 1978. Schweingruber, F. H., Bartholin, T., Schär, E., and Briffa, K. R.: Radiodensitometric dendroclimatological conifer chronologies from Lapland (Scandinavia) and the Alps (Switzerland), Boreas, 17, 559–566, 1988. Sejrup, H. P., Haflidason, H., and Andrews, J. T.: A Holocene North Atlantic SST record and regional climate variability, Quatern. Sci. Rev., 30, 3181–3195, 2011. Trouet, V., Esper, J., Graham, N. E., Baker, A., Scourse, J. D., and Frank, D. C.: Persistent positive North Atlantic Oscillation mode dominated the medieval climate anomaly, Science, 324, 78–80, 2009. Wigley, T. M. L., Briffa, K. R., and Jones, P. D.: On the average value of correlated time series, with applications in dendroclimatology and hydrometeorology, J. Clim. Appl. Meteorol., 23, 201–213, 1984. Wilson, R., Miles, D., Loader, N. J., Melvin, T. M., Cunningham, L., Cooper, R., and Briffa, K. R.: A millennial long March–July precipitation reconstruction for southern-central England, Clim. Dynam., 40, 997–1017, doi:10.1007/s00382-012-1318-z, 2013.
Clim. Past, 10, 1473–1487, 2014