initial weights for each neural network in an ensemble) and iii) using different .... To label them, we used a known robust classifier for binary classification:.
Text Categorization Using an Ensemble Classifier Based on a Mean Co-association Matrix Luís Moreira-Matias1,2, João Mendes-Moreira1,2, João Gama2,3, and Pavel Brazdil 2,3 1
Departamento de Engenharia Informática, Faculdade de Engenharia, Universidade do Porto, Rua Dr. Roberto Frias, s/n 4200-465 Porto, Portugal 2 LIAAD-INESC Porto L.A. Rua de Ceuta, 118, 6º; 4050-190 Porto, Portugal 3 Faculdade de Economia, Universidade do Porto Rua Dr. Roberto Frias, s/n 4200-465 Porto, Portugal {luis.matias,jmoreira}@fe.up.pt, {jgama,pbrazdil}@fep.up.pt
Abstract. Text Categorization (TC) has attracted the attention of the research community in the last decade. Algorithms like Support Vector Machines, Naïve Bayes or k Nearest Neighbors have been used with good performance, confirmed by several comparative studies. Recently, several ensemble classifiers were also introduced in TC. However, many of those can only provide a category for a given new sample. Instead, in this paper, we propose a methodology – MECAC – to build an ensemble of classifiers that has two advantages to other ensemble methods: 1) it can be run using parallel computing, saving processing time and 2) it can extract important statistics from the obtained clusters. It uses the mean co-association matrix to solve binary TC problems. Our experiments revealed that our framework performed, on average, 2.04% better than the best individual classifier on the tested datasets. These results were statistically validated for a significance level of 0.05 using the Friedman Test. Keywords: Text Categorization, Clustering, Text Mining.
1
Ensemble
Classification,
Consensus
Introduction
In the last decade the Information Retrieval (document management tasks) has attracted a major attention of the machine learning research community due to the high number of electronic documents available on and offline. One of the most relevant tasks is Text Categorization (TC): it consists in labeling automatically a document with a certain category, based on its content. This problem is solved using supervised classification algorithms. From the document set, a feature space is extracted based on a set of unique, uncommon and frequent terms which are evaluated for each document. Many comparative studies have been presented in the last years to understand which classifiers should be the most adequate to the TC domain problems [1-7]. In the last years, some ensemble approaches were also considered to improve the TC performance. In this paper, we present a distinct methodology to ensemble as P. Perner (Ed.): MLDM 2012, LNAI 7376, pp. 525–539, 2012. © Springer-Verlag Berlin Heidelberg 2012
526
L. Moreira-Matias et al.
many classifiers – distinct algorithms or just the same algorithm with different parameters – as defined into a single one using the mean co-association technique (commonly applied in the consensus clustering area [8]) – the MECAC (Ensemble Classification using Mean Co-Association Matrix). Our motivation was to build a new ensemble framework returning more than a simple category for a new sample, as many state-of-art TC algorithms (ensemble and individual ones) do. The authors wanted to extract other kind of metrics useful to better understand the results and/or determine how the categories evolve in time (i.e. clusters birth, merge, etc. like it is presented in the novelty detection problems [9]). We considered four state-of-art classifiers for single-label TC to carry in our experiments: Support Vector Machines with a linear kernel (SVM-linear), k Nearest Neighbors (kNN), Naïve Bayes (NB) and Neural Networks (NNET). Firstly, we build a baseline ensemble method (ENS-b) for comparison against the ensemble approach we propose. ENS-b uses the majority class considered among the base classifiers (we used four models, one model per algorithm). Secondly, we used the same base learners to build two ensembles using MECAC: ENS1, that used all the four models, and ENS2 that used all except NB. Finally, we compared the four base learners, ENS-b, ENS1 and ENS2 using three performance metrics: macro avg./micro avg. F1-measure and CohenKappa to classify document collections of Reuters-21578 dataset [10]. Our experiments show the utility of our methodology for TC: despite the good results presented by all individual classifiers, our best ensemble improved the results of the best individual classifier in each data block by 2.04% (on average). These results were statistically validated for a significance level of 0.05 using the Friedman Test. This paper is structured as follows. Section 2 states a brief description of the problem and some related work. Section 3 presents formally our approach. Section 4 describes how we tested the methodology to a concrete problem. Firstly we describe the dataset and the preprocessing applied. Secondly, we present the ensemble building process. Finally, we point the metrics we used to evaluate each considered approach. Section 5 presents the experimental setup used and the results obtained. It also presents a discussion about those results. Section 6 concludes and describes the future work we intend to carry on.
2
Problem Overview
Multiple approaches to binary TC were presented in the last decades using some wellknown classifiers. However, it is usually difficult to know which one is the best to classify our current text documents [4]. In the literature, there are several comparative studies between distinct classifiers in order to evaluate their performance. In [4], a study to compare Support Vector Machines (SVM), k Nearest Neighbors (kNN) and Naïve Bayes (NB) is presented to perform binary TC. It concludes that all the algorithms should be considered as long as the optimal parameter settings could be used for each one. In [7], SVM, NB, logistic regression and LLSF (Linear Least Square Fit) are also compared. All but NB consistently achieve a top performance. Another algorithm usually considered for this task is the neural network (NNET) one [2].
Text Categorization Using an Ensemble Classifier
527
Despite this straight forwarding knowledge achieved with single supervised learning techniques, the community attention changed its main focus in the last years: the researchers tend to use complex and advanced techniques to solve these problems. Many hybrid techniques to build ensembles of classifiers for TC have been recently used [11]: i) using different subsets of training data with a single learning method, ii) using different parameter settings with a single learning method (e.g. using different initial weights for each neural network in an ensemble) and iii) using different learning methods. The scenario considered in this work is the iii). It is commonly observed that the ensemble accuracy is superior when compared to its base classifiers: in [6] it is used the Dempster’s rule of combination to ensemble SVM, kNN and Rocchio [12]: the ensemble accuracy is, on average, 2.68% better than the best base classifier; in [5] the authors present a framework to combine multiple NNET and it is compared to kNN, SVM, single-NNET and Decision Tree (DT) using a single dataset; it achieves an improvement of 2,7% (of F1 measure); the use of AdaBoost.MH and AdaBoost.MHKR to solve multi-label TC problems in [13] shows gains from 1 to 4% (F1). We found motivation to develop this work due to a particular issue: the majority of the existing approaches to TC give only one kind of information about a new sample (i.e., a text document): the category. How can we know if this is the most suitable one? Should this sample belong to a new and inexistent system category? The unsupervised learning techniques can provide different kinds of information [14-16] about their categories (i.e. clusters). We applied a hybrid approach of both supervised and unsupervised learning trying to get the best from the two learning approaches: different kinds of information and better classification accuracy. The contribution of this work is a new framework to combine results from different classifiers using a weighted mean co-association matrix. At author’s best knowledge, this kind of methodology was never applied to build a classifier ensemble on TC problems.
3
Methodology
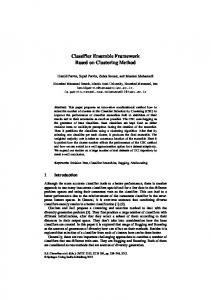
The problem we solve here is the construction of an ensemble to do binary classification of single-labeled text documents. This is done using a weighted mean co-association matrix (firstly proposed to do consensual clustering in [8]) that measures the consensus between all the classifiers to attribute the same class to all existing pairs of text documents. This matrix contains the distances between every pair of documents considered. Finally, we use clustering to separate the documents into distinct categories and SVM-linear to label the clusters. This general idea for our methodology (MECAC) can be divided into three simple steps: 1) the classifiers training; 2) the calculus of the agreement matrix between the test documents and the input classifiers; 3) the documents clustering. The MECAC is briefly presented in Fig. 1 and it is be described in detail further in this section. Let X={x1, x2…xn} be a set of n single labeled two classes (Class1 and Class2) text documents and C={c1, c2…ck} be a set of k classifiers of interest. These classifiers can be obtained using only one algorithm (with different parameter settings, using different training sets or different feature subsets) or using different algorithms. Then, the classifiers are combined.
528
L. Moreira-Matias et al.
Fig. 1. MECAC: Ensemble Classification using Mean Co-Association Matrix
Step 1 – The Classifiers Training A set of classifiers is generated by applying k classification algorithms to our training set X. π = π , π … π contains the class determined by the classifiers to our test set." Step 2 – The calculus of the Agreement Matrix We present an algorithm that creates a new distance measurement based on the agreement between the k classifiers. Let M (s x s) be a quadratic matrix as large as the number of test documents. The values in the matrix measure the agreement between the classifiers to categorize equally both documents. The mean coassociation matrix [8], represents the classification agreement between all classifiers. The values in the matrix are obtained as follows: 2
if a 0 , i, j 1, … , s (3.1) 0 if a = 0 where a is the number of classifiers that classified equally the documents i and j, independently on the true class of both documents. This matrix measures the agreement of the classifiers to label equally each pair of documents. This information is directly about the similarity between each pair of documents - then the category is calculated based on it. The weights (the pow used to calculate the agreement instead of a simple sum) were introduced to enhance the agreement achieved between all classifiers: it is measured exponentially to express its consensus relevance. This weighted measure is one of the main contributions of this work because it innovates the calculus of the distance between text documents for binary TC (the simple sum proposed in [8] performs worst in the current context). Such distance highlights the agreement between the classifiers (i.e. the similarity between the documents). After its normalization (we divide all the values in the matrix for its maximum value), it is possible to transform the matrix M into the quadratic matrix (s x s), as follows: M (i, j) =
=1
M
(3.2)
where ma is the previously referred maximum. Step 3 – The Document Clustering We use the matrix as input for a clustering algorithm of interest like k-means. We split the test set into 2 unlabeled partitions because this is a binary classification
Text Categorization Using an Ensemble Classifier
529
problem. To label them, we used a known robust classifier for binary classification: SVM with a linear kernel [2, 4, 11]. We set the labels to the partitions by choosing the resulting majority class for the given partition, training the algorithm with the same training set used to train the classifiers in C. A pseudo-code representation of our framework is presented in Fig. 2. Procedure Ensemble Classification using Mean Co-Association Matrix (MECAC) Input: a set of n documents to categorize X={x1, x2,…,xn} a set of k classifiers C={c1, c2,…,ck} an user-defined percentage p to form the test set Declarations: s is a integer representing the number of documents in the test set (n*p) class is a matrix of labels: classifiers*labels (k*s) m is an integer quadratic matrix s*s defined with zeros Body: 1. Define the test set S using s documents in X 2. Define the training set T with the remaining t documents in X 3. For each ci in C { 3.1 Train the classifier ci using the categorized documents in T 3.2 Use the trained classifier ci to categorize the documents in S 3.3 Save the resulting labels in class[i,] } 4. For each o between 1 and s For each j between 1 and s For each b between 1 and k For each i between b+1 and k IF (class[b,o] == class[i,j]) IF(m[o,j]==0) m[o,j]=1; ELSE m[o,j]=m[o,j]*2; 5. Use m as input of k-means algorithm to form 2 clusters of documents: k1 and k2. 6. Use the SVM-linear algorithm trained on the T set to classify the documents in k1 and k2. 7. The categories corresponding to each cluster are chosen by determining the majority class obtained in each one of them in the previous step.
Fig. 2. Pseudo code of MECAC, the proposed ensemble methodology
4
Methodology Application
In this section, we describe how we carried out our experiments. Firstly we describe the data set used and the preprocessing applied to it. Then, we briefly review how we adapted our methodology to build our ensemble in this case and finally present the metrics applied to compare our methodology versus the remaining approaches.
530
4.1
L. Moreira-Matias et al.
Dataset
The data contained in the “Reuters-21578, Distribution 1.0 corpus” is freely available for experimentation purposes from [10]. It consists of news stories appeared on the Reuters newswire in 1987. There are 5 groups of categories in the dataset but just the TOPICS group is commonly used in TC experimental research. These groups have 135 categories and a total of 12902 documents. In Table 1 the categories per dataset and the total number of documents per category is shown. In this work we considered just 7 categories out of the total 135. Those documents were used to form five distinct datasets (DS1 to DS5) with pairs of categories (binary classification). Table 1. Datasets description and relation with the categories Category Coffee Crude Grain Interest Money-Fx Sugar Wheat
4.2
Nr. Docs. 143 334 401 335 344 180 208
Dataset DS1 DS2 DS3 DS4 DS5
Class1 Wheat Sugar Sugar Interest Grain
Class2 Money-Fx Interest Crude Coffee Crude
Preprocessing
One of the most important stages in TC is the preprocessing one. The uncommon words must be extracted from each document. Then, such words are used as features for the classification task. We used the tm_map function from R software [17]. Firstly, we removed the existing XML code. Then, we turned the text into plain text. Thirdly, we removed the stop words and then the extra whitespaces. Finally, we converted the text to lowercase and we removed the punctuation and the existing numbers. Then, we did feature selection using three metrics [1, 2, 4]: (1) the Minimum Word Length (MWL), the minimum term length to consider it informative; (2) the Minimum Document Frequency (MDF), the minimum number of documents containing this term in their corpus to consider it informative; and (3) the Information Gain (IG) to impose an ordering on a set of attributes. Finally, the terms are weighted by term frequency and inverse document frequency (tfidf) [18]. We used these heuristics due to its simplicity and good performance [1, 4, 19]. 4.3
Ensemble Building
This section demonstrates how we have adapted the previously presented methodology to the problem described in Section 2. The k-means was chosen as clustering algorithm due to its simplicity, efficiency and efficacy as well as its many applications over the last decades [21-23]. We set both the MWL and the MDF as 3. The min.info parameter of the IG heuristic was set to 0.005. These parameters where used in all the experiments described in this paper. We developed all the work using
Text Categorization Using an Ensemble Classifier
531
the R-project and the following supervised classification algorithms: NNET, kNN, SVM with a linear kernel and NB. This choice was made due to its high popularity and performance in TC [1, 2, 4-6, 8, 19]. The R packages used to implement the algorithms are identified in Table 2. In general, the functions default parameters (from the R) were used. The exceptions, i.e., the user-defined parameters, are described next. The NNET implementation used to carry out the experiments had 4 main parameters: the size (measures the number of units in the hidden layer); the decay and rang (they set the weight decay and measure the initial random weights, respectively) and the maxit (it sets the maximum number of iterations). They were set to 2, 5e , 0.1 and 400, respectively. Table 2. Identification of the R packages used to test the considered classifiers
Classification Algorithm Neural Network K Nearest Neighbors Support Vector Machine Naïve Bayes
R package [nnet] [class] [e1071] [RWeka]
Package Reference [20] [20] [21] [22]
The classifiers described were used to build three ensembles: ENS1 is an ensemble build using MECAC from all base classifiers and; ENS2 only uses the three most accurate base classifiers as input to MECAC. Finally, we built a baseline ensemble to compare our approaches with – ENS-b. It uses the majority class among all classifiers. In a tie scenario, the class is randomly chosen. Some metrics were used to compare the ensembles accuracy versus each individual algorithm considered. 4.4
Evaluation Metrics
The metrics to evaluate prediction accuracy uses the confusion table with the notions of true positive, false positive, false negative and true negative (TP, FP, FN and TN). However, these notions are not meaningful in TC. A contingency table is presented in Table 3 naming the correspondences between the two classes and that nomenclature. Table 3. Contingency table for TC Document Classification Total
Predicted Class1 Predicted Class2
Classifier Observation TP (hits) FP (incorrect classif.) FN (incorrect classif.) TN (hits) Observed Class1 Observed Class2
Two widely used metrics in TC to test classifiers’ accuracy are the macro averaged F1 measure [3] and the micro averaged one [23]. The macro avg. F1 is computed locally over each category. It can be obtained as a weighted average of two other metrics: MPrecision and MRecall (averages of the precision and recall for both classes). In micro-averaging, F1 is obtained by computing globally over all category decisions. The referred metrics can be obtained as follows:
532
L. Moreira-Matias et al. TP TP FP
MPrecision =
TN TN FN
Macro avg. F ω=
TP TP FP
=
=2
∑ ∑
, MRecall =
(
)
,ρ=
Micro avg. F
TP TP FN
MP
MR
MP
MR
TP TP FN
=2
=∑
TN TN FP
(4.1) (4.2)
∑ (
)
(4.3) (4.4)
We also considered the kappa coefficient (or Cohen kappa) [24] as accuracy metric. It is a statistical measure of inter-rater agreement for qualitative (categorical) events. It is computed as: P( ) P( ) k= (4.5) P( )
where ( ) is the relative observed agreement between the predicted and the actual categories. ( ) is the hypothetical probability of chance agreement. The observed data is used to calculate the probabilities of each observer randomly identifying each category. If the classifiers are in complete agreement then = 1. If there is no agreement among the predictions (other than what would be expected by chance) then 0.
5
Results
In this section, the results obtained with our dataset are presented, statistically validated and discussed. Our experimental setup was the well-known 5-fold cross validation. We used it for each one of the five datasets considered, forming 25 data blocks. We used the results obtained in each partition of the cross validation process with both F1 measures (macro and micro) and the Cohen Kappa. In Fig. 3, an averaged comparison between all the classifiers using the three considered metrics is displayed. The results for both F1 measures are presented in detail in Table 4 and Table 5. Secondly, we validated these results using the Friedman Test like we present below. Finally, we discuss the experiments achievements. 5.1
Results Validation (Friedman Test)
The statistical validation of these results was done using the Friedman rank test as proposed by Iman and Davenport [25]. We have compared the best individual classifier (SVM-linear), our best ensemble (ENS2) and our baseline ensemble ENS-b using the results obtained through the macro averaged F1-measure on the 25 data blocks extracted. The ranks obtained are presented in Table 6. The P-value obtained for the null hypothesis of equivalence between the three predictors was 0.01256. This hypothesis was rejected for a significance level of 0.05.
Text Categorization Using an Ensemble Classifier
533
The post-hoc analysis iss presented in Fig. 4: the tests validated for a significaance level of 0.05 are displayed d in white and the remaining in grey. The boxes repressent the variance as well as the lower l and upper limits of the tests. The positive significancee in the left hand box means that the ENS2 is significanntly better than ENS-B and th he negative in the right hand means that the SVM M is significantly worse than ENS2, E demonstrating that our method is significan ntly superior to the remaining ones for binary text classification problems. Table 4. Performance obtain ned from the seven considered algorithms on the 25 bloocks extracted using the Macro-Av veraged F1-Measure. The ENS-2 performed, on average, 2,004% better than the best individual classifier: SVM. Block DS1-1 DS1-2 DS1-3 DS1-4 DS1-5 DS2-1 DS2-2 DS2-3 DS2-4 DS2-5 DS3-1 DS3-2 DS3-3 DS3-4 DS3-5 DS4-1 DS4-2 DS4-3 DS4-4 DS4-5 DS5-1 DS5-2 DS5-3 DS5-4 DS5-5
SVM kNN NB 0.895 50 0.8901 0.6720 0.904 44 0.8811 0.7442 0.923 30 0.8776 0.6822 0.913 33 0.8603 0.5496 0.903 37 0.8621 0.7218 0.927 71 0.9373 0.8594 0.914 40 0.9011 0.8264 0.906 67 0.9067 0.8308 0.914 40 0.8767 0.8504 0.903 34 0.9346 0.8943 0.927 71 0.8409 0.8957 0.914 49 0.9281 0.8415 0.906 67 0.8455 0.9139 0.937 73 0.9313 0.7619 0.893 32 0.8604 0.8026 0.902 24 0.9043 0.8571 0.938 88 0.8456 0.8627 0.951 10 0.9145 0.7170 0.914 45 0.8944 0.8302 0.938 88 0.8705 0.8889 0.806 67 0.7560 0.7193 0.813 33 0.7065 0.6441 0.862 20 0.8336 0.8673 0.870 05 0.8482 0.8595 0.877 72 0.8358 0.7879
Nnet 0.8978 0.8699 0.9170 0.9133 0.9532 0.9353 0.9429 0.9371 0.9420 0.9489 0.9037 0.9496 0.9065 0.9571 0.9118 0.8421 0.8846 0.8772 0.8519 0.8727 0.7869 0.8305 0.7692 0.8444 0.8661
ENS1 0.9058 0.9138 0.9327 0.9133 0.9335 0.9193 0.9136 0.9067 0.9203 0.9566 0.9044 0.9149 0.8752 0.9350 0.9230 0.8868 0.8452 0.9197 0.8901 0.9283 0.7840 0.8033 0.7967 0.9008 0.8636
ENS2 0.9058 0.9138 0.9327 0.9133 0.9335 0.9373 0.9271 0.9067 0.9476 0.9465 0.9271 0.9149 0.8836 0.9476 0.9355 0.8865 0.9267 0.9510 0.9267 0.9388 0.8229 0.8385 0.8540 0.9249 0.9052
ENS-B 0.8750 0.9058 0.9327 0.8902 0.9242 0.9271 0.9373 0.8605 0.9679 0.9275 0.9271 0.9044 0.8940 0.9476 0.8922 0.8341 0.8470 0.8879 0.8497 0.9388 0.8090 0.8105 0.8682 0.9113 0.8980
Fig. 3. Comparison between the individual classifiers and the ensembles using all metricss
534
L. Moreira-Matias et al.
Table 5. Performance obtained from the seven considered algorithms on the 25 blocks extracted using the Micro-Averaged F1-Measure Block DS1-1 DS1-2 DS1-3 DS1-4 DS1-5 DS2-1 DS2-2 DS2-3 DS2-4 DS2-5 DS3-1 DS3-2 DS3-3 DS3-4 DS3-5 DS4-1 DS4-2 DS4-3 DS4-4 DS4-5 DS5-1 DS5-2 DS5-3 DS5-4 DS5-5
5.2
SVM 0.9241 0.9306 0.9429 0.9362 0.9296 0.9504 0.9420 0.9371 0.9420 0.9333 0.9504 0.9429 0.9371 0.9571 0.9254 0.8400 0.9057 0.9259 0.8627 0.9057 0.7521 0.7387 0.8235 0.8527 0.8615
kNN 0.9167 0.9150 0.8923 0.9041 0.8921 0.9571 0.9275 0.9371 0.9118 0.9565 0.8722 0.9496 0.8741 0.9583 0.9037 0.8571 0.7586 0.8727 0.8400 0.8077 0.6903 0.6182 0.7899 0.8254 0.8125
NB 0.6720 0.7442 0.6822 0.5496 0.7218 0.8594 0.8264 0.8308 0.8504 0.8943 0.8957 0.8415 0.9139 0.7619 0.8026 0.8571 0.8627 0.7170 0.8302 0.8889 0.7193 0.6441 0.8673 0.8595 0.7879
Nnet 0.9241 0.9091 0.9333 0.9362 0.9650 0.9353 0.9429 0.9371 0.9420 0.9489 0.9037 0.9496 0.9065 0.9571 0.9118 0.8421 0.8846 0.8772 0.8519 0.8727 0.7869 0.8305 0.7692 0.8444 0.8661
ENS1 0.9315 0.9371 0.9496 0.9362 0.9510 0.9420 0.9437 0.9371 0.9412 0.9710 0.9362 0.9429 0.9155 0.9571 0.9385 0.8235 0.7860 0.8772 0.8302 0.8889 0.7840 0.8033 0.7967 0.9008 0.8636
ENS2 0.9315 0.9371 0.9496 0.9362 0.9510 0.9571 0.9504 0.9371 0.9640 0.9635 0.9504 0.9429 0.9231 0.9640 0.9559 0.8302 0.8846 0.9259 0.8846 0.9057 0.7937 0.8033 0.8167 0.9173 0.8906
ENS-B 0.9103 0.9315 0.9496 0.9200 0.9444 0.9504 0.9571 0.9091 0.9778 0.9466 0.9504 0.9362 0.9296 0.9640 0.9265 0.7547 0.7692 0.8421 0.7500 0.9057 0.7778 0.7705 0.8333 0.9023 0.8837
Discussion
Some of the results presented confirm previous studies [2, 4, 7]: Fig. 3 shows that SVM performs, on average, better than kNN and NB algorithms, confirming the good results of SVM for binary classification, as reported in the literature [4]. It does not share this characteristic with the other two classifiers which are known for their good results in multi-class problems. However, several comparative studies in TC also compare algorithms known as good binary classifiers against other algorithms known as good multi-class classifiers [2, 4, 7]. It is possible to conclude directly from Table 4 and Table 5 that both ensembles (ENS1 and ENS2) present, in all datasets, better or equal results than the best base classifier. Anyway, all classifiers presented an excellent performance for the datasets considered (all F1- measure values are above 78%). The ensembles built also present a superior performance to our baseline ensemble – ENS-b, the majority class one – in both metrics considered. On average, our best ensemble ENS2 performed 2.04% better than the best individual classifier in each block (using the F1-macro aver. metric).This methodology presents two advantages that distinguish it among other ensemble approaches also used in TC. Firstly, it can be run using parallel computing: the classifiers can operate independently in different machines and the results can be
Text Categorization Using an Ensemble Classifier
535
Table 6. On the right hand, thee ranks of the Friedman test. On the left hand, the F1 obtainedd for each fold considered Block DS1-1 DS1-2 DS1-3 DS1-4 DS1-5 DS2-1 DS2-2 DS2-3 DS2-4 DS2-5 DS3-1 DS3-2 DS3-3 DS3-4 DS3-5 DS4-1 DS4-2 DS4-3 DS4-4 DS4-5 DS5-1 DS5-2 DS5-3 DS5-4 DS5-5
SVM M 0.8950 0.90 044 0.9230 0.9133 0.90 037 0.9271 0.9140 0.90 067 0.9140 0.90 034 0.9271 0.9149 0.90 067 0.9373 0.8932 0.90 024 0.9388 0.9510 0.9145 0.9388 0.80 067 0.8133 0.86 620 0.8705 0.8772
Data Group ENS2 0.9058 0.9138 0.9327 0.9133 0.9335 0.9373 0.9271 0.9067 0.9476 0.9465 0.9271 0.9149 0.8836 0.9476 0.9355 0.8865 0.9267 0.9510 0.9267 0.9388 0.8229 0.8385 0.8540 0.9249 0.9052
ENS-B 0.8750 0.9058 0.9327 0.8902 0.9242 0.9271 0.9373 0.8605 0.9679 0.9275 0.9271 0.9044 0.8940 0.9476 0.8922 0.8341 0.8470 0.8879 0.8497 0.9388 0.8090 0.8105 0.8682 0.9113 0.8980 Average:
Friedman Rank SVM ENS2 ENS-B 2 1 3 3 1 2 3 1.5 1.5 1.5 1.5 3 3 1 2 2.5 1 2.5 3 2 1 1.5 1.5 3 3 2 1 3 1 2 2 2 2 1.5 1.5 3 1 3 2 3 1.5 1.5 2 1 3 1 2 3 1 2 3 1.5 1.5 3 2 1 3 2 2 2 3 1 2 2 1 3 2 3 1 3 1 2 3 1 2 2.22 1.52 2.26
Fig. 4. Posst-Hoc Analysis for the considered algorithms
536
L. Moreira-Matias et al.
concentrated in a single computer to ensemble them, saving processing time – many state-of-art ensemble methodologies (e.g., boosting) have not such characteristic. For a large set of text documents, this characteristic can provide a true major advantage versus the majority of the ensemble frameworks proposed in TC [5, 6, 12, 13]. Secondly, we can extract several statistics from the obtained clusters. These statistics can be useful to validate the results that, commonly, are not possible to obtain neither using other ensemble methods. In Table 7 we present three evaluation metrics for the clusters obtained in our datasets. We used the clusters.stats function on the [fpc] R package to proceed with this experiments. The Pearson Gamma [15] (normalized gamma) is a metric that measures the correlation between the distances and a 0-1 vector where 0 means the same cluster and 1 for different clusters. The Entropy [16] (also called variation of information) measures the amount of information lost and gained in changing from clustering C to clustering C’. The Dunn index [14] aims to identify dense and well-separated clusters. The clusters obtained present, in general, a good quality. We want to enhance the high correlations obtained in the Pearson Gamma to justify it. However, there are several types of metrics that can be extracted. To see more about this issue, the author should read the section 4 in [15]. Such metrics can be accurately used to detect new and/or unknown categories in the system (i.e. novelty detection [26]). The ensemble with the best performance is the ENS2. This ensemble only uses kNN, NNET and SVM-linear classifiers while ENS1 has an additional base classifier: NB. Since NB is globally the worst among the four base classifiers (Fig. 3), this explains the worse results of ENS1 against ENS2. Despite these results, the authors believe that increasing the number of distinct algorithms used in the ensemble will increase its accuracy but we cannot sustain this based in this specific study. Some questions remain open: 1) are all the base classifiers of the ensemble useful in all the input space or better results could be obtained by selecting locally the subset of classifiers to predict each given example? 2) Can MECAC be useful in other binary classification problems than TC ones? 3) Can we use the extracted statistics to do novelty detection on the system categories? The dynamic selection of classifiers is an issue already explored in other research areas [27]. The multi label classification is an important problem in TC that can be addressed by MECAC…but how well does it performs in that contest? The novelty detection in TC is not a new topic [26] but can our methodology be also accurate in such task? All these issues should be explored for TC in our future research. Table 7. Statistics about the clusters obtained using co-mean association matrix ensemble method DataSet DS1 DS2 DS3 DS4 DS5
PearsonGamma
Dunn
Entropy
0.8578 0.8894 0.8330 0.9371 0.8829
0.5714 0.5714 0.5714 0.6667 0.5000
0.6249 0.6320 0.6273 0.5771 0.6852
Text Categorization Using an Ensemble Classifier
6
537
Conclusions and Future Work
In this paper, we proposed a new ensemble method for classification to improve the accuracy of TC (single-label documents to be categorized into a binary classification problem). The MECAC (Ensemble Classification using Mean Co-Association Matrix) algorithm uses the mean co-association matrix, usually used in consensual clustering problems [8]. We have used this method for the resolution of a TC problem. However, it can be used for the resolution of any binary classification problem. Different base learners can be used. At author’s best knowledge, such approach was never considered for classification and, consequently, it was never considered for TC problems. To test it, we decided to use four different classifiers with the same preprocessing and parameters: k Nearest Neighbors, Neural Networks, SVM with a linear kernel and Naïve Bayes. We compared it with three different ensembles: a common baseline, ENS-B that uses the majority class voted among all individual classifiers; ENS1, that used all the referred classifiers as input of our methodology and ENS2 that used all like ENS1 except Naïve Bayes. Finally, we compared those using well known accuracy metrics (both macro and micro averaged F1- measure and Cohen-K) on five datasets of interest. This research pointed out two advantages of this methodology over other ensembles used in TC: 1) it can be run using parallel computing - which other commonly used TC ensemble classifiers cannot - and (2) we can extract useful statistics from the obtained clusters , that are not available neither using other ensemble approaches nor using individual classifiers. Our results also demonstrated that our methodology is a real contribution to the practical application of TC: our ensemble performed on average 2.04% better than the best individual classifier and this results were statistically validated using a significance level of 0-05. In author’s opinion, this methodology still has some points to work out in its different steps like 1) pruning classifiers by choosing them dynamically for each given example or 2) reduce the well-known k-means’ random start effects. However, we want to highlight the main contribution of this work: the introduction of the mean co-association matrix is a new and unused way to simultaneously measure the similarities between a pair of text documents and to define an ensemble of classifiers, improving the decision process. The work in this paper is a validation of this concept. Therefore, our studies pointed out new issues on this research topic: • How this approach performs in other problems than TC? • Can this approach be successfully adapted for multi-class problems? • How can we use this statistics to find out when you need to create new categories in our system? The last question is important to highlight one possible main advantage of MECAC facing other ensembles in a TC streaming classification problem over the time: in author’s opinion, the obtained clusters can also be used to discover whether it is
538
L. Moreira-Matias et al.
necessary to create a new category for a new sample. It could be done using the extracted metrics like it is proposed in other novelty detection research works [9]. Experiments will be carried out to proceed with this work. Acknowledgements. We would like to thank the support of the project Knowledge Discovery from Ubiquitous Data Streams (PTDC /EIA-EIA/098355/2008).
References 1. Yang, Y., Pedersen, J.: A Comparative Study on Feature Selection in Text Categorization. In: ICML 1997, pp. 412–420 (1997) 2. Yang, Y., Liu, X.: A Re-Examination of Text Categorization Methods. In: 22nd Annual International ACM SIGIR Conference on Research and Development in Information Retrieval, pp. 42–49 (1999) 3. Yang, Y.: An Evaluation of Statistical Approaches to Text Categorization. Information Retrieval 1, 69–90 (1999) 4. Colas, F., Brazdil, P.: Comparison of SVM and Some Older Classification Algorithms in Text Classification Tasks. In: Artificial Intelligence in Theory and Practice, pp. 169–178 (2006) 5. Cho, S., Lee, J.: Learning Neural Network Ensemble for Practical Text Classification. In: Liu, J., Cheung, Y.-m., Yin, H. (eds.) IDEAL 2003. LNCS, vol. 2690, pp. 1032–1036. Springer, Heidelberg (2003) 6. Bi, Y., Bell, D.A., Wang, H., Guo, G., Greer, K.: Combining Multiple Classifiers Using Dempster’s Rule of Combination for Text Categorization. In: Torra, V., Narukawa, Y. (eds.) MDAI 2004. LNCS (LNAI), vol. 3131, pp. 127–138. Springer, Heidelberg (2004) 7. Zhang, T., Oles, F.: Text Categorization Based on Regularized Linear Classification Methods. Information Retrieval 4, 5–31 (2001) 8. Monti, S., Tamayo, P., Mesirov, J., Golub, T.: Consensus Clustering: A Resampling-Based Method for Class Discovery and Visualization of Gene Expression Microarray Data. Machine Learning 52, 91–118 (2003) 9. Bottcher, M., Hoppner, F., Spiliopoulou, M.: On Exploiting the Power of Time in Data Mining. SIGKDD Explor. Newsl. 10, 3–11 (2008) 10. http://www.daviddlewis.com/resources/testcollections/reuters 21578/ 11. Khan, A., Baharudin, B., Lee, L., Khan, K.: A Review of Machine Learning Algorithms for Text-Documents Classification. Journal of Advances in Information Technology 1 (2010) 12. Joachims, T.: A Probabilistic Analysis of the Rocchio Algorithm with TFIDF for Text Categorization. In: 14th International Conference on Machine Learning, ICML 1997, pp. 143–151 (1997) 13. Nardiello, P., Sebastiani, F., Sperduti, A.: Discretizing Continuous Attributes in AdaBoost for Text Categorization. Advances in Information Retrieval (2003) 14. Dunn, J.: Well-Separated Clusters and Optimal Fuzzy Partitions. Journal of Cybernetics 4, 95–104 15. Halkidi, M., Batistakis, Y., Vazirgiannis, M.: On Clustering Validation Techniques. Journal of Intelligent Information Systems 17, 107–145 (2001) 16. Meila, M.: Comparing clusterings–an information based distance. Journal of Multivariate Analysis 98, 873–895 (2007)
Text Categorization Using an Ensemble Classifier
539
17. R Development Core Team: R: A Language and Environment for Statistical Computing., Vienna, Austria (2005) 18. Salton, G., Allan, J., Buckley, C., Singhal, A.: Automatic analysis, theme generation, and summarization of machine-readable texts. Readings in Information Retrieval, 478–483 (1997) 19. Rogati, M., Yang, Y.: High-performing feature selection for text classification. In: Proceedings of the Eleventh International Conference on Information and Knowledge Management, pp. 659–661. ACM, McLean (2002) 20. Venables, W., Ripley, B.: Modern Applied Statistics with S, New York, USA (2002) 21. Chang, C., Lin, C.: LIBSVM: A library for support vector machines. ACM Transactions on Intelligent Systems and Technology 2, 1–27 (2011) 22. Hornik, K., Buchta, C., Zeileis, A.: Open-source machine learning: R meets Weka. Computational Statistics 24, 225–232 (2009) 23. Sebastiani, F.: Machine learning in automated text categorization. ACM Comput. Surv. 34, 1–47 (2002) 24. Cohen, J.: A Coefficient of Agreement for Nominal Scales. Educational and Psychological Measurement 20, 37–46 (1960) 25. Iman, R., Davenport, J.: Approximations of the critical region of the Friedman statistic. Communications in Statistics 571–595 (1980) 26. Yang, Y., Zhang, J., Carbonell, J., Jin, C.: Topic-conditioned novelty detection. In: 18th ACM SIGKDD International Conference on Knowledge Discovery and Data Mining, Edmonton, Canada, pp. 688–693 (2002) 27. Mendes-Moreira, J., Jorge, A.M., Soares, C., de Sousa, J.F.: Ensemble Learning: A Study on Different Variants of the Dynamic Selection Approach. In: Perner, P. (ed.) MLDM 2009. LNCS, vol. 5632, pp. 191–205. Springer, Heidelberg (2009)