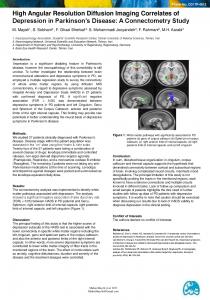
Fig 1 : The thalamus segmentation on ODF. Fig 2 : The thalamic nuclei clustering. Pulvinar. Lateral. Anterior. Medial. Proc. Intl. Soc. Mag. Reson. Med. 16 (2008).
Thalamic nuclei clustering on High Angular Resolution Diffusion Images A. Grassi1, L. Cammoun1, C. Pollo2, P. Hagmann3, R. Meuli3, and J. P. Thiran1 Signal Processing Institute, Ecole Polytechnique Federale de Lausanne, Ecublens, Lausanne, Switzerland, 2Department of Neurosurgery, 3Department of Radiology, Centre Hospitalier Universitaire Vaudois and University of Lausanne, Switzerland
1
Introduction Thalamic nuclei can be distinguished by their characteristic fiber orientations, which influence the diffusion. Fiber orientations are relatively aligned within a nucleus due to the fact that the cerebrocortical striations within a nucleus all target the same region of cortex. The number of thalamic nuclei reported with histological methods varies with the method employed, although most cyto/myeloarchitectonic stains identify 14 major nuclei. We present a new approach for thalamic nuclei segmentation on High Angular Diffusion Resolution Images (HARDI), performed with a constrained k-means clustering. As described by John D.Carew[1], it is possible to classify HARDI data based on the shape of the diffusion, thanks to the complex information coming from them. Mette R. Wiegell[2] proposed a thalamic nuclei clustering with k-means on diffusion tensor images, using a combination of a voxel distance and a diffusion tensor distance. In the same way, we use the k-mean algorithm with a weighted sum of two distances to cluster the thalamic nuclei on HARDI data.
Material and Methods The Q-ball images were obtained with a 3T clinical MRI scanner Achiva Philips. The data were produced with diffusion weighted single-shot EPI sequence. Diffusion weighting was performed along 66 axis using a b-value of 7000 s/mm2 at maximum gradient field of 80 mT/m. Timing parameters were a TR of 3400s and a TE of 135s with a total acquisition time of 11:21(min). In total 20 axial slices in a 128 by 128 matrix size centered on the thalamus and covering the frontal lobes. The voxel size was 2mm by 2mm with a slice thickness of 3mm without gap. The Q-space is sampled over a sphere by varying the diffusion orientation u(φ,θ), hence producing an Orientation Distribution Function (ODF) in every voxel by Funk-Radon transformation (Tuch[3]). Due to the symmetry of the diffusion data only a hemisphere was reconstructed:
(ϕ , ϑ ) ∈
π⎫ ⎧ π ⎧ π ⎫ ⎨ 0, ,..., π − ⎬ × ⎨ 0, ,..., π ⎬ n⎭ ⎩ n ⎩ n ⎭
where n, equal to 18, is the sampling step. Starting from the thalamus segmentation previously obtained, using the level set framework in POS[4], the structures around it are masked. Fig 1 : The thalamus segmentation on ODF The k-means algorithm requires to specify a distance metric on the data space, the number of clusters thought to reside in the data, the initial position of the cluster centroids and a convergence criterion. Pulvinar The distance metric is a dissimilarity measure; enabling the minimization of total intra-cluster Lateral variance. The centroids are representative points of the local neighborhood of the data. The voxels are grouped into k classes based on their distance to each class centroid. The centroids are updated with the k-medoids method: for a given cluster Si, the centroid is the observation in the cluster minimizing total distance to other points in that cluster. The centroids are updated iteratively until stabilization Anterior within two successive iterations. The distance between voxels is defined as a linear combination of the Euclidian voxel distance and the Medial difference in the diffusion’s shape for which we chose the Frobenius distance. More specifically, the position diffusion distance Ejk between a voxel j and a centroid k was taken as a linear combination of these voxels positions distance and their ODF distance. As we are interested in the shape of the ODFs, and not in the diffusion intensity, the distance measure should satisfy the scale invariance. For this reason each ODF was normalized by the integral on the semi-sphere. Fig 2 : The thalamic nuclei clustering The weighting factor γ, which controls the trade-off between the voxel location distance and the diffusion distance, is set equal to 5·10-4 we chose empirically the smallest value which connected disjointed boundaries into closed contours. The first step was the clustering of 4 principal regions of the thalamus: anterior, lateral, medial and Pulvinar. The clusters' initialization is obtained by selecting a voxel in the most external parts of each region. The selection is done on a central slice of the thalamus, to be sure of the presence of all the regions. After this first classification, we go along with the identification of three others thalamic nuclei inside the lateral region. The convergence is very fast (about 4-5 iterations).
Results We identified six different regions, which project fibers in different areas. The results were validated visually by an expert (Dr. Pollo): we overlap the segmented nuclei on the anatomical MRI (T1) of the subject; we transform them to the AC-PC reference system to make possible the comparison with an atlas. The result is therefore overlapped with some slices of the digital atlas (Schaltenbrand Wahren stereotactic atlas) corresponding to the central slices of the thalamus. To see this method robustness, we tested it with different initializations on the same brain, but also on other 4 different datasets and the results were satisfactory.
Conclusion The clustering of thalamic nuclei with k-means has allowed a first identification of six principal areas, which project in different directions on the cortex. It is a further proof of the information power of these High Angular Resolution diffusion Images. We have explored a possibility of thalamic nuclei clustering directly from Qball data with a modified k-means algorithm, using as distance metric, a combination of the Euclidean and the Fobrenius distance.
References [1] John D. Carew, Tech. Rep.1103,Univ. Wisconsin (2005). [2] Mette R. Wiegell et al., NeuroImage (2003). [3] David S. Tuch. Magnetic Resonance in Medicine (2004). [4] Lisa Jonasson et al. Information Processing in Medical Imaging (2005).
Proc. Intl. Soc. Mag. Reson. Med. 16 (2008)
1777