The Application of Data Mining in Bridge Monitoring Projects Exploiting Time Series Data of Structural Health Monitoring
Ernst Forstner, Helmut Wenzel BRIMOS® – Bridge Monitoring System VCE Holding GmbH Vienna, Austria
[email protected],
[email protected] Abstract — Since the first attempts of Structural Health Monitoring the Vienna Consulting Engineers (VCE) have been involved to advance the BRIMOS technology which offers a wide range of services to engineers and operators of infrastructure networks. Over the last decade the dynamic behavior of hundreds of structures has been measured and evaluated. However, the current practice in Structural Health Monitoring is still a case to case approach which needs a lot of experience for proper interpretation and assessment of the investigated objects. The integration of new technologies is wanted to support and automate the evaluation process as well as increase the objectivity within the assessment routines. This paper shall indicate the need for innovate methods and tools from a user’s point of view and gives a short insight to the workflow and infrastructure of BRIMOS. The efforts which are undertaken within the BRIMOS infrastructure show the approach towards the application of data mining instruments to benefit for future and also from past monitoring projects. Datamining, Time Series Structural Health Monitoring
I.
Analysis,
Knowledge
Base,
INTRODUCTION
The strong commitment of VCE to increasingly apply dynamic investigation methods for condition assessment of civil structures brought up the BRIMOS® technology. BRIMOS® (BRIdge MOnitoring System) can be defined as a method for system identification and damage detection in structures due to its dynamic response to ambient excitation such as wind, traffic and micro seismic activity. The term Structural Health Monitoring in the mean of Ambient Vibration Monitoring comprises the recording of the dynamic behavior by the use of measuring instruments as well as the evaluation and analysis of the measured signals. The fundamental tools of health monitoring are system identification (SI), damage determination and localization as well as safety assessment of infrastructure. The analysis provides the determination of the modal parameters, namely the structure’s natural frequencies, its mode shapes and its damping coefficients as well as the vibration intensity. These parameters which are gained from the measurements represent the real condition of a structure and are used to update mathematical models of a structure or
are simply compared to reference data from earlier measurements. The measurements are, however, so precise that they can offer reference data with a high qualitative value for every future evaluation method. II.
STATE-OF-THE-ART IN STRUCTURAL HEALTH MONITORING
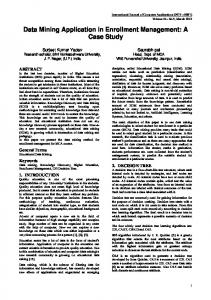
Within the infrastructure of road and rail networks the bridge structures are representing a special status over the whole lifetime of up to more than 100 years. Lifecycle management of these structures is charactized by individual design, uncertities in the construction quality and changing performance requirements such as increasing traffic loads. Ongoing condition assessment over the entire lifetime is performed to meet the high safety requirements and the increasing need for cost effective bridge maintenance. Related engineering services are visual inspections and chemical or mechanical material tests. In recent years, measurements of the dynamic behaviour of bridges and identification and evaluation, are used to judge its structural integrity. A. Natural Frequency and Mode Shapes For the determination of the natural frequencies of civil structures, the frequency spectra of the Fast Fourier Transforms are used, to calculate amplitude spectra. Figure 1. represents the amplitude spectra of the vertical acceleration of the channels from a synchronized measurement with seven sensors. The acceleration signals in frequency domain clearly show the dependency between amplitudes and sensor location. This results from the fact that sensors may be located close to a node of the modeshape.
Brimos005_S1_Z Brimos008_S1_Z
Brimos001_S1_Z Brimos009_S1_Z
Brimos003_S1_Z
Brimos004_S1_Z
Brimos006_S1_Z
µg 60.0 57.5 55.0 52.5
damping values are extracted from Random Decrement Signatures (RDS) which are determined by the Random Decrement Technique (RDT) developed by Henry A. Cole, NASA [3].
50.0 47.5 Brimos005_S1_Z
45.0
Brimos001_S1_Z
Brimos003_S1_Z
Brimos004_S1_Z
Brimos006_S1_Z
µm 35
42.5 40.0
30
37.5 25
35.0 32.5
20
30.0 15
27.5 25.0
10
22.5 20.0
5
17.5
0
15.0 12.5
-5
10.0
-10
7.5 5.0
-15
2.5 0.0
-20
0.0
0.5
1.0
1.5
2.0
2.5
3.0
3.5
4.0
4.5
5.0
5.5
6.0
6.5
7.0 Hz
-25 -30
Figure 1. Amplitudes Spectra (Frequency)
-35 0.0
To overcome this actuality of hidden natural frequencies and facilitate the system identification, it is common practice, to merge the frequency spectra of several channels by averaged normalized power spectral densities (ANPSD) [2]. In Figure 2. the ANPSD of the seven acceleration channels of Figure 1. is shown.
0.5
1.0
1.5
2.0
2.5
3.0
3.5
4.0
4.5
5.0
5.5
6.0 s
Figure 3. Random Decrement Signatures
A RDS as shown in Figure 3. is to be understood as averaged short signature calculated with random decays of a harmonic oscillation from the measurement file in time domain. C. Vibration Intensity
ANPSD vertikal
30 28 26 24 22 20 18 16 14 12 10 8 6 4 2 0 0.0
0.5
1.0
1.5
2.0
2.5
3.0
3.5
4.0
4.5
5.0
5.5
6.0
6.5
7.0 Hz
Intensive dynamic loading causes fatigue-failure of structures. The vibration intensity represents the energyimpact into the building. The analysis of the vibration intensity is the relation between the structure’s eigenfrequencies and its corresponding oscillation amplitude. As a basic principle lower amplitudes are permissible for higher eigenfrequencies. If the oscillation amplitudes exceed a limit, damage by vibration based overstraining (fatigue) to the structure or to structural elements has to be expected due to vibration stress. The vibration intensity diagram shown in Figure 4. is subdivided into 4 zones, ranging from low probability of damage due to dynamic stress (Zone I) up to very high probability of damage (Zone IV) - (Classification after C. F. Beards 1996 [5]).
Figure 2. ANPSD
Damping values can also be determined by the records, which are a good indicator for potential damages in the structure. After excitations – for example by the passage of heavy vehicles – a numerical value for damping is calculated. This damping value represents the ability of the structure to dissipate applied energy. It has been seen that the free decay method is a convenient way for assessing the damping in a structure. In the BRIMOS® technology these
Amplitude
B. Damping Coefficiencts
10000
1000 III
IV
100 I
II
10 0.1
1
10
100
Frequenz
Figure 4. Vibration Intensity diagramm
1000
III.
BRIMOS® INFRASTUCTURE
VCE has developed the tools which are needed for their Structural Health Monitoring campaigns such as measurement equipment, data format, data management and evaluation software. •
• •
•
Data Acquisition: The sensor network used for Structural Health Monitoring is basically setup from a high number of accelerators to acquire the dynamic behavior of a bridge structure. Furthermore sensors for the recording of environmental conditions, such wind, temperature, radiation, etc are used. Different data acquisition systems are used depending on the measurement duration which can be a few minutes (short term measurements) up to several years (permanent monitoring). Data Format: An own binary data format has been developed for easy handling of time series data. BRIMOS® Data Base: A database is used to manage information related to the structure, structural elements and the measurement. Also information relevant for the evaluation, such as measurement sensor layout or channel parameters is retrieved from the data base during the evaluation. The measurement data is stored on a file server and referenced in the BRIMOS® database. BRIMOS® Data Evaluation Software: The Evaluation Software is capable to calculate and visualize the frequency spectra, mode shapes, damping values, frequency intensity and energy levels of the measurement signals and allow the study and assessment of the investigated structure. IV.
OUTLINE OF THE EVALUATION PROCESS
The evaluation of the dynamic behavior represents the actual engineering service of Structural Health Monitoring projects. This step involves the analysis of the measurement data as well as the assessment of the structure based on the determined modal analysis. Generally, a huge amount data is produced during the measurement campaign which needs to be pre-processed, filtered, classified and consolidated in order to provide a set of meaningful results. This step has to be understood as a more or less iterative process with modified evaluation parameters and changing extractions from the measurements.
Measument Data Related Information (DB)
Data Selection and Settings for Analysis
BRIMOS® Data Analysis / Visualizing and Interpretation of the Modal Parameter
Assessment and Storing of “final” results (DB)
Figure 5. Steps during Evaluation Process
The intensive process of data evaluation is a very timeconsuming procedure but is very accepted because it enables the engineer to understand the dynamic behavior of the bridge structures in its detail. V.
CHANGES IN THE EVALUATION APPROACH TOWARDS INNOVATIVE TECHNOLOGIES
As previously highlighted a change in the evaluation process is required in terms of: • • • • •
reduction of analysis time increase of objectivity automation of pre-processing identifying of meaningful datasets utilizing knowledge gained from previous project (learning from history)
The evaluation process has been studied in detail and the following requirements have been identified as necessary. 1) The interaction with data mining tool shall not be done with time series data but with modal parameters. The modal parameters are representing the behavior of a structure in terms of vibrations. Routines for the determination of these parameters from the recorded time series have been well established. So far the application of data mining tools directly on sets of measurement files has been proven successful for identification of changes in long term measurements. However, principally the use of data mining in a large set of modal parameters, extracted from the measurement file, are more promising for the need in Structural Health Monitoring.
2) The process “BRIMOS® Data Analysis” and “Visualizing and Interpretation of Modal Parameters” shall be separated The BRIMOS® Data Analysis needs to be executed in order to provide modal parameters for the data mining. Therefore it is required to separate this process from the Visualization and Interpretation of modal parameters. As a result, the knowledge gained by means of data mining, can be used for “Visualization and Interpretation of the modal parameter”. 3) The BRIMOS® Data Analysis shall be implemented extensively and highly automated The definition of settings for the data analysis and the selection of time frames is already reducing the range of results which consequently are not made available for data mining. It is desired to have a wide range of results generated in a highly automated process. 4) The modal parameters gained from the Data Analysis need to be managed in the BRIMOS® Data Base A well-organized access to the data sets of modal parameter is to be ensured. Therefore the data model of the BRIMOS® database has been extended accordingly. VI.
RELATED WORK/STUDIED STRUCTURES
Two bridge structures from previous monitoring campaigns have been chosen to prove the new approach towards innovative technologies during the evaluation process.
Figure 6. Installation of Accelerators
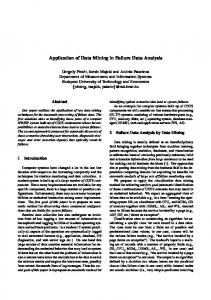
Time series of acceleration signals over a monitoring period of three month have been used to set up a basis of 25.000 data sets of natural frequencies, maximum amplitudes, vibration intensities of stay cables and environmental conditions such as temperature, wind speed and wind direction.
A. River Suir Stay Cable Bridge in Waterford, Ireland The River Suir Stay Cable Bridge is equipped with a permanent monitoring system to measure the vibration of six stay cables, environmental conditions as well as stress in the bridge deck. Stay Cables bridges are very slender structures and are often exposed to extreme wind and rain which can cause strong excitation of cables. Various phenomena with strong cable oscillations have been observed and studied over the past years. The events of strong cable vibrations are rather rare and data for detailed studies are limited. A main objective in permanent monitoring of stay cables is to learn from the characteristic behavior; even the oscillations are small and not critical. This approach is based on the conception that strong oscillations are caused by steady excitation effects which may arise from certain environmental conditions.
Figure 7. Correlation between maximum amplitude and wind speed [7]
B. Flyover Reibersdorf S101, Austria The flyover S101 is a typical pre-stressed concrete bridge from the early 1960ies. After fifty years the bridge did not meet the current requirements and the demolition of the structure was used for a progressive damage test. During the campaign several damage stages have been artificially introduced to the structure and measured in terms of Structural Health Monitoring. The results gained from various analyses have given a deep insight into the structural behavior and allowed also to verify well proven and new methodologies for the condition assessment of bridge structures. A new evaluation tool, the BRIMOS® Data Profiler has been developed to extract all relevant modal parameter from each single acceleration signal and organize the results in the extended BRIMOS® database. The data is currently used for studies of non-linear material characteristics. Main focus is the variation of damping coefficients in different energy levels which is achieved by using variable trigger levels within the Random Decrement Technique. In this context, perspective activities are further exploitation of the Random Decrement Signatures in further adaption of the BRIMOS® Infrastructure and i.e. the integration to Autoregressive Moving Average Models (ARMA) in system identification procedures [6].
REFERENCES [1] [2]
[3]
[4] [5] [6]
[7]
Wenzel H. (2009): Health Monitoring of Bridges; J. Wiley and Sons Ltd, ISBN0470031735; Chichester England Felber, A. – Development of a Hybrid Bridge Evaluation System, PhD Thesis, University of British Columbia, Vancouver, Canada, 1993. Henry A. Cole (1973): Online Failure Detection and Damping Measurements of Aerospace Structures by Random Decrement Signatures; NASA CR-2205; Washington D.C. 20546 Clough, R. W.; Penzien, J.: Dynamics of Structures. Second Edition, Mc Graw Hill 1993 Beards, C. F.: Structural Vibration-Analysis and Damping; Arnold (A Member of the Hodder Headline Group); London,GB, 1996 Haake, G.; Gerasch W.J.; Rolfes, R.; (2007)Tragstruktur – Dynamik des Gesamtmodells und Systemidentifikation; Tagungsband zum 5. Symposium Offshore-Windenergie, bau- und umwelttechnische Aspekte, Hannover, 18. April 2007 BRIMOS® Webinterface, Correlation Diagramm River Suir Stay Cable Bridge