Available online at www.sciencedirect.com
ScienceDirect Procedia - Social and Behavioral Sciences 111 (2014) 1142 – 1154
EWGT2013 – 16th Meeting of the EURO Working Group on Transportation
The application of dominance-based rough sets theory to evaluation of transportation systems Piotr Sawickia*, Jacek Żaka a
Logistics Division, Poznan University of Technology, 3 Piotrowo str., 60 -965 Poznań, Poland
Abstract The paper presents an original procedure of evaluation of a transportation system, resulting in its assignment into a predefined class, representing the overall standard of the considered system and the level of transportation service. The method relies on the application of the dominance-based rough set theory (DRST), allows for thorough data exploration, evaluation of informational content of the considered characteristics and generation of certain decision rules that support t he evaluation process. In the analysis different characteristics (criteria and attributes) describing various aspects of a transportation system operations are taken into account. The assignment of a transportation system to a specific quality class is performed based on the values of characteristics which are compared with the evaluation pattern, i.e. the set of decision rules generated through the analysis of customers’ opinions and expectations concerning a transportation system. The method is composed of three major steps, including: 1) identification of the most important characteristics, 2) generation of the evaluation pattern, and 3) assignment of the transportation system to the appropriate class. In the evaluation process five key components of a transportation system, including: transportation means, human resources, informational resources, transportation infrastructure and technical equipment as well as organizational rules are considered. © The Authors. Authors.Published Publishedby byElsevier ElsevierLtd. Ltd. © 2013 2013 The Selection and/or peer-review peer-review under underresponsibility responsibilityofofScientific ScientificCommittee Committee. Selection and/or Keywords: Dominance-based rough sets; Transportation systems, Evaluation method
1. Introduction 1.1. Definition and evaluation of a transportation system Any transportation system is a set of coordinated components , that provide an organized and controlled movement of passengers or goods from their orig ins to their destinations. Different authors recognize various
* Corresponding author. Tel.: +48-61-665-2249; fax: +48-61-665-2736. E-mail address:
[email protected]
1877-0428 © 2013 The Authors. Published by Elsevier Ltd.
Selection and/or peer-review under responsibility of Scientific Committee doi:10.1016/j.sbspro.2014.01.149
Piotr Sawicki and Jacek Żak / Procedia - Social and Behavioral Sciences 111 (2014) 1142 – 1154
1143
components of such a system, depending on the profile and major objective of their research (e.g. Papageorgiou and Pouliezos, 1998; Tarkowski et al., 1995). The authors of this paper suggest five key co mponents of a generic transportation system, including: transportation means and other supporting technical equipment, human resources (drivers, ad ministrative staff, management), information resources and means, transportation infrastructure (roads, depots, parking areas, terminals, garages), organizational rules of the system. Any transportation system operates in a certain business environment and thus must develop lin ks with this environment. It uses a transportation infrastructure being in a certain technical and economic condition to assure the transfer of goods and/or passengers by transportation means (fleet). Transportation system covers a certain area and operates in a diverse natural environ ment that may range fro m: land (road and rail) through water to air. It may also encompass various transportation modes, including: motor vehicles, trains, vessels and/or airplanes. A transportation system is appropriately designed to carry out specific transportation tasks and intended to guarantee the coordination of its key components. It is usually managed, used and controlled by a certain transportation operator, which is called a transportation service provider. This entity provides transportation services in and through this system. The evaluation of transportation projects, solutions and systems is a widely d iscussed topic ( Lee, 2000; De Brucker et al., 2011; Salucci and Delle Site, 2010). The most commonly used methodologies are Cost-Benfit Analysis - CBA (Marshall, 1920) and mu ltip le criteria analysis - MCA (Figueira et al., 2005). The former consists in calculating and comparing benefits and costs of a transportation project decision or system. Benefits and costs are expressed in a monetary terms and are adjusted fo r a t ime value of money. The latter involves a comprehensive, mu ltiple -dimensional analysis of transportation projects or systems. It allows for taking into account many evaluation aspects (criteria) and satisfying subjective interests of different stakeho lders. New trends in evaluation of transportation systems are presented in section 1.2. The key research issue in this paper is the comprehensive evaluation of a road freight transportation system. The evaluation serves as a description of its current state and/or measure of its potential for future development. 1.2. Literature review on transportation system evaluation The literature review has revealed certain new trends and approaches concerning the evaluation of transportation systems. In the recent years several research reports have been published concerning evaluation of: city logistics systems (Zhang and Wu, 2009; Yue and Peilin i, 2013), transportation systems with in the supply chain (Zhao and Xue, 2011) or distribution system (Sawicka and Zak, 2013), shipping systems (Lun et al., 2013) or trunk h ighway systems (Sun et al., 2013). Most of them concentrate on the overall evaluation of the considered system and propose either the synthetic, numerical representation of the system’s evaluation, position in the ranking or its classification. In many cases the evaluation of transportation systems is performed by the application of different artificial intelligence techniques, e.g. fuzzy systems and fuzzy logic (Zhang and Wu, 2009; Zhao and Xue, 2011; Yue and Peilini, 2012), mu ltiple criteria decision aid ing (Sawicka and Zak, 2013), entropy analysis (Sun et al., 2013) or using analytical formulations (Lun et al., 2013). Zhang and Wu (2009) propose certain principles concerning the evaluation of a city logistics system that can be easily incorporated in the analysis of any transportation system. They construct an overall evaluation index of non-determin istic (fuzzy) character that is based on expert, linguistic estimation of certain areas and activ ities of the analyzed system. The authors construct a three-level hierarchy in which the first level corresponds to the overall goal of the analysis, i.e.: the evaluation of the standard of system development. Second level constitutes major characteristics/fields to be evaluated, such as: infrastructure, efficiency, IT, service level, guarantee, while the third level is co mposed of sub-criteria. The index is a product of aggregated weights of all criteria with corresponding sub-criteria and their overall evaluations on a linguistic scale (excellent, good, med iu m, worst). Similarly to overall evaluations weights are also assigned by experts. The generated indexes result in the classification of the considered transportation/ logistics system.
1144
Piotr Sawicki and Jacek Żak / Procedia - Social and Behavioral Sciences 111 (2014) 1142 – 1154
Zhao and Xue (2011) develop a procedure of evaluating a transportation system as a key component of a global supply chain. They propose an evaluation index that identifies risk in the whole supply chain. Their approach has a similar h ierarchy scheme as presented by Zhang and Wu (2009) and is composed of: mega – criteria, such as: internal and external factors, supply chain network, cooperation, further extended into criteria, sub-criteria and factors. The authors combine A HP methodology and expert - based fuzzy evaluation to generate the global risk index for the system. Yue and Peilini (2012) similarly to previous research also utilize the concept of an overall measure to evaluate a transportation system. They construct a two-level h ierarchy for global evaluation. Each co mponent of the hierarchy and its importance is evaluated by experts using a five-g rade linguistic scale (fro m perfect to poor). These opinions are converted into digital form with application of fu zzy membership functions. Finally, the global evaluation of a transportation system is e xpressed as a sum of product weights and evaluations for corresponding components of the hierarchy. The research presented by Lun et al. (2013) deals with classification of shipping network in the analy zed region into specific classes. As opposed to the previous works the authors are independent fro m experts’ opinions and concentrate on analytical formu lation of the considered decision problem. Based on the distance between origins and destinations they calculate transportation external costs of container transportation using different shipping modes . Their definit ion of external costs includes: usage of barges and containers as well as environmental damage caused by shipping activities. Based on external cost approach Lun et al. classify the ports in the considered region into three classes: feeder ports, direct ports, and hub ports. Sun et al. (2013) concentrate on quantitative evaluation of the trunk or arterial highways management system. In the evaluation process they take into account financial and staffing aspects of transportation systems. The authors propose a quantitative method to evaluate the performance of three different structures of management of the highway system, i.e. vertical, regional and mixed vertical-regional. To do this they propose three different measures, including : graph entropy (GE), time efficacy entropy (TEE) and quality entropy (QE). They claim that GE is appropriate measure to evaluate the degree of centralization of an organization, TEE properly evaluates the uncertainty of command informat ion communication and QE well measures the informat ion transfer quality. Based on the values of these three measures they recommend the vert ical structure of trunk / arterial h ighway management system as the most suitable. The application of simu lation techniques and mu ltiple criteria decision making (MCDM) methods to evaluation of different redesign scenarios of the distribution system is proposed by Sawicka and Zak (2013). In their wo rk the authors assess the transportation system as a key component of the distribution system. They generate different redesign scenarios using object-oriented simulat ion and then by means of an original mult iple criteria stochastic decision aid ing method ELECTRE III-st ran k them fro m the best to the worst. The ranking of variants (alternative transportation – distribution solutions) is generated based on their assessment by a family of 7 criteria and with the applicat ion of a specific model of decision maker’s (DM’s) preferences. Finally, the winner of the ranking is recommended as the most desirable, compromise solution (redesign scenario). 1.3. Objective and content of the research As suggested by literature review co mplex analysis and evaluation of transportation operations is a less frequently considered topic. However, most of the research in th is area focuses on assessing the transportation services and its performance whereas an evaluation of a transportation system is a less frequently considered. The authors of this paper investigate thoroughly the problem of transportation system evaluation and carry out the system’s in-depth analysis. As a result they propose an original and universal method of the transportation system overall evaluation. The proposed method allows classifying any transportation system to one of the predefined classes and computing its global evaluation index, wh ich corresponds to the degree of customer’s satisfaction. This index quantifies the level of fu lfillment of customer’s requirements by each and all co mponents of the transportation system that provides a transportation service. The method is based on an assignment of such
Piotr Sawicki and Jacek Żak / Procedia - Social and Behavioral Sciences 111 (2014) 1142 – 1154
1145
a system to one of the predefined classes without necessity of transforming the original data on its performance. The assignment of a transportation system is based on the exp loration of customers’ opinions and their expectations concerning the system and the transportation service offered by the system. The major concept of the method relies on the application of data mining technique, which uses the principles of dominance-based rough set theory (DRST). The paper is composed of five sections. An introductory part includes general background of the considered topic, literature survey and definition of the research objectives. Section 2 defines the principles of the rough set theory and section 3 describes major steps of the proposed method. Section 4 is devoted to its application focused on the evaluation of the road fright transportation system. Finally, chapter 5 summarizes the paper and includes final conclusions. The references are attached at the end of the paper. 2. Research methodology The dominance-based rough sets theory - DRST (Greco et al., 1999) is an extension of the rough sets theory RST, orig inally proposed by Pawlak (1982). It is a mathematical tool for the analysis of imp recise and vague description of objects (actions). Both, RST and DRST use 4 categories of information, presented in the form of , where is a finite set of objects, called universe, an informat ion table. This table is a 4-tuple and represented by the rows of the table; Q = {q 1 , q 2 , . . . , q m } is a finite set of characteristics - colu mns of the and f is the information function table, V is the domain of characteristics q, expressed in the form: and assigned to each pair: object – characteristic , such that , i.e. characteristics with preference ordered do mains, and The set of characteristics is co mposed of criteria attributes , i.e. characteristics with non-ordered domains. Since two majo r categories of characteristics are distinguished, i.e. conditional characteristics – and , the informat ion system is defined as a decision table. In addition, decision characteristics , and the set of conditional attributes by , and denominating the set of conditional criteria by , the decision table is presented in the following form: . Analyzing the decision table , for two objects x, y U, where x represents reference objects and y compared objects one can define a binary relation R in the following form (Greco et al., 1999): (1) Assuming that the relation corresponds to two situations , i.e. object dominates ( ) fro m or object is indiscernible with ( ) fro m the perspective of the perspective of all considered criteria . Considering any object and relat ion one can define a set , which includes the all attributes , that do minate fro m the perspective of all criteria and are indiscernible fro m for all objects . is called a set of objects dominating object x, and . Similarly, attributes constitutes a set of those objects that are do minated by object fro m the point of view of and are indiscernible with fro m all attributes . is called a set of objects domiconsidered criteria nated by object , thus All decision characteristics constitute the partition of the universe into a fin ished number of categories . It is also assumed that: 1) each object belongs to one and only one , 2) all -classes are ordered according to an increasing importance of preferences, which category are preferred against objects in category if , . If an means that objects assigned to class object is assigned to class according to characteristic and its conditional part C outperforms conditional part of any other object assigned to class it generates a certain inconsistency in DRST. For this reason the notion of two categories of union of classes have been introduced, i.e. upward and downward unions of classes. Upward is a set of objects that belong to class or class more preferred than , while downward union of classes
Piotr Sawicki and Jacek Żak / Procedia - Social and Behavioral Sciences 111 (2014) 1142 – 1154
1146
union of classes is a set of objects that belong to class or class less preferred than . and object belongs without any doubt to the upward union of classes Taking into account if and for all objects dominating according to and indifferent with according . This means that object belongs without any doubt to if and a set of all such to . At the same time the set of objects constitutes a lower approximation of the upward union of classes constitutes the upper approximation of the downward union of classes objects that probably belong to . Upper and lower appro ximat ions of the upward unions of classes can be presented as follows (Greco et al., 1999, 2001): (2)
and
where
is a set of reference objects. Similar formulas can be developed for the downward unions of classes: and
(3)
The comparison of upper and lower appro ximations of the union of classes results in the definition of the area . The boundary region for the upward union of classes is defined of uncertainty, called the boundary region and for the downward union of classes as: as: Evaluating the consistency and quality of information about objects in the decision table two measures i.e. accuracy of appro ximation and quality of sorting, can be defined. The accuracy of approximation of the union of classes is defined as a ratio of the number of objects (card) appropriately assigned to a specific union of classes and those that can be probably assigned to this union ; it expresses the precision of available knowledge about the 1 or 1, then the union of classes is considered classes belonging to the union of classes. If to be precise (consistent) fro m the point of v iew of characteristics of . If then, the union of classes is approximate fro m the point of view of characteristics in . All the objects that are and fro m consistent with the concept of the upward and downward unions of classes, based on relation , are defined as -right sorted objects. These objects do not belong to any boundary region perspective of or . of the union of classes is the relation between the number of -right sorted objects ( ) and a number Quality of sorting of all objects in , which can be formulated by formula (4): (4) Based on the definition of the quality of sorting one can search for the possibility of reducing the amount of superfluous informat ion enclosed in the decision table . It is assumed that eliminating certain informat ion fro m the decision table is possible when it does not deteriorates the informational value of the init ial decision table. As , is a result of identification of necessary and unnecessary characteristics the reduct, denominated by , for wh ich the quality o f constructed. The reduct is co mposed of the minima l number of characteristics The intersection of all the reducts is called the core. sorting satisfies condition: An important element in the rough sets theory is the generation of decision rules, based on the lower and upper approximat ions of the union of classes constituting determin istic (exact) and nondeterministic (appro ximate) ru les, respectively. In general, each decision rule is a logical statement co mposed of a conditional part and a decision part in the form: “if…, then…”. The conditional part includes the values and description of several characteristics of the object while the decision part defines the assignment of the object to one o r to several unions of classes. Two quantitative measures , called absolute and relative strength of the generated rules , characterize their importance and classification suitability. The absolute strength of the rule defines the number of objects in the decision table that are consistent with the conditional part of the rule. The relative strength of the decision rule is the relationship between the absolute strength of the rule and the number of objects in the decision table that constitute the lower approximation of the union of classes, pointed out by the decision part of the rule.
Piotr Sawicki and Jacek Żak / Procedia - Social and Behavioral Sciences 111 (2014) 1142 – 1154
1147
The generated decision rules are used to search for the recommended assignment of new objects to decision classes. This assignment is based on the comparison of the values of characteristics in the decision part of the decision rule with the values of characteristics of a new object. In the literature d ifferent methods of assigning objects to single classes exist. In this art icle an original approach proposed by Sawicki (2003) is applied. The concept of the proposed assignment is based on the redefinition of the relative strength of the decision rule and . It characterizes the credibility of assigning object introduction of the index of assignment credibility or downward union of classes. The index is defined to a single class , being a component of upward as follows: (5) for decison class
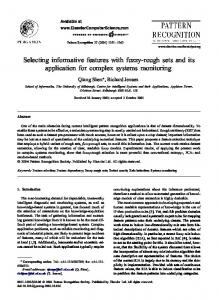
, where: defines the set of objects supporting decision ru le and belonging to , with in the union class or indicated by a decision rule ; and is the subset of objects in wh ich all elements of the conditional part of the decision rule have a deterministic character and correspond to the description of object . The final decision regarding the is made based on the maximu m value of the assignment of an object to one of the decision classes 3. The method of evaluation of a transportation system 3.1. The concept of the method The major feature of the method is the assignment of a transportation system to one of six predefined classes representing different standards of a transportation system. The assignment is performed based on the values of characteristics which are co mpared with the evaluation pattern, i.e. the set of decision ru les generated through the analysis of customers’ opinions expressed in the survey research. Both, criteria and attributes are taken into account. The method is composed of three major steps, i.e.: Step 1 - identification of the most important characteristics, Step 2 - generation of evaluation pattern expressed by decision rules, Step 3 - assignment of the transportation system to one of the predefined classes. The general scheme of the method and the most important interactions among the major steps are presented in Fig. 1. The method utilizes the 4eMka software developed for data analysis and data mining based on DRST. 3.2. Step 1 – Identification of the most important characteristics In the first step of the method the customers’ requirements and expectations concerning the transportation system’s performance and the standard of its key components are identified through the survey research. To guarantee the credibility of this analysis the surveyed sample has to be carefully selected based on a detailed categorization of the customers’ population. The customers participating in the survey have to be selected based on the analysis of their four major features, including: customers’ category, i.e. indiv idual vs. institutional and private vs. public, vehicle type utilized in the customers’ service processes, customers’ size in terms of work force and turnover, i.e. s mall and med iu m vs. large co mpanies, customers’ location, i.e. location of the loading and unloading activities. It must be guaranteed that all the categories part icipating in the survey represent the appropriate spectrum of collected opinions. Two kinds of questionnaire are applied in the survey research. The first one identifies a typical profile of different classes (standards) of a transportation system (QS1). The second one examines customers’ sensitivity on changes in a typical profile, by defining a compromise profile of different classes (standards) of a transportation system (QS2). In the first questionnaire the surveyed customers have to select those characteristics (from a set of suggested characteristics) that in their opinion have an important impact on an overall evaluation of a transportation
Piotr Sawicki and Jacek Żak / Procedia - Social and Behavioral Sciences 111 (2014) 1142 – 1154
1148
system.
Fig. 1. Major steps of the proposed method for evaluation of transportation systems
They are requested to define such values of characteristics, which allow distinguishing different classes of a transportation system with respect to each of them. In the second questionnaire the surveyed customers define a compro mise profile either through: a) increasing the values of several measures characterizing the real world transportation system and co mpensating it by decreasing the values of others, b) decreasing the values of several characteristics without increasing the values of others. The result of both questionnaire surveys constitutes the input for designing a customers’ opinion table which is composed of the set of customers’ opinions regarding the values of characteristics within typical and compromise profiles. Thus , the table includes: the set of characteristics composed of conditional characteristics (both criteria and attributes ) and representing the classes of a transportation system , decision characteristic informat ion function , which defines the value of a characteristic - expressed by customer participating in the survey research, a domain containing a set of values of characteristics (both criteria and attributes ). Each single ro w in the customers’ opinion table corresponds to a single customer’s opin ion concerning the . In the proposed approach six different classes transportation system assigned to a particular class (standards) of a transportation system are proposed, including: excellent, very good, good, average, un satisfactory and poor. Based on collected opinions and according to princip le of DRST, both upper and lower appro ximations of the unions of classes are generated. This means that for considered six classes of a transportation system five approximated downward unions of classes (i.e. at most: poor, unsatisfactory, average, good and very good standards) and five upward unions of classes (i.e. at least: excellent, very good, good, average and unsatisfactory standards) are defined. Based on upper and lower appro ximations of the union of classes the quantitative measures of accuracy of approximations and quality of sorting in are calculated. Finally, the importance of characteristics is evaluated, and as a result a set of reducts is generated. The final selection of the most important evaluation characteristics is based on a computational procedure resulting in the generation of the dynamic
Piotr Sawicki and Jacek Żak / Procedia - Social and Behavioral Sciences 111 (2014) 1142 – 1154
1149
reduct (e.g. Bażan, 1998). Such a reduct is an input for steps 2 and 3, corresponding to creation of the evaluation pattern and diagnosis of a real world transportation system. 3.3. Step 2 – Definition of the evaluation pattern In the second step of the method the evaluation pattern of transportation systems is generated. The pattern contains a generic description of the required standards of the transportation system for each of six classes. This pattern is expressed by a set of dynamic decision ru les generated in step 1, performed with the application of the strategy of a minimal set of rules that cover all the opin ions in table (Stefanowski, 1998). Next, all the nondeterministic decision rules should be excluded fro m further considerations to base the assignment on the most credible decision rules. A ll the remaining decision rules, i.e. deterministic ones, are then evaluated in terms of their relative and absolute strengths. Finally, the set of deterministic decision ru les is tested with respect to its prediction ability, i.e. ability to assign precisely a certain transportation system to one of the considered classes based on generated decision rules. To this end, N -fold cross validation test is utilized (e.g. Weiss and Kulikowski, 1990). As a consequence, a set of dynamic decision ru les is generated. It is constructed with the application of the systematic generation of the rules based on 10 randomly selected customers’ opinions tables constituting 90% of their original sizes. 3.4. Step 3 – The assignment of a transportation system to one of the predefined classes The last step of the method contributes to the final evaluation of a transportation system and consists in its assignment to one of the six p redefined classes. Based on a finally selected dynamic reduct (step 2) the evaluation of a considered real world transportation system is carried out. This system is described using all the characteristics included in the selected dynamic reduct. Based on both, deterministic decision rules (see step 2) and values of characteristics of a transportation system originated fro m a dynamic reduct all the decision rules of type are isolated fro m others. Finally, the assignment of a transportation system - x to one of the is based on the value of the credibility index - see equation (5). considered class 4. Application of the method – evaluation of the road freight transportation system The considered research problem consists in evaluating a real-word road freight transportation system, wh ich is carried out in section 4.3. The two introductory steps presented in sections 4.1 and 4.2 are necessary to reach this objective. 4.1. Step 1 – Identification of the most important characteristics In two parts of questionnaire survey 24 evaluation characteristics of a t ransportation system have been proposed, including both criteria and attributes. All those characteristics have been associated with the features of major components of a transportation system with the following assignment to its respective areas: Organizational rules: average processing time, acceptable delay of delivery, opening hours, acceptable level of cargo damage, credibility of the system, flexibility of the system, and experience at the Polish market. Human resources: the appearance of the employees, forwarders’ and drivers’ training, experience, competence, skills and education, average length of employment. Information resources: availability of customer-staff co mmunication means (incl.: IT systems, web page, EDI, phone or s ms), the way the customer is informed (incl.: standard documentation, periodical reporting, day-by-day reporting, tracking and tracing), the way the operator acquires info rmation (incl.: phone contact
1150
Piotr Sawicki and Jacek Żak / Procedia - Social and Behavioral Sciences 111 (2014) 1142 – 1154
with drivers, vehicle monitoring, advanced IT systems). Transportation means: fleet co mposition, fleet appearance, vehicles’ age and efficiency, vehicles’ cleanness and tidiness. Infrastructure and technical equipment: availability and technical features of loading/unloading and storage equipment, equipment available in the transportation depot, number of hubs across the country, average distance from a selected hub to the nearest customer. All the customers’ opin ions from the first and second part of the questionnaire survey have been collected and a customers’ opin ion table with 1066 objects has been constructed. The objects representing the rows of the table included 552 units co ming fro m the first part of the questionnaire and 514 fro m its second part. Based on the customers’ opinion table a sequence of computations has been performed, starting fro m the upper and lower approximations of the union of quality classes. Next, all the quantitative measures of data consistency concerning the customers’ opin ions about the standard of the general road freight transportation systems have been calculated. Table 1 presents all the generated unions of classes (5 downward and 5 upward unions) and corresponding accuracy of approximations. In the majority of union s of classes, the cardinality of upper and lower appro ximat ions is identical and equal 1. In some instances (see such unions of classes as: at most poor standard, at most unsatisfactory standard and at least unsatisfactory standard) the customers’ opin ions are slightly inconsistent, i.e. their condit ional and decision parts are contradictory. The result of such inconsistency is a decreasing the accuracy of approximations. However, an overall measure of the precision of collected opinions, exp ressed by the quality of sorting, equals 0,99 , which is high. This means that customers’ opin ions collected in a questionnaire, both for the typical and the co mpro mised profile, constitute a very coherent database to perform the evaluation of a transportation system. T able 1. Accuracy of approximation of the unions of classes Union of classes
Cardinality of approximations of the union of classes
Accuracy of approximations
Lower approx.
Upper approx.
At most poor standard
198
204
0,97
At most unsatisfactory standard At most average standard
357 528
360 528
0,99 1,00
At most good standard
720
720
1,00
At most very good standard
918
918
1,00
At least excellent standard
148
148
1,00
At least very good standard
346
346
1,00
At least good standard
538
538
1,00
At least average standard At least unsatisfactory standard
708 862
708 868
1,00 0,99
, composed of 12 most important Finally, as a result of step 1 of the method, the dynamic reduct – characteristics has been determined. This means that out of 24 initially considered measures only 12 play an important role in the global evaluation of a transportation system. These are as follows: . Their names are presented in Tab. 2.
Piotr Sawicki and Jacek Żak / Procedia - Social and Behavioral Sciences 111 (2014) 1142 – 1154
4.2. Step 2 – Definition of the evaluation pattern In step 2 of the method an evaluation pattern has been constructed. The evaluation pattern is expressed as a set of decision rules, generated with the application of the DOM LEM (e.g. Stefanowski, 1998) algorith m. This algorith m aims at searching for a min imal nu mber of decision rules based on the customers’ opinions table. All , consisted of 12 most important evaluation the computations have been carried out using a dynamic reduct characteristics. Finally, a set of 4285 dynamic decision rules has been generated, including 4276 determin istic decision ru les. Several exemp lary dynamic decision ru les (ext racted in step 3) are presented below. They are described as follows: the in itial number is the ordinal number of the decision rule , and the numbers in the brackets are absolute and relative strengths of the rule, respectively). The rules are given in the following form: 902: if 1013: if 1428: if 1549: if 1579: if 1640: if 2290: if 2345: if 2767: if 3289: if 3325: if 3820: if
and and then and then then then and and and and and
then is at most poor standard (2; 1,10%), then is at most very good standard (61; 7,44%), is at most very good standard (23, 2,78%), then is at least good standard (20; 4,09%), is at least average standard (23; 3,59%), is at least unsatisfactory standard (23; 2,95%), is at most very good standard (10; 1,21%), then is at least excellent standard (10; 7,63%) then is at least excellent standard (9; 6,72%), then is at least good standard (9; 1,89%), then is at least average standard (15; 2,37%), then is at least unsatisfactory standard (17; 2,20%).
(flexib ility) Rule #902 can be interpreted as follows: if a t ransportation system evaluated to characteristic offers the deliveries only inside Po land (dig it 1 at the first position) and is able to slightly change the route (digit (fleet appearance) offers clean loading space and logos on 1 at the fifth position) and evaluated according to then the standard of a transportation the vehicles’ body (digit 1 at the first and third positions system ( ) is at most poor. Rule #902 is supported by two objects (customers’ opinions) fro m the table, and those objects constitute around 1% of all objects (198 units) belonging for sure to the union of classes representing at most poor standard (see Tab. 1). 4.3. Step 3 – The assignment of a transportation system to one of the predefined classes In step 3 the evaluation of a real world road freight transportation system operated by AB-Trans company has been performed. The detailed diagnosis of this system has been carried out using the characteristics included in . The result of the d iagnosis coded in the format readable by 4eM ka software has been presented in Tab. 2. The assignment of the considered AB-Trans transportation system to one of the six classes has been preceded by the analysis of the usefulness of each decision rule. The subset of dynamic de cision ru les for wh ich the conditional part of the ru le and characteristic of AB-Trans system are adequate, has been extracted. As a result a type has been selected. Then a selected subset of decision rules subset of 63 out of 4276 decision ru les of has been analyzed taking into consideration the relative strength of the rule. Only rules with the highest strength measure within each f suggested union of classes have been selected for further procedure. As a result 12 out of 63 decision rules have been extracted. The final assignment of AB-Trans system to one of the predefined classes has been carried out with the . Its value has been computed using the scheme presented in Tab. 3, application of a credibility index
1151
Piotr Sawicki and Jacek Żak / Procedia - Social and Behavioral Sciences 111 (2014) 1142 – 1154
1152
which includes 6 classes (fro m poor to excellent), in colu mns, as well as several selected decision ru les, in ro ws, suggesting a potential assignment of AB-Trans system to one of the union of classes . Calculation of cred ibility index is based on the analysis of each single rule and its absolute strength. In practical terms, the absolute strength of a decision rule suggesting an assignment of A B-Trans system to a certain union of classes is dis tributed among specific single classes included in this union. For examp le an absolute strength of decision rule #1013 (see row 2) equals 61 objects supporting this rule and it is distributed among: poor, average, good and very good standard, which its card inality per each class equal: 4, 20, 27 and 10 objects, respectively. T able 2. Value of the characteristics of transportation system AB-Trans No. Quality characteristics included in
Coded value
1. 2. 3. 4. 5. 6. 7. 8. 9. 10. 11. 12.
2 01000000000010000 10001000 3 0010111 110100 1000100 011101000 1010 7 010110000 4
Acceptable delay Opening hours Flexibility of the system Staff experience Availability of customer-staff communication means Availability of information Acquisition and processing of information by the operator Fleet composition Fleet appearance Age of vehicles Availability of loading / unloading / storage equipment Number of hubs across the country
The sum of relat ive strengths for all decision ru les that supports the assignment of AB-Trans system to any union of classes equals 0,410. However, a conversion of this value into the single classes (fro m poor to excellent) expresses a value of the considered credibility index. Thus, the credib ility of assignment of AB-Trans system to one of the selected class fro m poor to excellent equals: 0,017, 0,004, 0,048, 0,202, 0,129 and 0,015 respectively. T able 3. T he scheme of calculating the credibility index
Union of classes At most poor At most very good At most very good At most very good At least good At least good At least good At least average At least average At least unsatisfactory At least unsatisfactory At least unsatisfactory Relative strenght Absolute strenght 1
Ordinal number 902 1013 1428 2290 767 1549 3289 1579 3325 820 1640 2345 sum % sum %
Poor card1 stgh2 2 4 0 0 6 2,2
,012 ,005 0 0 ,017 3,90 -
Classes of transportation system Unsatisfactory Average Good Very good card 0 0 0 0 0 3 3 1,1
Strength Excellent
stgh card stgh
card stgh
card stgh card stgh
0 20 0 2 0 2 2 4 0 1 0 2 ,004 4 ,004 0,9 37 - 13,6
27 11 10 10 10 11 11 10 8 11 10 129 47,3
10 10 10 1 10 2 10 4 4 10 15 86 31,5
,024 ,002 ,002 ,003 ,006 ,003 ,003 ,005 ,048 11,9 -
,033 ,013 ,012 ,016 ,020 ,023 ,017 ,016 ,025 ,014 ,013 ,202 48,6 -
,012 ,012 ,012 ,002 ,020 ,004 ,016 ,006 ,012 ,013 ,020 ,129 31,0 -
0 0 0 0 0 0 0 0 0 0 0 0 0 0 12 ,015 - ,015 - 3,7 12 4,4 -
absolute relative 2 61 23 22 11 20 13 23 18 13 23 44 273 100
,011 ,074 ,028 ,026 ,017 ,041 ,027 ,036 ,028 ,040 ,026 ,056 ,410 100 -
Lower approx. of union of classes 177 820 829 829 634 489 477 641 633 323 779 779 -
cardinality, 2 strenght
Taking these values into account it is reco mmended, that class good is a suggested evaluation of the AB-Trans
Piotr Sawicki and Jacek Żak / Procedia - Social and Behavioral Sciences 111 (2014) 1142 – 1154
system. Roughly 50% (48,6%) of all corresponding opinions covered by decision rules support this evaluation. A more co mprehensive analysis of the neighboring classes suggests that other potential assignments of AB-Trans system are also possible, however, less probable. AB-Trans system has more potential to be allocated to a class of a very good quality ( = 0,129, i.e. 31% of all opinions) than to a class of average quality ( = 0,050, i.e. 12% of all opinions). 5. Conclusions This paper deals with the problem of evaluation of t ransportation systems. The authors have proposed method of evaluation of transportation system consists of three major steps, including: Identificat ion of the most important characteristics for evaluation of transportation systems (step 1). In the analyzed case study 12 out of 24 characteristics have been selected as the most important in the evaluation of the road freight transportation system. Definition and development of the evaluation pattern (step 2). In the analyzed case a set of dynamic decision rules corresponding to 12 most important characteristics has been selected for further assignment. Allocation of the real world transportation system to the predefined class (step 3). Here the selected decision rules and their relative strength are converted into the cred ibility index and finally, based on its value a suggested assignment is pointed out. The proposed method has been experimentally verified and its application to the evaluation of a road freight transportation system has been demonstrated. The method has a universal character and its field of application is widespread. It can be used to the assess different types of transportation systems, operated by different modes (road, rail, air and water) and provid ing both passengers’ and freight transportation services. In addition to the above mentioned benefits the proposed approach is also characterized by several features of tradit io nal quality evaluation methods, such as: a) provision of a co mprehensive, mult i-d imensional evaluation of a transportation system based on the analysis of characteristics describing many aspects of its operations, b) generating aggregated and synthetic index suggesting an overall evaluation of a transportation system.
References Bażan, J. (1998). A comparison of dynamic and non-dynamic rough set methods for extracting laws from decision system. In: L. Polkowski, A. Skowron (Eds.). Rough set in knowledge discovery, 1, 321-365, Physica-Verlag: Heidelberg. De Toni, A., Nassimbeni, G., & Tonchia, S. (1995). An instrument for quality performance measurement. International Journal of Production Economics, 38, 199-207. De Brucker, K., Macharis, C., & Verbeke A. (2011). Multi-criteria analysis in transport project evaluation: an institutional approach. European Transport, 47, 3-24. Figueira, J., Greco, S., & Ehrgott, M. (2005). Multiple Criteria Decision Analysis. State of the Art Surveys. New York: Springer. Greco, S., Matarazzo, B., & Słowiński, R. (1998). A new rough set approach to evaluat ion of bankruptcy risk. In: C. Zopounidis (Ed.). Operational tools in the management of financial risk (pp. 121-136). Kluwer Academic Publishers: Dordrecht. Greco, S., Matarazzo, B., & Słowiński, R. (1999a). The use of rough sets and fuzzy sets in MCDM. In: T . Gel, T . J. Stewart, T. Hanne (Eds.). Multicriteria decision making. Advances in MCDM models, algorithms, theory, and applications (pp.14.1–14.59). Kluwer Academic Publishers: Dordrecht. Greco, S., Matarazzo, B., & Słowiński, R. (1999b). Handling missing values in rough set analysis of multi-attribute and multi-criteria decision problems. In: N. Zhong, A. Skowron, and S. Ohsuga (Eds.). New directio ns in rough sets, data mining and granular-soft computing. Lecture Notes in Artificial Intelligence, 1711, 146-157. Greco, S., Matarazzo, B., & Słowiński, R. (2001). Rough set theory for multicriteria decision analysis. European Journal of Operational Research, 129 (1), 1-47. Hayes, B.E. (1992). Measuring customers satisfaction. Development and use of questionnaires. ASQC Quality Press: Milwaukee. Lee, D.B. Jr. (2000). Methods for evaluation of transportation projects in the USA. Transport Policy, 7, 41-50.
1153
1154
Piotr Sawicki and Jacek Żak / Procedia - Social and Behavioral Sciences 111 (2014) 1142 – 1154
Lun, Y.H.V., Lai, K.H., & Cheng, T.C.E., (2013). An evaluation of green shipping networks to minimize external cost in the Pearl River Delta region. Technological Forecasting & Social Change, 80, 320-328. Marshall, A. (1920). Principles of Economics (Revised Edition ed.). London: Macmillan; reprinted by Prometheus Books Pawlak, Z. (1982). Rough sets. International Journal of Computer and Information Science, 11, 341-356. Salucci M., Delle Site. (2010). Thematic Research Summary: Decision Support Tools. European Commission DG Energy and T ransport T ransport Research Knowledge Centre, 43-52. Sawicka H., & Zak, J. (2013). Ranking of distribution system’s redesign scenarios using stochastic MCDA procedure. Procedia - Social and Behavioral Science, 2013 (submitted to this issue). Sawicki, P., (2003). Quality evaluation method of the transportation system using rough sets theory. Ph.D. dissertation, Warsaw University of T echnology: Warsaw (in Polish). Sawicki, P., & Żak, J. (2009). Technical diagnostic of a fleet of vehicles using rough set theory. European Journal of Operational Research, 193, 891-903. Słowiński, R., & Stefanowski, J. (1989). Rough classification in incomplete information systems. Mathematical and Computing Modelling, 12 (10/11), 1347-1357. Stefanowski, J. (1998). On rough set based approaches to induction of decision rules. In: Skowron A., Polkowski L. (eds.): Rough sets in data mining and knowledge discovery, Vol. 1. Physica- Verlag, Heidelberg, 530-553. Sun, Z., Li, X., Qiao, W., & Haghani, A. (2013). Entropy-based performance evaluation on institutional structures of trunk highway management-Case study in China. Transport Policy, 27, 85-91. Weiss, S., & Kulikowski, C.A. (1990). Computer systems that learning: classification and prediction methods from statistics, neural nets, machine learning and expert systems. Morgan Kaufamann: San Mateo, CA. Yue, Z., & Peilin, Z. (2012). Research on the Modern Transportation System Development Based on Fuzzy Comprehensive Evaluation, Fourth International Conference on Multimedia Information Networking and Security (MINES), 2012, IEEE Computer Society, 701-704. Zhang, Q., & Wu, Y., (2009). Research on the city logistics development evaluation system based on fuzzy mathematics. IEEE Zhao, Ch., & Xue, H., (2011). A research on supply chain risk-alert system of chain-retail business based on AHP and fuzzy comprehensive evaluation, International Conference on Computer Science and Service System (CSSS), 2011, IEEE, 95-98. Papageorgiou, M., Pouliezos, A. (1998). Preface to special section on transportation systems. Control Engineering Practice, 6 (6), 725-726. hl, B., & Lumsden, K. (1995). Transportlogistik, Studentlitteratur. Lund, Sweden.