Current Molecular Medicine 2004, 4, 611-621
611
The Application of Gene Expression Microarray Technology to Kinetoplastid Research Robert C. Duncan * 1 , Poonam Salotra 2 , Neena Goyal3 , Natalia S. Akopyants4 , Stephen M. Beverley4 and Hira L. Nakhasi1 1Division
of Emerging and Transfusion Transmitted Diseases, Office of Blood Research and Review, CBER, FDA, Bethesda, MD, USA 2Institute
of Pathology, Indian Council of Medical Research, Safdarjung Hospital, New Delhi, India
3Division
of Biochemistry, Central Drug Research Institute, Lucknow, India
4Department
of Microbiology, Washington University Medical School, St. Louis, MO, USA
Abstract: Protozoan parasites in the order Kinetoplastida cause severe disease primarily in tropical and subtropical areas. Vaccines to control these diseases have shown some promise, but none are in active clinical use. Drug treatments are available for all of the acute infections, but the emergence of resistance and an unresponsive chronic phase are current problems. Rapid advances in genomic technology open the possibility of discovering new genes that can contribute to vaccine initiatives or serve as targets for development of new drugs. The DNA microarray is a genomic technology, which is being applied to new gene discovery in kinetoplastid parasites. Both cDNA and genomic microarrays for Leishmania major have identified a number of new genes that are expressed in a stagespecific fashion and preliminary results from a L. donovani genomic microarray also demonstrated new gene discovery. A microarray of Trypanosoma brucei genomic fragments identified new genes whose expression differs between the insect borne stage and the human infectious stage of the parasite. The next few years, building on this foundational work, should witness the most exciting stage as microarrays are applied to questions such as the basis of drug resistance, post kala azar dermal leishmaniasis, the regulation of differentiation to infectious stages, linking coordinately regulated pathways of genes and development of genetically defined parasites that may have potential as live attenuated vaccines. Keywords: Microarray, Leishmania, Trypanosoma, stage-specific, fluorescent hybridization, gene discovery, Northern blot, expression profiling.
INTRODUCTION Kinetoplastid parasites of the genus Leishmania (L.) infect about 12 million people worldwide, with 600,000 new clinical cases reported annually and many more unreported [1]. The two major clinical forms of leishmaniasis, cutaneous and visceral, are the result of infection by different species of the parasite. Visceral leishmaniasis, fatal if not treated, is caused by L. donovani, L. infantum, and L. chagasi. More than 90% of the visceral cases in the world are reported from Bangladesh, Brazil, India and Sudan [1]. Cutaneous leishmaniasis, though not lifethreatening, is painful and disfiguring. L. major and L. tropica in the Old World and L. mexicana and L. braziliensis in the New World are the primary species responsible [2]. The remaining human pathogens in the Kinetoplastidae are in the genus Trypanosoma.
*Address correspondence to this author at the Division of Emerging and Transfusion Transmitted Diseases, Office of Blood Research and Review, CBER, FDA, Bethesda, MD, USA; E-mail:
[email protected]
1566-5240/04 $45.00+.00
Trypanosoma cruzi (T. cruzi) causes a life-long infection with possible complications of myocarditis and digestive system pathology in Central and South America. The long duration of the chronic, asymptomatic phase of T. cruzi poses a particular problem for transfusion transmission. Trypanosoma brucei (T . brucei) causes sleeping sickness in humans, but its major economic impact is through its restriction of cattle raising in areas where these domestic animals become weakened or die from the infection [3]. There is a pressing need to translate technological advances in the understanding of the pathogenesis of leishmaniasis and trypanosomiasis into field applicable and affordable methods for diagnosis, treatment and prevention of these diseases [2]. Vaccines to prevent leishmaniasis and trypanosomiasis have been goals for nearly a century based on the knowledge that a cured infection protects the individual from reinfection. A vaccine approach is also important for these kinetoplastids because drug treatment is harsh and sometimes ineffective. Current molecular techniques © 2004 Bentham Science Publishers Ltd.
612
Current Molecular Medicine, 2004, Vol. 4, No. 6
have led to the development of recombinant antigen vaccines, though they have not protected to the level of live attenuated parasites [4-8]. Attenuated parasites, though effective, have been unacceptable for human use due to the absence of a clear genetic profile and danger of reversion to the pathogenic phenotype [9]. The current techniques for discovery of new genes that determine parasite survival and the possibility of manipulation of such genes in the kinetoplastid genome revive the potential of live attenuated parasite vaccines that are characterized well enough to reduce the danger of unknown alterations and reversion [10, 11]. Chemotherapy with anti-parasitic drugs varies in effectiveness. Drugs are the major weapons against leishmaniasis and there is some hope that drug treatment of infected individuals could lead to eradication for Leishmania donovani, which has no reservoir host. Unfortunately, the increasing prevalence of parasites resistant to the first line drug, pentavalent antimonials and the cost and toxicity of the second choice, amphotericin B, are discouraging [12]. The oral drug miltefosine, newly approved for use in India, raises hope of more effective treatment [13]. The drugs available for treatment of T. cruzi infection are only 50% effective in the acute phase and much less in the chronic phase [14]. Similarly, treatment for T. brucei infection requires toxic drugs that are less effective in the late stage of the disease [15]. In all cases, the evolution of resistance on the part of a parasite determined to survive is predictable and new drug discovery must stay a step ahead of increasing ineffectiveness of those in current use. Consequently, discovery of new genes essential for parasite survival that can be targeted by new drugs for treatment of these diseases is imperative. All of the kinetoplastids that cause human disease are transmitted by an insect taking a blood meal. Each has adapted to a specific insect host, but there are similar themes in that the parasites undergo morphological and biochemical changes that facilitate survival in these diverse and often hostile environments. In the Leishmania life cycle, promastigote forms that develop in the alimentary canal of the sand fly vector differentiate into an infectious, non-dividing form called metacyclic promastigotes [16]. These metacyclics are phagocytized by macrophages after injection into the mammalian host. The parasites must differentiate into the non-motile amastigote form to persist in a phagolysosome in the macrophage [17]. These differentiation events are associated with dramatic morphological and biochemical changes [18-21]. These changes have been correlated with changes in gene expression in several species [22-31]. In T. cruzi, the insect stage (epimastigote) also differentiates into an infectious metacylic form. However, in the mammal, differentiation into intracellular amastigote as well as extracellular
Duncan et al.
trypomastigote forms occurs as stages in the life cycle [32]. These differentiation events have also been correlated with changes in gene expression [32-36]. Similarly, T. brucei differentiates into multiple forms in both the tsetse fly vector and the mammalian host, though it remains extracellular throughout its life cycle [3, 37]. One of the most distinct manifestations of stage differentiation in Trypanosomes is the change in expression of the surface protein, PARP (procyclic acid repeat protein), on the insect form and VSG (variant surface glycoprotein) on the mammalian form. The genetic mechanisms, uncommon even for Trypanosome protein-coding genes, for rapidly changing the VSG molecule on the surface as a means of immune avoidance (antigenic variation) particularly has caught the attention of biologists [38-40]. Though there has been a concerted search for differentially expressed genes for all the kinetoplastids, the tools available and the approaches taken have resulted in description of a modest number of them. Clearly, the products of genes that are specifically required to maintain the intracellular amastigotes or T. brucei bloodstream forms have great potential as targets to block the infection process. To find such genes, unravel biochemical pathways or discover genes that may be expressed transiently at a critical point of differentiation, new techniques must be applied.
MICROARRAY TECHNOLOGY One of the new techniques available to parasitologists is the DNA microarray, a high-density microscopic arrangement of immobilized nucleic acid on a glass slide. Hybridization with fluorescent cDNA synthesized from RNA samples of interest permits the evaluation of gene expression on a genomic scale [41, 42]. This approach has been successfully applied to a wide range of biomedical and biological questions including the study of human cancer [43], the metamorphosis of fruit flies [44], and dissection of the yeast cell cycle [45]. As a tool to discover new genes in protozoan parasites, the microarray has already proven effective for Plasmodium [46, 47] and Toxoplasma [48, 49]. Though new, the methods are being standardized as the diversity of publications indicates. The first step in construction of a microarray is to assemble a collection of DNA samples to be printed on the array to screen for expressed genes (Figure 1 ). Once enough of the genome has been sequenced and annotated, gene specific DNAs can be generated as synthetic oligonucleotides or PCR products. These approaches have the advantage of wide coverage of expressed genes, though the cost is high. However, for the kinetoplastids, sequencing and annotation are not complete, requiring collection of cloned DNA from libraries. The two types of library approaches, cDNA or genomic, have the advantage
The Application of Gene Expression Microarray Technology
Current Molecular Medicine, 2004, Vol. 4, No. 6
613
Figure 1. Flow diagram of the process of constructing a genomic microarray for kinetoplastids. 1) parasites are collected from patient or laboratory sources. 2) parasites expanded in culture. 3) DNA extracted. 4) DNA randomly fragmented and size selected 5) DNA fragments ligated into an appropriate plasmid vector, bacteria transformed, individual colonies picked, cultured and plasmids extracted. 6) Common flanking primers used to synthesize sufficient insert DNA by PCR. 7) PCR products transferred with a robotic pin spotter onto glass slides, fixed and blocked. 8) Fluorescently labeled oligo dT primed cDNA synthesized from total RNAs of interest, hybridized to the microarray and image captured with a two-color laser scanner.
of lower cost while coverage of expressed genes is dependent on the number of unique DNAs printed on the array. The cDNA library has the appeal of being entirely composed of expressed genes, however, the clones will be restricted to the genes that were expressed in the life cycle stage during which the RNA was prepared for library construction. Further, the clones in a cDNA library will be biased toward highly abundant mRNA species and coverage will be dependent on the resultant redundancy as well as number of clones. Kinetoplastid genomic organization makes the genomic library practical due to the high gene density and lack of introns in protein coding genes [50, 51]. Furthermore, a genomic DNA library has the advantage of providing an unbiased representation of parasite genes. The genomic inserts in the library must be size selected to ensure hybridization to a single transcript, yet long enough for reasonable coverage. The average size of transcripts and intergenic regions suggests 1-1.5kb to be a suitable compromise [52]. The extent of expressed gene coverage for a given number of genomic clones on an array has been estimated from ORF searches of a set of genomic clones [53] or theoretical
calculations [52] to be between 63% and 66% for 10,000 1kb clones. With either library type, PCR reactions using each clone plasmid as template and common flanking primers amplify the parasite DNA insert. These DNA samples are transferred by a very precise robotic device onto specially coated glass slides in a microscopic array. To fully understand the outcome of microarray hybridization results as a measure of changes in gene expression in kinetoplastids, further discussion of the molecular biology of their gene expression will be helpful. Recognizing that the relative intensities of the fluorescent signals in microarray images attempt to measure mRNA abundance, it is important to briefly outline current theories regarding kinetoplastid RNA transcription and processing. In kinetoplastids, most protein coding genes are transcribed as large polycistronic molecules, initiated without defined promoters, and subsequently processed into mature mRNA [50, 54, 55]. The abundance of an mRNA species is controlled largely by its stability, which has been shown to be regulated by sequences in the 3’ untranslated region [56-59]. Consequently, changes in abundance are often not as pronounced as in organisms with gene regulation at the level of
614
Current Molecular Medicine, 2004, Vol. 4, No. 6
transcription initiation such as bacteria and higher eukaryotes. Changes in mRNA abundance revealed by the microarray, though moderate, are likely to point toward changes that when further amplified by differences in translation and post-translational modification, will result in the ultimate phenotypic changes that determine the traits of interest.
LEISHMANIA MICROARRAY STUDIES Leishmania major Gene expression in this species that causes cutaneous leishmaniasis has been evaluated both by random genomic microarrays [53, 60] and cDNA microarrays [61]. Noting the lack of well characterized cDNAs or sufficient sequence information to design oligonucleotides, Beverley and colleagues produced a randomly sheared genomic library from the L. major Friedlin strain [52]. A collection of 10, 464 clones was arrayed in 96 well plates, end sequenced and the sequences made available in the Genbank (NCBI) genome survey sequence (GSS) database (www.ncbi.nlm.nih.gov). The inserts from these clones, along with approximately 200 known genes and other controls, were printed on glass slides. To demonstrate the effectiveness of the microarray and identify genes whose expression changes at the level of mRNA abundance, comparison was made between procyclic promastigotes and metacylic promastigotes [53]. Taking advantage of the knowledge that L. major promastigotes in culture differentiate from the procyclic stage at low culture density to the infectious, metacyclic stage over a period of days at saturation densities [62], RNA samples were collected from log phase promastigotes and metacyclic promastigotes. Performing hybridizations in triplicate and scoring spots as regulated whose expression differed by at least a factor of two in all three experiments, genes known to be up regulated in procyclics such as βtubulin, histones and ribosomal proteins were identified. In metacyclics, H A S P / g e n e B , SHERP/geneD, META1 and HSP70 were among those found up regulated. Many more differentially regulated clones were identified which did not have homology to proteins of known function. Results from over 80 clones compared between microarrays and Northern blots to date have shown quantitatively similar regulation for more than 70% of them ([53], Akopyants and Beverley, unpublished results). The question was posed concerning why only a few percent of the clones on the array showed changes in expression more than two-fold, in contrast to growth phase or developmental transitions in yeast that result in changes in expression in 18-27% of all genes [45, 63]. These authors suggested that Leishmania relies more heavily upon regulatory mechanisms at the protein level than upon changes in mRNA abundance to control gene regulation [53]. Another laboratory obtained the 10, 464 L. major genomic clones described above and prepared a
Duncan et al.
microarray adding their chosen set of known regulated and negative control genes [60]. As in the previous study [57], they evaluated changes in gene expression as procyclic promastigotes differentiated into metacyclic promastigotes. Differential expression was evaluated by hybridizing the microarray with cDNA from procyclics labeled with one fluorophore and cDNA from 5, 7, 9 or 11-day cultures labeled with the contrasting fluorophores [58]. These authors elected to use the amount of variation in repeated hybridizations as the main criterion for significance of differential expression. By this criterion and focusing primarily on the day-9 metacyclics, 472 clones (5.1%) showed a statistically significant upward change by a factor of 1.2 or more, though only 101/472 (1.1% of all clones) were up regulated by more than 2-fold. One hundred forty one DNA elements (1.5%) were decreased by a factor of 1.2 or more with statistical significance and 42 of these by 2-fold or more. The microarray results showed very good correlation with Northern blots probed with 13 selected clones and several specific genes were noted (MKK2 [64], gene B [65], and A2 gene [27]) that have been previously reported to be up-regulated in metacyclics or amastigotes. However, META1 [66], SHERP/geneD [67] and HSP70 [68], known to be up regulated in metacylics, were not among those significantly regulated [58]. As in the previous L. major microarray study, these authors made note of the lower proportion of differentially expressed genes and the small sizes of the changes in expression during this developmental transition compared to other organisms [60]. Further, the study by Saxena et al. [58] made a contribution to gene discovery by analysis of the available sequence of the L. major clones they identified as differentially expressed. Identifying open reading frames and searching for homologies to known protein motifs, the authors attempted to assign the putative function to 63 genes whose RNA increased in abundance 1.2 to 4.4-fold in metacyclics and 25 genes whose RNA decreased in abundance by similar amounts. Further characterization of the putative function of these genes will be necessary before the pattern of change in mRNA abundance revealed by the microarray results can be assigned a role in the process of differentiation to the infectious stage of this parasite. Taking the cDNA approach to study L. major, Jenefer Blackwell’s laboratory constructed a microarray composed of 2091 clones from mixed life cycle stage libraries [61]. They compared the gene expression in cultured L. donovani promastigotes to L. major LV39 promastigotes at day 3, 5, 7 and 10 of culture and lesion-derived L. major amastigotes. Sequence analysis revealed that the clones on the array comprised partially overlapping fragments of 1092 unique genes, 70% of which had no identity with entries in the public databases. Of the genes matching sequences in databases, 23% could be assigned putative function based on their
The Application of Gene Expression Microarray Technology
homologies. Hybridization results allowed clustering the clones into 10 patterns of expression across the 5 samples. This analysis identified 147/1092 (13.5%) unique genes that were up regulated in amastigotes by a factor of 2 or more. The results were internally consistent because different cDNA clones on the array that represented the same gene, largely grouped in clusters of expression patterns. Blackwell’s group advanced the study to the next stage, taking the 147 genes selected for amastigote expression, splicing them into DNA vaccine constructs for testing in mice. DNA vaccination and live parasite challenge identified candidate genes that protected mice, encouraging the authors to pursue a high throughput strategy to screen all the potential amastigote expressed genes [61]. The proportion of differentially regulated genes reported in this study may be higher than seen with the genomic microarrays due to the tendency for cDNA libraries to be primarily composed of highly expressed genes. L. donovani Genomic Microarray To investigate gene expression in L. donovani, the principle species causing visceral leishmanisis, we are developing a microarray from a genomic library prepared as described by Akopyants et al. [52]. To insure representation of the critical virulence genes in the library, the source DNA was prepared from L. donovani parasites isolated from a patient with active disease. To avoid culture derived genetic aberrations, the isolated parasites were expanded the minimal number of passages in culture to provide enough source material. Before selecting the parasite isolate for the library, several were collected and tested by isoenzyme typing using a panel of 5 soluble enzymes [69], immunofluorescence assays with species-specific monoclonal antibodies [70] and by a species-specific PCR assay [71]. The K59 strain was chosen that represented the most common Indian kala azar isotype (Sreenivas et al.*). In a preliminary study, 2268 library clones, 24 positive control genes and 12 negative controls, a total of 2304 samples, were printed in two duplicate arrays on each glass slide. To validate the effectiveness of the L. donovani genomic microarray, we compared the gene expression in the promastigote stage to expression in axenic amastigotes of three cultured strains of L. donovani, 1S2D [72], DD8 [73] and K59. This experimental setup allowed evaluation of microarray results for genes known to have stage specific expression and cross comparison between strains to increase the probability of finding physiologically important expression patterns, not artifacts of a particular cultured strain. The three strains chosen also allow *Sreenivas, G., Singh, R., Selvapandiyan, A., Negi, N. S., Nakhasi, H. L., Salotra, P. (2004). "Arbitrary-primed PCR for Genomic fingerprinting and identification of differentially regulated genes in Indian isolates of Leishmania donovani." Exp. Para. 106, 110-118.
Current Molecular Medicine, 2004, Vol. 4, No. 6
615
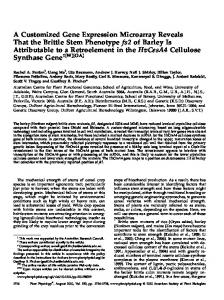
us to compare the impact of geographic origin (1S2D is derived from a Sudanese isolate while DD8 and K59 are from Indian isolates) and time in culture (1S2D and DD8 are long term cultured strains whereas K59 has been kept in culture less than 10 passages). Fluorescent cDNA was synthesized from total promastigote RNA. cDNAs were labeled with a contrasting fluorophore synthesized from total amastigote RNA. The two were mixed and hybridized to a slide containing two duplicate arrays. Two color fluorescent scanning and quantitation allowed calculation of an amastigote to promastigote (A/P) ratio of expression for each spot on the arrays. Hybridizations were repeated, exchanging the fluorophore used to label each RNA sample to account for dye bias, and mean ratios were calculated from the 4 resulting measures. To adjust for unequal fluorescence intensities of the two RNA samples and allow comparison from experiment to experiment, various methods of normalization have been devised [74]. All of the microarray results reviewed herein were normalized by one of these methods. As one example of this process, a “total intensity normalization” [75] for the L. donovani microarray results can be used as illustration. To produce a continuous distribution of up and down regulated spots, the ratios were transformed to the log2 . Further normalization to account for the systematic dependence of ratio on intensity was performed by locally weighted linear regression (lowess) [76]. The distribution of all the ratios is presented on a plot of log 2 (ratio of intensities) by log10 (product of intensities) in (Figure 2 ). The gray spots indicate the ratios before normalization for one representative experiment and the black spots are the values after lowess correction by the MIDAS software [75]. Note that after adjustment, most of the spots are tightly grouped along the log 2 (ratio) = 0 line (no change in expression) and a small number are above the +1 or below the –1 lines (2 fold increase or decrease) indicating the limited amount of differential expression that seems to be typical for this analysis of kinetoplastid parasites. The vertical black line shows the highest log product of the negative controls such as salmon sperm DNA, E. coli DNA and pZErO, the backbone plasmid of the genomic library. Clones with intensity values below this level were not included in the analysis because the signal could not be guaranteed to be specific. Using this rather strict criterion for inclusion, up to 30% of the clones corresponded to expressed genes with an average of 10% of these clones differentially expressed by 1.5 fold or more. The performance of the L. donovani microarray was demonstrated in three categories of features on the array: known gene controls, K59 library clones with homology to known genes and library clones with no homologues in sequence databases. The performance was assessed by comparison of
616
Current Molecular Medicine, 2004, Vol. 4, No. 6
Duncan et al.
Figure 2. Example of data normalization. This scatter plot of log ratios against log products of fluorescence intensities is from a typical L. donovani genomic microarray image. Axenic amastigote total RNA was used to synthesize Cy3 labeled cDNA and mixed with promastigote cDNA labeled with Cy5. The mixture hybridized to the microarray. The Cy5 and Cy3 fluorescence intensities were measured with a laser scanner and the log base 2 of the intensity ratios plotted against the log base 10 of the product of intensities for each spot. The grey spots represent the values without normalization. The black spots show the values after lowess normalization (see text for explanation). The vertical dashed line indicates the maximum log product intensity of a negative control, only spots to the right of this line were considered in the analysis of expressed genes.
microarray results to Northern blot hybridizations using the probes printed on the microarray and to published Northern blot results. Two examples of known gene controls, LSIP, a genomic clone of Leishmania stress inducible protein [25], and LdS-61, an arbitrarily primed PCR cloned fragment isolated in our laboratory [77] illustrate the correspondence between microarray results and the traditional means of measuring mRNA abundance. The mean axenic amastigote/promastigote (A/P) ratios from microarray experiments for these two genes in three strains of L. donovani are shown in Table 1. Northern blot results (Figure 3) are consistent with the patterns described in the literature for these genes and the A/P ratios calculated from the Northern blots are very similar to the mean ratios for the 1S2D and DD8 strains measured on the microarray, though the ratios for the K59 strain deviate somewhat. Microarray results from a library clone with DNA sequence sufficiently identical to a known Leishmania gene was also compared to Northern blots as done above for the known gene controls. As
above, the size of the bands and expression ratios on the Northern blots were in agreement with published results for GP63 (clone 1B2) [59]. The A/P ratio for clone 1B2 (GP63) consistently showed somewhat higher expression in amastigotes in microarray results for all 3 strains (Table 1) and the Northern blot (Figure 3). Most of the clones identified as differentially expressed in more than one strain had sequences that showed no homology with previously described genes. One example, K59 clone 38C5, was highly homologous to sequences in an EMBL database file (see Table 1) of unassembled, unannotated shotgun sequence coming from the L. major genomesequencing project (www.ebi.ac.uk/blast2/parasites). The database matching confirmed that the clone is a L e i s h m a n i a genomic fragment, but gave no indication whether it represents expressed or intergenic sequence. The PCR product for clone 38C5 was radioactively labeled and used as a probe on Northern blots of L. donovani strain 1S2D total RNA promastigote and axenic amastigote samples
The Application of Gene Expression Microarray Technology
Current Molecular Medicine, 2004, Vol. 4, No. 6
(Figure 3). There is no previous work to judge the size of the mRNA to expect, but the clear single band is consistent with the mature message of a protein-coding gene. Clone 38C5 was preferentially expressed in the promastigote stage of the long term cultured strains (1S2D and DD8) by microarray (Table 1 ) and Northern blot quantitation (Figure 3 ) . Microarray results showing preferential expression in amastigotes in the K59 strain, only recently placed in culture, may reveal interesting biology and will be investigated further with RNA samples isolated from that strain.
617
unidentified genes. However, the total number of clones differentially expressed and the magnitude of change in RNA abundance reflected on this L . donovani genomic microarray were smaller than in developmental transitions in other organisms, as noted for L. major above [57, 58]. Further analysis of this observation will be discussed below in light of additional kinetoplastid microarray results.
TRYPANOSOME MICROARRAY STUDIES T. brucei cDNA Microarray A pilot array of 207 cDNA clones and 193 random genomic fragments was constructed as a feasibility study for application of results from the T. brucei genome sequencing project [3]. Screening the array for expression in the procyclic, insect stage, versus the bloodstream, human infectious stage, of T . brucei identified 54 clones (13.5%) that showed a 2fold or more change in level. However, the authors concluded that the molecular biology of T. brucei like Leishmania, would permit a more cost effective, unbiased coverage of the genome with an array of randomly sheared genomic fragments. T. brucei Genomic Microarray To construct a genomic array, 21, 024 clones from a T. brucei shotgun library of inserts size fractionated to 2-2.5kb in length were printed on glass slides [78]. Each slide encompasses a statistical representation of 86% of the genome. Known cDNAs as positive clones, rRNA fragments and 384 human cDNA clones as negative controls, were spotted as well. To validate the ability of this array to detect differentially expressed genes, RNA was prepared from cultured procyclic stage and blood stage trypanosomes. Six independent hybridizations alternating labels for the two sample types between Cy3 and Cy5 dye to eliminate bias identified 75% of the clones as expressed sequence. Normalization and statistical analysis of the results characterized approximately 300 clones (~1.4%) as differentially expressed by a factor of 1.6 or more. End sequencing of 70 differentially expressed clones revealed that half of them were related to sequences in the VSG expression sites
Figure 3. Northern blots of L. donovani RNA hybridized with selected micrarray probes. Northern blots and 32 P labeled probes were prepared as described previously [31]. Each lane contained 10µg of total RNA from 1S2D strain promastigotes (P) or axenic amastigotes (A). Each pair of lanes was hybridized with a probe from the gene or clone named above each pair. The positions of the ribosomal RNA bands are indicated to the right of each pair of lanes, with the sizes of the rRNAs shown at the far right in kb. The corresponding ethidium bromide stained rRNA bands used to normalize for RNA loading are shown below each lane. The ratio of amastigote to promastigote signal intensity was calculated from Phosphor Imager quantitation of each blot and shown at the bottom of each pair of lanes.
These preliminary results showed that the L . donovani genomic microarrays are consistent with Northern blots of known genes, homologues of genes described in other species and previously
Table 1. L. donovani genomic microarray results. Means of 4 replicate measures of Amastigote/Promastigote ratios of fluorescent signal intensities, +/- one standard deviation. A/P ratio L. donovani Strain Clone ID
Gene
1S2D
DD8
K59
LSIP
0.90+/-0.05
0.94+/-0.05
0.84+/-0.01
LdS-6-1
1.47+/-0.09
1.30+/-0.23
0.83+/-0.01
1B2
GP63
1.39+/-0.04
1.38+/-0.64
1.79+/-0.02
38C5
AC127673a
0.64+/-0.06
0.69+/-0.10
1.72+/-0.12
aAccession number, recorded in the EMBL database without annotation for gene composition.
618
Current Molecular Medicine, 2004, Vol. 4, No. 6
and 14 clones contained no identifiable open reading frames. Among the remaining clones up regulated in the bloodstream form, previously characterized genes such as invariant surface glycoprotein [79] and alternative oxidase [80] were found as well as interesting newcomers such as NADH dehydrogenase and an ATPase. Clones preferentially expressed in the insect form included a number of known regulated genes as well as a homologue of the Leishmania gene, META1, shown to be up regulated in metacyclic promastigotes in the microarray studies described above [53, 60]. To verify the microarray results, 15 of the sequenced clones were used as probes on Northern blots or to design semi-quantitative RT-PCR. These independent techniques revealed differential expression similar to the microarray results [78]. These authors commented that the higher proportion of differentially expressed clones reported in the previous T. brucei study [3] may be due to the bias inherent in a cDNA microarray as described for L. major [61] above. Trypanosoma cruzi Expression Analysis Microarray analysis for T. cruzi has been reported in a meeting abstracta. Cluster analysis of expressed sequences (ESTs) for T. cruzi that are recorded in the EMBL database allowed generation of 4, 000 EST-specific PCR products that were printed on microarrays. Hybridization experiments led to identification of a series of genes whose regulation is associated with differentiation of epimastigotes into metacyclic trypomastigotes. Previous work from the same lab by another technique similarly aimed at large scale screening for stage specific genes led to the identification of 161 stage-specific clones, but only 6 were sequenced and 2 were verified by Northern blot analysis. Of particular interest is a clone that is expressed transiently during metacyclogenesis, but not in either the epimastigote or the terminal metacylic stage, suggesting it may help regulate the differentiation process. Further characterization of this clone led to the description of the metacyclogenin gene [35].
SUMMARY Current advances in molecular biology techniques and the genome sequencing projects hold great promise for new discoveries that can contribute to diagnosis, treatment and prevention of parasitic diseases. A deeper understanding of basic biology and the discovery of new genes that can contribute toward development of vaccines and new drug targets for members of the kinetoplastid family of parasites is a fundamental goal of current work. One aKrieger, M. A., Freund, A. A., Avila, A. R., et al. and Goldenberg, S. 2002. Analysis of the gene expression program during the cellular differentiation of Trypanosoma cruzi (metacyclogenesis) through microarray hybridization. Molecular Parasitology Meeting XIII on line abstracts: http://e2kroos.cis.upenn.edu/mpm-2002/abstracts/
Duncan et al.
step in applying genome wide technology is the DNA microarray. Microarrays have been constructed and validated for two species of Leishmania and two species of Trypanosoma with the potential to rapidly screen for expressed gene sequences. The ability of two-color fluorescence hybridization to identify clones that are differentially expressed under defined conditions means genes could be selected from among a large pool that are good candidates for further characterization as elements of vaccines or drug targets. Realistically, the development of microarray analysis of kinetoplastids has not reached the goal that "gene expression can be examined on a genomic scale providing unique insight into temporal patterns of global gene expression and allowing the generation of a comprehensive molecular profile of mRNA expression during the well-defined stages of the parasite’s life-cycle" [3]. Clearly the potential to describe new differentially expressed genes has been demonstrated in all cases. However, some questions remain. The percentage of differentially expressed elements on the arrays, especially random genomic clones, is much lower and the magnitude of change in expression levels is smaller than other eukaryotes. As many have suggested, this may be attributable to the polycistronic transcription and post-transcriptional regulation seen in kinetoplastids. In this case, other protein-based methods may be required to unravel the gene expression that underlies the key phenotypes that determine pathogenesis. Unfortunately, such techniques are likely to substantially lengthen the process from screening to identification and isolation of new genes. However, greater differences in mRNA abundance may also be revealed in the pool of actively translated messages. Such mRNA can be enriched by centrifugal isolation of polyribosome associated RNA. This approach is supported by the observation that T. cruzi mRNA for metacyclogenin is present exclusively in differentiating cells when the poly-ribosome fraction is isolated, but equally represented in proliferating and differentiating cells when total RNA is compared [35]. Microarray results for T. cruzi also suggest that polysomal mobilization of mRNA has an important role in gene expression regulation. Polyribosome associated RNA analysis could also assist in solving the second fundamental question, "how closely does mRNA abundance predict the abundance of the protein it encodes". This question will also be addressed by comparing developmental changes in the transcriptome and the proteome using material harvested from the same cultures of parasites [61]. The next few years should witness the most exciting stage as microarrays are applied to questions of gene expression that have been difficult to address previously. Complex phenotypes are likely to be the summation of the effect of multiple genes. Screening techniques that have looked for such genes in the past have either measured small groups of genes a few at a time or
The Application of Gene Expression Microarray Technology
Current Molecular Medicine, 2004, Vol. 4, No. 6
619
Table 2. Potential challenges in kinetoplastid pathogenesis to address with microarray analysis. Challenge
Microarray approach
Potential contribution
Drug resistance
Compare drug resistant and susceptible strains
Candidate genes for the basis of resistance
Post kala azar dermal leishmaniasis (PKDL)
Compare PKDL strains to kala azar strains
Candidate genes for maintenance of the PKDL phenotype
Regulation of differentiation -identification of immediate early genes
Compare a life cycle stage to parasites collected at short intervals during differentiation to the subsequent stage
Candidate genes uniquely expressed at the time of differentiation
Coordinate expression of genes on a common pathway
Identify genes with clustered expression patterns
New genes in known pathways
Kinetoplastid gene regulation
Compare homologies in the 3’ untranslated region of coordinately expressed genes
Regulatory sequence motifs
Attenuated parasites for vaccines
Compare genetically altered parasites to wild type
Compensatory changes in gene expression that may be targeted for further attenuation
measured differential RNA levels that were not reproducible. With the microarray, large unbiased collections of genes can be screened simultaneously for their role in critical traits or stages and a manageable number selected for further analysis (Table 2). Drug resistant strains of L. donovani have been collected and their drug resistance maintained in the laboratory [81]. Microarray analysis could compare these strains to susceptible strains and pinpoint which genes are activated or suppressed to achieve the drug-resistant phenotype. Similar studies of L. m a j o r using genomic [82] or proteomic [83] approaches could be extended with microarray analysis. The genetic basis of drug resistance described for other parasites [84] could also emerge from microarray studies. Post kala azar dermal leishmaniasis (PKDL) may result from a complex interaction between the immune system of the infected person and genetic changes in the parasite. Microarray comparison of gene expression in PKDL strains [71] and kala azar strains may reveal changes in the parasites. Such newly discovered genes could open the way for better treatment of PKDL. The genes responsible for maintenance of the stage in the life cycle of these parasites that survives inside the human host have long been sought as ideal targets for therapeutic drugs. The in vitro differentiation system in use for L. donovani [25, 31] permits collection of sufficient RNA samples from multiple time points of a population synchronously differentiating into the amastigote, the form found intracellularly in the mammalian host. Comparing such differentiation time points to log phase promastigotes on the microarray could identify immediate early genes expressed uniquely at the time of differentiation not previously observed in comparisons of fully differentiated promastigotes and amastigotes. Clustering of cDNAs with a common pattern of expression revealed potential pathway-specific
genes [61]. One such cluster contained some genes that play a role in the antioxidant pathway. The functions of 66 other unknown genes in the cluster could be revealed by microarray experiments comparing untreated to oxidant stressed cells. Recognizing that the abundance of kinetoplastid mRNAs is determined largely by sequences in the 3’untranslated regions, clusters of coordinately regulated genes identified in microarray analysis could be compared for homologies in this region. Identification of conserved sequence or secondary structural elements could further unlock the mystery of gene regulation in this primitive order of eukaryotes. Attenuated parasite vaccines, shown to be more effective than simple component vaccines [4], are unacceptable because they have not been genetically defined or present too much risk of reversion to a virulent state [9]. Alteration of specific targeted genes has the potential to overcome the problem of undefined attenuation [11, 85, 86]. However, these single changes may be the most susceptible to reversion or may not be satisfactory for cross species protection [87]. Microarray comparison of genetically altered and wild type parasites could identify compensatory changes in gene expression that could be targeted for further manipulation. Such additional alterations could result in parasites less likely to revert to the virulent form or better able to establish an asymptomatic infection that elicits a sufficient immune response. In conclusion, the development of microarrays of genomic or cDNA clones of Leishmania a n d Trypanosoma are part of the new wave of molecular genetic technologies that hold great promise for progress in alleviating the suffering that results from infections with these protozoan parasites.
ACKNOWLEDGEMENTS We appreciate the technical assistance of LaPrecious Harrold, Sarah Linke, Heather Hairston
620
Current Molecular Medicine, 2004, Vol. 4, No. 6
Duncan et al.
and Neha Kumar. Financial support in the form of an Overseas
[13]
Associateship to Neena Goyal by the Department of Biotechnology, New Delhi, India is gratefully acknowledged.
[14]
ABBREVIATIONS
[15] [16] [17]
DNA
= Deoxyribonucleic acid
PARP
= Procyclic acid repeat protein
[18]
VSG
= Variant surface glycoprotein
[19]
cDNA
= Complementary DNA
[20]
RNA
= Ribonucleic acid
[21]
mRNA
= Messenger RNA
[22]
PCR
= Polymerase chain reaction
kb
= Kilobase pairs
bp
= Base pairs
oligo dT = Short chain of deoxyribothymidine nucleic acid
[23] [24] [25] [26]
log2
= Logarithm to the base 2
[27]
lowess
= Locally weighted linear regression
[28]
A/P
= Amastigote/promastigote ratio
32P
= Radioactive phosphorous
rRNA
= Ribosomal RNA
Cy3
= Cyanine 3 green fluorescent dye
Cy5
= Cyanine 5 red fluorescent dye
[29] [30] [31] [32]
RT-PCR = Reverse transcriptase synthesis of cDNA followed by PCR
[33]
RDE
= Representation of differential expression
[34]
PKDL
= Post kala azar dermal leishmaniasis
[35]
REFERENCES
[36]
[1] [2] [3]
[37] [38]
[4] [5] [6] [7] [8] [9] [10] [11]
[12]
Desjeux, P. (1992) World Health Stat. Q. 45 (2-3), 267-275. Herwaldt, B.L. (1999) Lancet 354 (9185), 1191-1199. El-Sayed, N.M., Hegde, P., Quackenbush, J., Melville, S.E. and Donelson, J.E. (2000) Int. J. Parasitol. 30 (4), 329-345. Rivier, D., Bovay, P., Shah, R., Didisheim, S. and Mauel, J. (1999) Parasite Immunol. 21 (9), 461-473. Lubega, G.W., Byarugaba, D.K. and Prichard, R.K. (2002) Exp. Parasitol. 102 (1), 9-22. Vasconcelos, J.R., Boscardin, S.B., Hiyane, M.I., Kinoshita, S.S., Fujimura, A.E. and Rodrigues, M.M. (2003) Immunol. Cell Biol. 81 (2), 121-129. Planelles, L., Thomas, M.C., Alonso, C. and Lopez, M.C. (2001) Infect. Immun. 69 (10), 6558-6563. Paiva, C.N., Castelo-Branco, M.T., Rocha, J.A., Lannes-Vieira, J. and Gattass, C.R. (1999) Parasitol. Res. 85 (12), 1012-1017. Handman, E. (2001) Clin. Microbiol. Rev. 14 (2), 229-243. Titus, R.G., Gueirps-Filho, F.J. and al., e. (1995) Proc. Natl. Acad. Sci. USA 92, 10267-10271. Amaral, V.F., Teva, A., Oliveira-Neto, M.P., Silva, A.J., Pereira, M.S., Cupolillo, E., Porrozzi, R., Coutinho, S.G., Pirmez, C., Beverley, S.M. and Grimaldi, G., Jr. (2002) Mem. Inst. Oswaldo. Cruz. 97 (7), 1041-1048. Jacobs, S. (2002) N. Engl. J. Med. 347 (22), 1737-1738.
[39] [40] [41] [42] [43]
[44] [45]
Sundar, S., Jha, T.K., Thakur, C.P., Engel, J., Sindermann, H., Fischer, C., Junge, K., Bryceson, A. and Berman, J. (2002) N. Engl. J. Med. 347 (22), 1739-1746. Murta, S.M., Ropert, C., Alves, R.O., Gazzinelli, R.T. and Romanha, A.J. (1999) Parasite Immunol. 21 (10), 535-544. Legros, D., Ollivier, G., Gastellu-Etchegorry, M., Paquet, C., Burri, C., Jannin, J. and Buscher, P. (2002) Lancet Infect. Dis. 2 (7), 437-440. Sacks, D.L. and Perkins, P.V. (1985) Am. J. Trop. Med. Hyg. 34 (3), 456-459. Molyneux, D. and Killick-Kendrick, R. (1987) Academic Press pp. 121-176. Mukkada, A.J., Meade, J.C., Glaser, T.A. and Bonventre, P.F. (1985) Science 229 (4718), 1099-1101. McConville, M.J. and Blackwell, J.M. (1991) J. Biol. Chem. 266 (23), 15170-15179. Alexander, J. and Russell, D.G. (1992) Adv. Parasitol. 32, 175254. Cunningham, M.L., Titus, R.G., Turco, S.J. and Beverley, S.M. (2001) Science 292 (5515), 285-287. Shapira, M., McEwen, J.G. and Jaffe, C.L. (1988) EMBO. J. 7 (9), 2895-2901. Turco, S.J. and Sacks, D.L. (1991) Mol. Biochem. Parasitol. 45 (1), 91-99. Kidane, G.Z., Samaras, N. and Spithill, T.W. (1989) J. Biol. Chem. 264 (7), 4244-4250. Joshi, M., Dwyer, D.M. and Nakhasi, H.L. (1993) Mol. Biochem. Parasitol. 58, 345-354. Coulson, R.M.R. and Smith, D.F. (1990) Mol. Biochem. Parasitol. 40, 63-76. Charest, H. and Matlashewski, G. (1994) Mol. Cell. Biol. 14 (5), 2975-2984. Cairns, B.R., Collard, M.W. and Landfear, S.M. (1989) Proc. Natl. Acad. Sci. USA 86 (20), 7682-7686. Bellatin, J.A., Murray, A.S., Zhao, M. and McMaster, W.R. (2002) Exp. Parasitol. 100 (1), 44-53. Wiesgigl, M. and Clos, J. (2001) Mol. Biol. Cell 12 (11), 33073316. Duncan, R., Alvarez, R., Jaffe, C., Wiese, M., Klutch, M., Shakarian, A., Dwyer, D. and Nakhasi, H.L. (2001) Parasit. Res. 87, 897-906. Tyler, K.M. and Engman, D.M. (2001) Int. J. Parasitol. 31 (5-6), 472-481. Huang, H., Werner, C., Weiss, L.M., Wittner, M. and Orr, G.A. (2002) Int. J. Parasitol. 32 (9), 1107-1115. Furuya, T., Kashuba, C., Docampo, R. and Moreno, S.N. (2000) J. Biol. Chem. 275 (9), 6428-6438. Avila, A.R., Yamada-Ogatta, S.F., da Silva Monteiro, V., Krieger, M.A., Nakamura, C.V., de Souza, W. and Goldenberg, S. (2001) Mol. Biochem. Parasitol. 117 (2), 169-177. Krieger, M.A., Avila, A.R., Ogatta, S.F., Plazanet-Menut, C. and Goldenberg, S. (1999) Mem. Inst. Oswaldo. Cruz. 94, Suppl. 1, 165-168. Gull, K. (2001) Int. J. Parasitol. 31 (5-6), 443-452. Cross, G.A., Wirtz, L.E. and Navarro, M. (1998) Mol. Biochem. Parasitol. 91 (1), 77-91. Pays, E. and Nolan, D.P. (1998) Mol. Biochem. Parasitol. 91 (1), 3-36. Borst, P., Bitter, W., Blundell, P.A., Chaves, I., Cross, M., Gerrits, H., van Leeuwen, F., McCulloch, R., Taylor, M. and Rudenko, G. (1998) Mol. Biochem. Parasitol. 91 (1), 67-76. DeRisi, J., Penland, L., Brown, P.O., Bittner, M.L., Meltzer, P.S., Ray, M., Chen, Y., Su, Y.A. and Trent, J.M. (1996) Nat. Genet. 14 (4), 457-460. Schena, M., Shalon, D., Davis, R.W. and Brown, P.O. (1995) Science 270 (5235), 467-470. Alizadeh, A., Eisen, M., Davis, R.E., Ma, C., Sabet, H., Tran, T., Powell, J.I., Yang, L., Marti, G.E., Moore, D.T., Hudson, J.R., Jr., Chan, W.C., Greiner, T., Weisenburger, D., Armitage, J.O., Lossos, I., Levy, R., Botstein, D., Brown, P.O. and Staudt, L.M. (1999) Cold Spring Harb. Symp. Quant. Biol. 64, 71-78. White, K.P., Rifkin, S.A., Hurban, P. and Hogness, D.S. (1999) Science 286 (5447), 2179-2184. Chu, S., DeRisi, J., Eisen, M., Mulholland, J., Botstein, D., Brown, P.O. and Herskowitz, I. (1998) Science 282 (5389), 699705.
The Application of Gene Expression Microarray Technology [46] [47] [48] [49] [50] [51]
[52] [53]
[54] [55] [56] [57] [58] [59] [60] [61]
[62] [63] [64]
Hayward, R.E., Derisi, J.L., Alfadhli, S., Kaslow, D.C., Brown, P.O. and Rathod, P.K. (2000) Mol. Microbiol. 35 (1), 6-14. Bozdech, Z., Zhu, J., Joachimiak, M.P., Cohen, F.E., Pulliam, B. and DeRisi, J.L. (2003) Genome. Biol. 4 (2), R9. Singh, U., Brewer, J.L. and Boothroyd, J.C. (2002) Mol. Microbiol. 44 (3), 721-733. Cleary, M.D., Singh, U., Blader, I.J., Brewer, J.L. and Boothroyd, J.C. (2002) Eukaryot. Cell 1 (3), 329-340. Stiles, J.K., Hicock, P.I., Shah, P.H. and Meade, J.C. (1999) Ann. Trop. Med. Parasitol. 93 (8), 781-807. Myler, P.J., Beverley, S.M., Cruz, A.K., Dobson, D.E., Ivens, A.C., McDonagh, P.D., Madhubala, R., Martinez-Calvillo, S., Ruiz, J.C., Saxena, A., Sisk, E., Sunkin, S.M., Worthey, E., Yan, S. and Stuart, K.D. (2001) Med. Microbiol. Immunol. 190 (1-2), 9-12. Akopyants, N.S., Clifton, S.W., Martin, J., Pape, D., Wylie, T., Li, L., Kissinger, J.C., Roos, D.S. and Beverley, S.M. (2001) Mol. Biochem. Parasitol. 113 (2), 337-340. Beverley, S.M., Akopyants, N.S., Goyard, S., Matlib, R.S., Gordon, J.L., Brownstein, B.H., Stormo, G.D., Bukanova, E.N., Hott, C.T., Li, F., MacMillan, S., Muo, J.N., Schwertman, L.A., Smeds, M.R. and Wang, Y. (2002) Philos. Trans. R. Soc. Lond. B. Biol. Sci. 357 (1417), 47-53. Clayton, C.E. (2002) EMBO J. 21 (8), 1881-1888. Myler, P.J., Sisk, E., McDonagh, P.D., Martinez-Calvillo, S., Schnaufer, A., Sunkin, S.M., Yan, S., Madhubala, R., Ivens, A. and Stuart, K. (2000) Biochem. Soc. Trans. 28 (5), 527-531. D'Orso, I., De Gaudenzi, J.G. and Frasch, A.C. (2003) Trends Parasitol. 19 (4), 151-155. Furger, A., Schurch, N., Kurath, U. and Roditi, I. (1997) Mol. Cell. Biol. 17 (8), 4372-4380. Boucher, N., Wu, Y., Dumas, C., Dube, M., Sereno, D., Breton, M. and Papadopoulou, B. (2002) J. Biol. Chem. 277 (22), 1951119520. Myung, K.S., Beetham, J.K., Wilson, M.E. and Donelson, J.E. (2002) J. Biol. Chem. 277 (19), 16489-16497. Saxena, A., Worthey, E.A., Yan, S., Leland, A., Stuart, K.D. and Myler, P.J. (2003) Mol. Biochem. Parasitol. 129 (1), 103-114. Almeida, R., Norrish, A., Levick, M., Vetrie, D., Freeman, T., Vilo, J., Ivens, A., Lange, U., Stober, C., McCann, S. and Blackwell, J.M. (2002) Philos. Trans. R. Soc. Lond. B. Biol. Sci. 357 (1417), 5-11. Sacks, D.L. (1989) Exp. Parasitol. 69 (1), 100-103. DeRisi, J.L., Iyer, V.R. and Brown, P.O. (1997) Science 278 (5338), 680-686. Li, S., Wilson, M.E. and Donelson, J.E. (1996) Exp. Parasitol. 82 (2), 87-96.
Current Molecular Medicine, 2004, Vol. 4, No. 6 [65] [66] [67] [68] [69] [70] [71] [72] [73] [74] [75] [76] [77] [78] [79] [80] [81] [82] [83] [84] [85] [86] [87]
621
Flinn, H.M., Rangarajan, D. and Smith, D.F. (1994) Mol. Biochem. Parasitol. 65 (2), 259-270. Nourbakhsh, F., Uliana, S.R. and Smith, D.F. (1996) Mol. Biochem. Parasitol. 76 (1-2), 201-213. Knuepfer, E., Stierhof, Y.D., McKean, P.G. and Smith, D.F. (2001) Biochem. J. 356 (Pt 2), 335-344. Searle, S., Campos, A.J., Coulson, R.M., Spithill, T.W. and Smith, D.F. (1989) Nucleic Acids Res. 17 (13), 5081-5095. Kreutzer, R.D. and Christensen, H.A. (1980) Am. J. Trop. Med. Hyg. 29 (2), 199-208. Jaffe, C.L., Bennett, E., Grimaldi, G., Jr. and McMahon-Pratt, D. (1984) J. Immunol. 133 (1), 440-447. Salotra, P., Sreenivas, G., Pogue, G.P., Lee, N., Nakhasi, H.L., Ramesh, V. and Negi, N.S. (2001) J. Clin. Microbiol. 39 (3), 849-854. Dwyer, D.M. (1976) J. Immunol. 117 (6), 2081-2091. Gupta, N., Goyal, N., Kumar, R., Agrawal, A.K., Seth, P.K. and Rastogi, A.K. (1996) Trop. Med. Int. Health. 1 (4), 495-502. Yang, Y.H., Dudoit, S., Luu, P., Lin, D.M., Peng, V., Ngai, J. and Speed, T.P. (2002) Nucleic Acids Res. 30 (4), e15. Quackenbush, J. (2002) Nat. Genet. 32 Suppl. 496-501. Cleveland, W.S. (1979) J. Amer. Stat. Assoc. 74, 829-836. Pogue, G.P., Lee, N.S., Koul, S., Dwyer, D.M. and Nakhasi, H.L. (1995) Gene 165 (1), 31-38. Diehl, S., Diehl, F., El-Sayed, N.M., Clayton, C. and Hoheisel, J.D. (2002) Mol. Biochem. Parasitol. 123 (2), 115-123. Ziegelbauer, K., Multhaup, G. and Overath, P. (1992) J. Biol. Chem. 267 (15), 10797-10803. Chaudhuri, M. and Hill, G.C. (1996) Mol. Biochem. Parasitol. 83 (1), 125-129. Lira, R., Sundar, S., Makharia, A., Kenney, R., Gam, A., Saraiva, E. and Sacks, D. (1999) J. Infect. Dis. 180 (2), 564-567. Cotrim, P.C., Garrity, L.K. and Beverley, S.M. (1999) J. Biol. Chem. 274 (53), 37723-37730. Drummelsmith, J., Brochu, V., Girard, I., Messier, N. and Ouellette, M. (2003) Mol. Cell Proteomics 2 (3), 146-155. Bray, P.G., Barrett, M.P., Ward, S.A. and de Koning, H.P. (2003) Trends Parasitol. 19 (5), 232-239. Selvapandiyan, A., Duncan, R., Debrabant, A., Bertholet, S., Sreenivas, G., Negi, N.S., Salotra, P. and Nakhasi, H.L. (2001) J. Biol. Chem. 276 (46), 43253-43261. Debrabant, A., Lee, N., Pogue, G.P., Dwyer, D.M. and Nakhasi, H.L. (2002) Int. J. Parasitol. 32 (11), 1423-1434. Streit, J.A., Recker, T.J., Filho, F.G., Beverley, S.M. and Wilson, M.E. (2001) J. Immunol. 166 (3), 1921-1929.