averaging does not reduce the bias in the estimate. With the Burg algorithm for ... Burg algorithm [4], [5] is the preferred estimator for AR-param- eters [6].
2876
IEEE TRANSACTIONS ON SIGNAL PROCESSING, VOL. 48, NO. 10, OCTOBER 2000
The Burg Algorithm for Segments Stijn de Waele and Piet M. T. Broersen
Abstract—In many applications, the duration of an uninterrupted measurement of a time series is limited. However, it is often possible to obtain several separate segments of data. The estimation of an autoregressive model from this type of data is discussed. A straightforward approach is to take the average of models estimated from each segment separately. In this way, the variance of the estimated parameters is reduced. However, averaging does not reduce the bias in the estimate. With the Burg algorithm for segments, both the variance and the bias in the estimated parameters are reduced by fitting a single model to all segments simultaneously. As a result, the model estimated with the Burg algorithm for segments is more accurate than models obtained with averaging. The new weighted Burg algorithm for segments allows combining segments of different amplitudes. Index Terms—Segmented data, time-series analysis.
I. INTRODUCTION
A
UTOREGRESSIVE (AR) modeling is used for analyzing stationary stochastic processes for many different applications, e.g., radar [1], geophysics [2], and economics [3]. A comparison of various estimators of AR-parameters showed that the Burg algorithm [4], [5] is the preferred estimator for AR-parameters [6]. The Yule–Walker algorithm can be severely biased. After a large true reflection coefficient, estimates for higher order reflection coefficients suffer from a bias of order 1 instead of the smaller bias of order 1/ that is present in other estimation methods. The least squares estimator and the forward-backward least squares estimator have a greater variance than Burg. In addition, they may yield unstable models. In many applications, the duration of one uninterrupted measurement is submitted to practical limitations. However, it is often possible to obtain several separate segments of data. The Burg algorithm has been reformulated so that it can be used to analyze this type of data [7]. An example of the application of this generalized Burg algorithm is the estimation of a sea clutter model from radar data. The advantage of estimating a clutter model from the data at hand, rather than using a predefined model, is that the model is automatically adapted to the current environmental conditions. The clutter model can be used for target detection: Statistically significant deviations from clutter indicate a possible target [8]. The generalized Burg algorithm can be used to obtain an accurate clutter model by combining the information in adjacent range cells into a single clutter model. A more accurate clutter model results in more effective target detection. Manuscript received July 21, 1999; revised June 5, 2000. The associate editor coordinating the review of this paper and approving it for publication was Dr. Lal C. Godara. The authors are with the Department of Applied Physics, Delft University of Technology, Delft, The Netherlands. Publisher Item Identifier S 1053-587X(00)07643-1.
The usual way of combining the information of segments is to take the average of the models estimated from the individual segments [9]. This will reduce the variance present in the estimate. However, AR estimation methods also contain a bias. The bias in the AR parameters is proportional to 1/ , where is the number of observations [10]. Taking the average of the models estimated from the individual segments does not reduce this bias. The influence of the bias can be neglected when the number of observations per segment tends to infinity, whereas the number of segments is fixed. In this asymptotic regime, all methods for obtaining a model from segments are equivalent. Therefore, the asymptotic regime cannot be used to discern between the various methods for combining the information in the segments. To do this, the situation with many segments, each with a finite number of observations, has to be considered. In this regime, the bias in the estimated parameters becomes important. II. THE BURG ALGORITHM FOR SEGMENTS An autoregressive process is a (possibly complex-valued) stagenerated by the following differtionary stochastic signal ence equation [11]: (1) is a white noise signal. The mean of the signal is dewhere noted . In this process, segments are given. In each segment, the process is considered to be stationary. The Burg algorithm for segments can be derived for segments of varying length. For the sake of simplicity of formulae, the segments will be presumed to be of equal length in the derivation given here. Ob. servation of segment will be denoted All properties of the Burg algorithm for segments that are discussed are also valid for segments of varying length. The Burg algorithm estimates the AR parameters by determining reflection coefficients that minimize the sum of forward and backward residuals. The extension of the algorithm to segments is that the reflection coefficients are estimated by minimizing the sum of forward and backward residuals of all segments taken together. This means a single model is fitted to all segments in one time. This concept is also used for prediction error methods in system identification, where the input to the system is known, like in ARX modeling [12]. The advantage of this approach can be illustrated by looking at two ways of dealing with the signal mean . Before estimating the AR parameters of a signal with nonzero mean, the estimated mean must be subtracted. Due to the fact that an estimate of the
1053–587X/00$10.00 © 2000 IEEE
DE WAELE AND BROERSEN: THE BURG ALGORITHM FOR SEGMENTS
2877
mean is subtracted instead of the true mean, this subtraction introduces bias in the estimated AR parameters [11]. Treatment of the mean for unsegmented data with maximum likelihood can be found in [13]. The mean can be estimated and subtracted for each segment individually. Alternatively, a single estimate of the mean can be obtained from all segments taken together. As this estimate of the mean is more accurate, the bias in the model parameters caused by subtraction of the estimated mean will be reduced. When the segments are treated separately, the bias will not decrease when the number of segments is increased. Obviously, the single estimate for the mean should only be used when all segments are obtained from signals with the same mean. Some steps of the derivation of the Burg algorithm will be discussed to show the implications of fitting a model to all segments simultaneously. In the Burg algorithm, reflection coefficients are estimated directly with a recursive algorithm [14]. In each recursion step, a single reflection coefficient is estimated. model is To estimate the th reflection coefficient an AR reflection coefficients fitted to the data with the first fixed to the value found in the previous steps. The of step are related to the parameters of the parameters previous step by the Levinson–Durbin algorithm [14]. The new is determined by minimizing the sum reflection coefficient of the forward and backward residuals. The forward residuals and the backward residuals for a th-order model and segment are defined as
(2) An essential characteristic of the Burg algorithm is that the number of residuals decreases with each recursion step. The criterion to be minimized with respect to is the sum of absolute squares of the forward residuals and the backward residuals (3) The forward and backward residuals can be expressed in terms of the forward and backward residuals of the previous step:
(4) For the remainder of the derivation of the Burg estimate, it is convenient to express these equations in vector notation. The following vectors will be used:
(5) In addition, the residuals of the previous iteration step are used in (4). As stated before, the number of residuals decreases
with each iteration step. Therefore, the vectors of residuals from the previous step and do not have the same length and . The vectors of forward and backward residuals as of the previous step with the appropriate length are denoted and :
(6) With these vectors, (4) can be rewritten as
(7) Using the standard inner product the criterion can be written as norm
and
(8) Substitution of (7) and some calculation yields that minimal for
is
(9)
As is the case for the standard Burg algorithm for a single is always smaller than unity. segment, the absolute value of Therefore, the stability of the estimated AR model is guaranteed. As the proof of the stability property is analogous to that given in [14], it will not be given here. The calculations required for the Burg algorithm for segments are very similar to the calculations for Burg applied to each segment separately. The difference is that the information contained in the segments is combined in a single estimate, as given by (9). In the standard criterion (3), all segments are weighted equally. This can be modified by introducing weighting factors for each segment in (3). Like the unweighted algorithm, this weighted Burg algorithm for segments yields an estimated model that is guaranteed to be stable. This can immediately be seen from the fact that the weighted optimization problem can be translated into the original optimization problem with scaled instead of . Since stability of the observations original solution (9) is guaranteed for all sets of observations, this proves that the estimated model found with the modified criterion will also be stable. An example of the application of the weighted algorithm is the situation where the various segments are realizations of a stochastic process with the same autocorrelation function but with a different variance. This can be taken into account by using the inverse of the standard deviation of the segment as weight in the weighted algorithm. The estimate found from several short segments will be less accurate than the estimate from one uninterrupted measurement. This is caused by the fact that for the first observations of a segment the residuals are not calculated since not all previous observations required for these residuals are known. Therefore,
2878
IEEE TRANSACTIONS ON SIGNAL PROCESSING, VOL. 48, NO. 10, OCTOBER 2000
only NS-pS residuals are available. If one uninterrupted measurement of length NS is available, only the first residuals are not calculated, leaving NS-p residuals. Moreover, the maximum model order that can be considered a candidate for order selection is higher for the uninterrupted measurement. The number of parameters that is used to describe the data can be obtained by order selection using an order selection criterion such as Akaike’s information criterion (AIC) [15]. When only one segment of length is available, the AIC is given by AIC
RES
(10)
is equal to the residual variance of the model of where RES order . When a single model is estimated from independent segments of length , the variance of the estimated parameters asymptotically decreases by a factor of . This means the AIC for segments (AICS) is given by AIC
RES
(11)
When the model order , which is considered is greater than 0.1 , finite sample effects must be taken into account [6]. If the in (11) should be replaced by the segments are dependent, effective number of degrees of freedom. III. AVERAGING METHODS With averaging methods, the information of the segments is combined by averaging the results of the individual segments. In this way, the variance of the estimate is reduced. However, averaging does not reduce the bias present in the estimates. The exact result of this approach depends on the model representation that is used. For a general representation, which is denoted , the averaging method can be written as (12) Some representations used for averaging are the following: ; • first autocorrelations ; • first autocovariances ; • reflection coefficients . • parameters in the difference equation Another representation that can be used for averaging is the or, equivalently, the entire covariance power spectrum function . The average of the entire covariance function of AR processes cannot be written as the covariance function of process because the average of the entire covariance an AR processes is the covariance function of an function of AR process. However, an AR process can ARMA be fitted to this average covariance function by determining the model with the smallest error with respect to the average AR covariance function. This model is completely determined by the first autocovariances. As a result, this procedure is equivalent to averaging the first autocovariances. Three distinct estimators for the autocovariance could be used for averaging: the unbiased sample covariances, the biased sample covariances, and covariances calculated from the Burg reflection coefficients. The unbiased sample covariances may
yield an estimate that is not a valid covariance function because it is not positive definite [11]. The biased sample autocovariances contain the same large bias as the Yule–Walker estimator. The Burg covariance function is guaranteed to be positive definite and contains only a small bias. Therefore, the Burg covariance function will be used. Similarly, the correlation function will be calculated from the Burg reflection coefficients. and In the asymptotic regime, all representations used for averaging are equivalent. However, for finite samples, the various approaches have some distinguishing properties. The average of parameters is not guaranteed to yield a stationary model as the average model. The remaining representations mentioned do result in a stationary model under all conditions. A comparison of reflection coefficients and parameters as a representation for averaging showed that averaging reflection coefficients is more accurate [9]. For speech processing, a comparison of a wider range of averaging provides methods showed that averaging autocovariances the most accurate model [16]. A common disadvantage of averaging methods is that the bias in the estimated parameters is not reduced as a result of averaging. The bias in the parameters is dependent on the number of observations. Exact results for the bias are difficult to obtain. Approximate results using Taylor expansion for the leastsquares AR estimator show that the bias for the reflection coefficient of an AR(1) process is inversely proportional to the number of observations per segment [10] (13) This bias is called Taylor bias. The bias will increase for higher model orders and for a greater dynamic range in the spectrum. This is proved in [10] for processes of order equal to 2. For the Burg estimator, no theoretical results have been obtained. However, simulations showed that the bias in the Burg estimator is similar to the bias in the least-squares estimate [10]. The variance of the estimated parameter for an AR(1) process is proportional to 1/ . This is reduced by a factor of as a result of averaging independent contributions var
(14)
Since the contribution of the bias to an error measure such as the prediction error PE is given by the square of the bias (15) the bias will be negligible with respect to the variance if the number of segment is small compared with the number of observations . However, as the number of segments increases, the variance is reduced, whereas the contribution of the bias will remain the same. Then, the influence of the bias will become important. The lack of an exact theoretical description is not a great problem for the current investigation. It is sufficient to acknowledge the existence of the Taylor bias and the fact that averaging does not diminish this bias. Since the Burg algorithm for segments fits a model to all segin ments simultaneously, it is expected that the Taylor bias
DE WAELE AND BROERSEN: THE BURG ALGORITHM FOR SEGMENTS
2879
this estimate will be small. An expression for the bias in can be obtained by using a second-order Taylor approximation of the estimate (9) for [17]. For simplicity of formulae, the analysis is again restricted to segments of equal length. Each segment’s contribution to the expectation of the denominator is assumed to be equal to the signal variance . This is a sufficiently accurate approximation for the current calculation. The resulting expression for the bias is
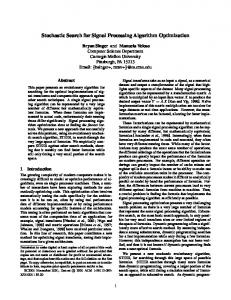
TABLE I COMPARISON OF THE BURG ALGORITHM FOR SEGMENTS (BURG-S) AND THE 10 SEGMENTS OF 20 OBSERVATIONS AVERAGING METHODS FOR EACH. THE SIGNAL IS GENERATED BY AN AR(10)-PROCESS CHARACTERIZED BY THE PARAMETER . THE MODEL ERROR ME WAS AVERAGED OVER 50 000 SIMULATION RUNS FOR EACH VALUE OF
S=
h
N=
h
cov var
(16)
For independent segments, the (co)variances in this expression reduce to times the (co)variance in a single segment. As can be expressed in terms of the bias in a a result, the bias single segment cov cov
(17)
Substitution of (13) for yields that the bias is inversely proportional to the total number of observations (18)
IV. COMPARISON OF AVERAGING METHODS AND BURG Burg for segments is compared with the averaging methods in two simulation experiments. In the first experiment, the two approaches are compared in an example with a moderate number of segments. In the second experiment, a very large number of segments is analyzed to study the bias present in both methods. Finally, some comments are made regarding the number of computations required for the various methods. The stationary stochastic process used in these simulations is generated by an AR(10) process with ten equal reflection coefficients . The value of is varied to generate a range of signals with different properties. From this signal, an AR(10) model is estimated with Burg for segments and the averaging methods. The mean of the signal is considered known. The difference between the true signal properties and the estimated signal properties is expressed using the model error ME [18]. The model error is a normalized version of the one-step-ahead prediction error PE ME
PE
(19)
where PE is the expectation of the squared difference between and the one-step-ahead prediction based on the previous observations and the estimated model PE (20)
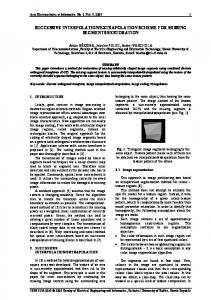
The expectation is the average over all possible realizaand not the fit to the realization used tions of the process for parameter estimation. The model error contains contributions of both the variance and the squared bias in a way that is significant for the use of the models. The behavior of the Burg algorithm can be described using the finite sample formulae for the prediction error PE [6]. If one uninterrupted measurement is available, the model error would be approximately equal to the number of parameters 10. In the first simulation experiment, the various methods have segments of observations. been compared for This example is representative for radar processing practice. The results are given in Table I. The value for the model error calculated using the finite sample formulae is 14.7. The results for the new Burg algorithm remain more or less the same for all values of , whereas the averaging methods deteriorate for large values of . As stated before, there are no theoretical results for the bias in the Burg estimator. However, the bias can be examined in simulations by taking a very large number of segments. Then, the variance of the estimates is greatly reduced by averaging, whereas the bias remains present. In this way, a clear picture of the bias in the averaging methods is obtained. This has been done in the second simulation experiment, where the various 10 000 segments of methods have been compared for 20 observations. The results are given in Table II. The value for the model error that is calculated using the finite sample formulae is 14.4. The Burg algorithm for segments effectively combines the information in the segments, thus reducing the Taylor bias. The model error is only a result of the variance of the estimated parameters as predicted by the finite sample formulae. The averaging methods are biased. For all of the averaging methods, the bias increases for higher values of . This agrees with the behavior of the bias in simple model structures, as described in [10]. The exact amount of bias depends on the model representation used for averaging. A comparison of the results of the two simulation experiments clearly shows that the deterioration of the averaging methods in the first experiment can be ascribed to the bias.
2880
IEEE TRANSACTIONS ON SIGNAL PROCESSING, VOL. 48, NO. 10, OCTOBER 2000
TABLE II COMPARISON OF THE BURG ALGORITHM FOR SEGMENTS (BURG-S) AND THE 10 000 SEGMENTS OF 20 OBSERVATIONS AVERAGING METHODS FOR EACH. THE SIGNAL IS GENERATED BY AN AR(10)-PROCESS CHARACTERIZED BY THE PARAMETER . THE MODEL ERROR ME WAS AVERAGED OVER 100 SIMULATION RUNS FOR EACH VALUES OF
S=
h
N=
h
from white noise. With the Burg algorithm for segments, both the variance and the bias in the estimated parameters are reduced. As a result, the Burg algorithm for segments provides more accurate models than the averaging methods. REFERENCES
It can be concluded that the Burg algorithm for segments provides more accurate models than any of the averaging methods. How does it compare with the averaging methods in terms of numerical workload? As remarked in Section II, the calculations for Burg for segments are very similar to the calculations for Burg applied to each segment separately. This means that the computational effort required for averaging methods and Burg for segments are practically the same. However, averaging covariances, correlations, and parameters requires a transformation of the estimated reflection coefficients to the representation used for averaging. Therefore, the number of calculations required for these methods will be somewhat greater. A drawback of the Burg algorithm for segments is that exchanging a single segment for a new segment requires new processing of all segments. The estimate of the first reflection coefficients will be different as a result of the new segment. This reflection coefficient is used to find the residuals with (4). In this way, the new segment influences the contribution of all other segments for subsequent reflection coefficients. V. CONCLUSIONS The Burg algorithm for segments effectively combines the information contained in segments of data. The new weighted Burg algorithm allows combining segments of different amplitudes. The estimated model is stable under all conditions. The Burg algorithm for segments has been compared with averaging methods. The numerical workload is comparable with that of the averaging methods. With averaging methods, the variance in the estimated parameters is effectively reduced. However, the Taylor bias is not diminished. The influence of this bias becomes more prominent when the number of segments is large or when the process under consideration deviates considerably
[1] S. Haykin, Nonlinear Methods of Spectral Analysis, S. Haykin, Ed. Berlin, Germany: Springer-Verlag, 1979. [2] P. Yuou, E. Baert, and M. F. Loutre, “Spectral analysis of climate data,” Survey Geophys., vol. 17, pp. 619–663, 1996. [3] G. E. P. Box and G. M. Jenkins, Time Series Analysis: Forecasting and Control. San Francisco, CA: Holden-Day, 1970. [4] J. P. Burg, “Maximum entropy spectral analysis,” in Proc. 37th Meet. Soc. Explorational Geophys., Oklahoma City, OK, 1967. [5] S. M. Kay and S. L. Marple, “Spectrum analysis—A modern perspective,” Proc. IEEE, vol. 69, pp. 1380–1419, 1981. [6] P. M. T. Broersen, “The ABC of autoregressive order selection criteria,” in Proc. Sysid Conf., Kitakyushu, Japan, July 8–11, 1997, pp. 231–236. [7] S. Haykin, B. W. Currie, and S. B. Kesler, “Maximum-entropy spectral analysis of radar clutter,” Proc. IEEE, vol. 70, 1982. [8] M. I. Skolnik, Introduction to Radar Systems. Auckland, New Zealand: McGraw-Hill, 1981. [9] A. A. Beex and M. D. A. Rahman, “On averaging Burg spectral estimators for segments,” IEEE Trans. Acoust., Speech, Signal Processing, vol. ASSP-34, pp. 1473–1484, Dec. 1986. [10] D. Tjøstheim and J. Paulsen, “Bias of some commonly-used time series estimates,” Biometrica, vol. 70, pp. 389–399, 1983. [11] M. B. Priestley, Spectral Analysis and Time Series. London, U.K.: Academic, 1981. [12] L. Ljung, System Identification for the User, 2nd ed. Englewood Cliffs, NJ: Prentice-Hall, 1999. [13] T. W. Anderson, The Statistical Analysis of Time Series. New York: Wiley, 1971. [14] P. Stoica and R. L. Moses, Introduction to Spectral Analysis. Upper Saddle River, NJ: Prentice-Hall, 1997. [15] H. Akaike, “A new look at statistical model identification,” IEEE Trans. Automat. Contr., vol. AC-19, pp. 716–723, 1974. [16] J. S. Erkelens and P. M. T. Broersen, “LPC interpolation by approximation of the sample autocorrelation function,” IEEE Trans. Speech Audio Processing, vol. 6, pp. 569–573, Nov. 1998. [17] M. Kendall, A. Stuard, and J. K. Ord, The Advanced Theory of Statistics, Vol. 3, Design and Analysis, Time Series, 4th ed. London, U.K.: Charles Griffin, 1987. [18] P. M. T. Broersen, “The quality of models for ARMA processes,” IEEE Trans. Signal Processing, vol. 46, pp. 1749–1752, 1998.
Stijn de Waele was born in Eindhoven, The Netherlands, in 1973. He received the M.Sc. degree in applied physics in 1998 from the Delft University of Technology, Delft, the Netherlands, where he is currently pursuing the Ph.D. degree. His research is aimed at the development of new time series analysis algorithms and its application to radar processing.
Piet M. T. Broersen was born in Zijdewind, The Netherlands, in 1944. He received the M.Sc. degree in applied physics in 1968 and the Ph.D degree in 1976, both from the Delft University of Technology, Delft, the Netherlands. He is currently with the Department of Applied Physics, Delft University. His research interests are the selection of order and type of time series models and the application to spectral analysis, model building, and feature extraction.