1Department of Biomedical Engineering, New Jersey Institute of Technology, ... and Private Practice West Orange, Chester, Saddle Brook, Westfield, NJ, USA.
The Correlation between Change in NearDissociated Phoria and Vergence Dynamics Eun H. Kim1, Vincent R. Vicci2, Bérangère Granger-Donetti3, and Tara L. Alvarez1 1
Department of Biomedical Engineering, New Jersey Institute of Technology, Newark, NJ, USA Kessler Institute for Rehabilitation and Private Practice West Orange, Chester, Saddle Brook, Westfield, NJ, USA 3 Department of Vision Sciences, Essilor Research & Development, Saint-Maur, Cedex, France
15 Esophoria
I. INTRODUCTION Vergence is the inward (convergence) or outward (divergence) rotation of the two eyes. These movements contract and relax the lateral and medial recti muscles until paired images are projected onto the fovea. In the absence of a binocular stimulus, the eye deviates to its resting position termed dissociated phoria or simply, phoria. There are three types of phorias: 1) esophoria, an inward-lateral deviation, 2) exphoria, an outward-lateral deviation and 3) orthophoria, inertness of the eye. The main objective of this study is to investigate the relationship between changes in phoria level with changes in vergence dynamics as described by the ratio of convergence average peak velocity to divergence average peak velocity. The goal was to determine if changes in phoria would correlate to the changes in the vergence dynamics studying a population with a range of phoria levels. The broader impact and the future direction of this work are to determine if fatigue causes changes in a person’s phoria level thus influencing vergence dynamics. This may infer why some people are more prone to fatigue than others when performing a visual task. II. METHODS Subjects: Five subjects (21 to 29 years of age) participated in the preliminary experiments. The subjects signed informed consent approved by the New Jersey Institute of Technology Institutional Review Board. Experimental Protocol: Each subjects had two experimental sessions. The first session was when the subjects self-reported tiredness and had less than five hours of sleep prior to coming into the experiment and is termed the fatigued session. The second session, non-fatigued session, was when the subjects were well rested and had more than seven hours of sleep the night before.
The preliminary experiment was designed to generate one convergent and divergent stimulus using a 4o step change in disparity vergence. The initial positions of the convergent and divergent stimulus were 8.44o and 12.44o respectively. The subjects performed approximately 25 convergence and divergence steps. The step stimulus presentation was randomized and delayed between 0.5 to 2.0 seconds to ensure that prediction did not influence the results. [1] Stimuli were also presented on a haploscope thus, accommodation was held constant at 40 cm away from the subject’s midline. Phoria was recorded before and after the subjects performed vergence steps. Phoria Measurement: Subjects viewed a 8.44o binocular stimulus which was a pair of vertical lines 40 cm away from the subject’s midline. After 2.5 seconds, the right eye stimulus extinguished so that the right eye decays to its resting position or phoria level. Data are recorded for 15 seconds. Instrumentation: Eye movements were recorded using an infrared (λ=950nm) limbus tracking system by Skalar Iris (model 6500). Data acquisition was sampled at 200 Hz to avoid aliasing of vergence eye movements. The left-eye and righteye responses were saved separately for off-line analysis. Data Analysis: The raw digitized vergence step data were converted into degrees by using the calibration data. Data with saccades and blinks were omitted during the data analysis because previous studies have shown that saccades alter the vergence response. [2] The right-eye response was subtracted from the left-eye response to produce the net vergence position movement. Convergence is plotted as positive and divergence is plotted as negative. The velocity response was computed using a two-point central difference algorithm. [3] These data were analyzed by measuring the magnitude of the peak velocity of both convergence and divergence responses were analyzed. S4
10 5
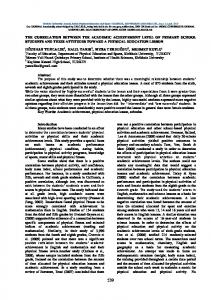
Average of Last 3 sec of Phoria Response in Steady State (7.6 ∆ exo)
0 Exophoria
Abstract- Visual fatigue is defined as weariness or discomfort localized in either the head or the eye after a visually demanding task. The etiology of visual fatigue is insufficiently understood in vision research. This study investigates the correlation between changes of near-dissociated phoria versus vergence dynamics defined as the ratio of convergence average peak velocity to divergence average peak velocity. Four degree convergence and divergence eye movements as well as phoria levels were recorded using an infrared eye movement monitor from five subjects. Preliminary data show a high correlation between the changes in phoria versus the change in vergence dynamics. Results suggest that the amount of changes in the two parameters, phoria and vergence dynamics, are one of many factors which may infer why some people are more prone to visual fatigue than others.
Decay to Phoria Level (∆)
2
-5 -10 -15
0
5
10 Time (15 sec)
Figure 1: A typical right eye movement decay to the phoria response of subject 1, a large exophore.
15
S3
Convergence Amplitude (deg)
6
4
4
2
2
0
Divergence Amplitude (deg)
0
0.5
1
1.5
2
0
0
-2
-2
-4
-4
-6
-6
-8
0
0.5
1
1.5
2
-8
1.1 ∆ eso 0
0.5
0
0.5
1
1.5
2
1
1.5
2
Time (2 sec)
Session 1 Peak Velocity(deg/sec) Session 2 Peak Velocity(deg/sec)
Figure 2: Convergence and divergence eye movements from subject 3 who is an esophore.
30
20
10
0 1
2
3
4
5
20 10 0 1
2
Convergence Peak Velocity
-0.4
-0.6
-0.8
-1
-10
-8 -6 -4 Change in Phoria Level (∆) (Session 2-Session 1)
-2
0
Figure 4: Correlation plot of the change in phoria level versus the change in vergence ratio
Time (2 sec)
30
R2=0.98 -0.2
-12
0
3.4∆ eso
0
-1.2
S3
6
level recorded after performing vergence steps from session 2 is as follows: 7.9∆ exo, 3.3∆exo, 1.1∆eso, 1.0∆eso and 5.5∆ exo from subjects 1 to 5 respectively. The summary of mean peak velocities of convergence and divergence in two sessions are shown in figure 2. The vergence ratio is calculated as the average convergence peak velocity to divergence peak velocity. The correlation plot of change in phoria and the vergence ratio between the two sessions is highly correlated (R2 =0.98) which is shown in figure 4. Change in Peak Velocity (deg/sec) (Session 2-Session 1)
The right eye responses decaying to the phoria level was converted to the units of prism diopters, the clinical standard. The steady state phoria level was calculated by averaging the last three seconds. Esophoria was plotted as positive and exophoria was plotted as negative. Data were quantified and plotted using a custom MATLAB program (Waltham, MA). III. RESULTS Figure 2 shows ensemble 4° vergence responses from subject 3. During session 1 (fatigued session), convergence and divergence peak velocity is 9.7±2.12 and 7.4±1.7 respectively. In session 2 (non-fatigued session), the convergence and divergence peak velocity is 15.4±2.86 and 13.5±2.1 respectively. This subject’s vergence ratio in the first session is 1.31 and during the second session is 1.14. Hence, the difference of vergence ratio between the two sessions is -0.16. Session 1 Responses Session 2 Responses
3
4
5
Divergence Peak Velocity
Figure 3: Peak velocity with standard deviation of convergence and divergence dynamics for five subjects from two sessions.
Phoria level after vergence steps from session 1 is as follows: 3.5∆ eso, orthophore, 3.4∆ eso, 6.9∆eso and 1.9∆exo for subjects 1 through 5 respectively. The phoria
IV. DISCUSSION Another study provoked visual fatigue by repetition and showed a decrease in vergence peak velocity. [4] However, our study was conducted when the subjects selfreported fatigue due to lack of sleep, mental stress and/or an increased amount of visual tasks performed throughout the day. The novel findings of this experiment suggest that fatigue, due to various reasons, does not necessarily reduce the vergence dynamics, but may also increase vergence dynamics. Hence, phoria level plays an important role when the vergence system is fatigued by either increasing or decreasing its dynamics to alleviate the visual complaints. V. CONCLUSION Preliminary data suggests that 1) the subject’s phoria level influence both convergence and divergence dynamics and 2) the change in phoria level is correlated to the change in vergence dynamics. It is hypothesized that the phoria level may be one of the factors which can infer why some people are more prone to visual fatigue than others when they are performing a visual task. ACKNOWLEDGEMENTS This work is supported in part by the National Science Foundation (BES-0447713) and Essilor International. REFERENCES [1] T.L. Alvarez, J.L. Semmlow, W. Yuan, P. Munoz “Comparison of Disparity Vergence System Responses to Predictable and Nonpredictable Stimulations,” Current Psychology of Cognition, vol. 21, pp, 243-261, 2002. [2] D. S. Zee, E. J. Fitzgibbon, and L. M. Optican, “Saccade vergence interactions in humans,” Journal of Neurophysiology, vol. 68, pp. 16241641, 1992. [3] J.L. Semmlow, T.L. Alvarez, and C. Pedrono, “Dry dissection of Vergence Components using Independent Component Analysis,” Computers in Medicine and Biology, vol. 37 pp 903-909, 2007. [4] W. Yuan, J.L. Semmlow. “The Influence of Repetitive Eye Movements on Vergence Performance”, Vision Research,vol.40,pp3089-3098, 2000.